Abstract
Fluorescent molecular-guided surgery (FGS) is at a tipping point in terms of clinical approval and adoption in a number cancer applications, with ongoing phase 0 and phase 1 clinical trials being carried out in a wide range of cancers using a wide range of agents. The pharmacokinetics of each of these agents and the physiology of these cancers can differ vastly on a patient-to-patient basis, bringing to question: how can one fairly compare different methodologies (defined as the combination of imaging agent, system, and protocol) and how can existing methodologies be further optimized? To this point, little methodology comparison has been carried out, and the majority of FGS optimization has concerned system development—on the level of maximizing signal-to-noise, dynamic detection range, and sensitivity—independently from traditional agent development—in terms of fluorophore brightness, toxicity, solubility, and binding affinity and specificity. Here we propose an inclusion of tumor and healthy tissue physiology (blood flow, vascular permeability, specific and nonspecific binding sites, extracellular matrix, interstitial pressure, etc…) variability into the optimization process and re-establish well-described task-based metrics for methodology optimization and comparing quality of one methodology to another. Two salient conclusions were identified: (1) contrast-to-background variability is a simple metric that correlates with difficult-to-carry-out task-based metrics for comparing methodologies, and (2) paired-agent imaging protocols offer unique advantages over single-imaging-agent studies for mitigating confounding tumor and background physiology variability.
Keywords: Paired-agent imaging, compartment modeling, Fluorescence guided surgery, contrast-to-variance ratio, tumor-to-background ratio, sensitivity, specificity
1. INTRODUCTION
Countless different metrics that have been used to evaluate image quality exist across a diverse spectrum of applications: from biomedical, astronomy, to military. In his seminal textbook on the Foundations of Image Science (1), Harrison Barrett proposed that the only metric that should matter is the task-based evaluation: i.e., how well does the proposed methodology perform at its implied task. In molecular-guided surgery, the goal of a methodology is ultimately to prolong patient survival and improve quality of life. Of course, carrying out a 20-year study to assess the qualities of every newly proposed methodology or improvement to an existing methodology is untenable. More simply, the task could be defined as a discrimination of whether a region-of-interest (ROI) is cancerous or not. In principle, one could simplify this to the “ideal-observer” if the truth in an image is known by carrying out a receiver-operating-characteristic (ROC) curve for any specific methodology. Then, any methodology with a higher area-under-the-curve (AUC) of the ROC would generally be expected to perform better at the task of discrimination than a competing methodology with a lower AUC of the ROC. Aside: this precludes other important comparisons, such as cost, potential patient side-effects, and ease of use, which would also need to be considered. Unfortunately, in molecular-guided surgery it can be difficult to know the absolute truth, which might conceivably require tissue from each pixel in an image to be removed and independently assayed to establish whether each was truly negative or positive for cancer.
2. METHODS
2.1. Image quality metrics
This work proposes a much simpler metric for approximating the AUC of the ROC: the contrast-to-variability metric:
| [1] |
where μT and μB represent the mean signals measured in representative regions of the image that are known to be tumor positive and negative, respectively, and σT and σB represent the respective standard deviations in these mean signals. A more commonly used metric in molecular-guided surgery has been the “tumor-to-background” ratio, simply:
| [2] |
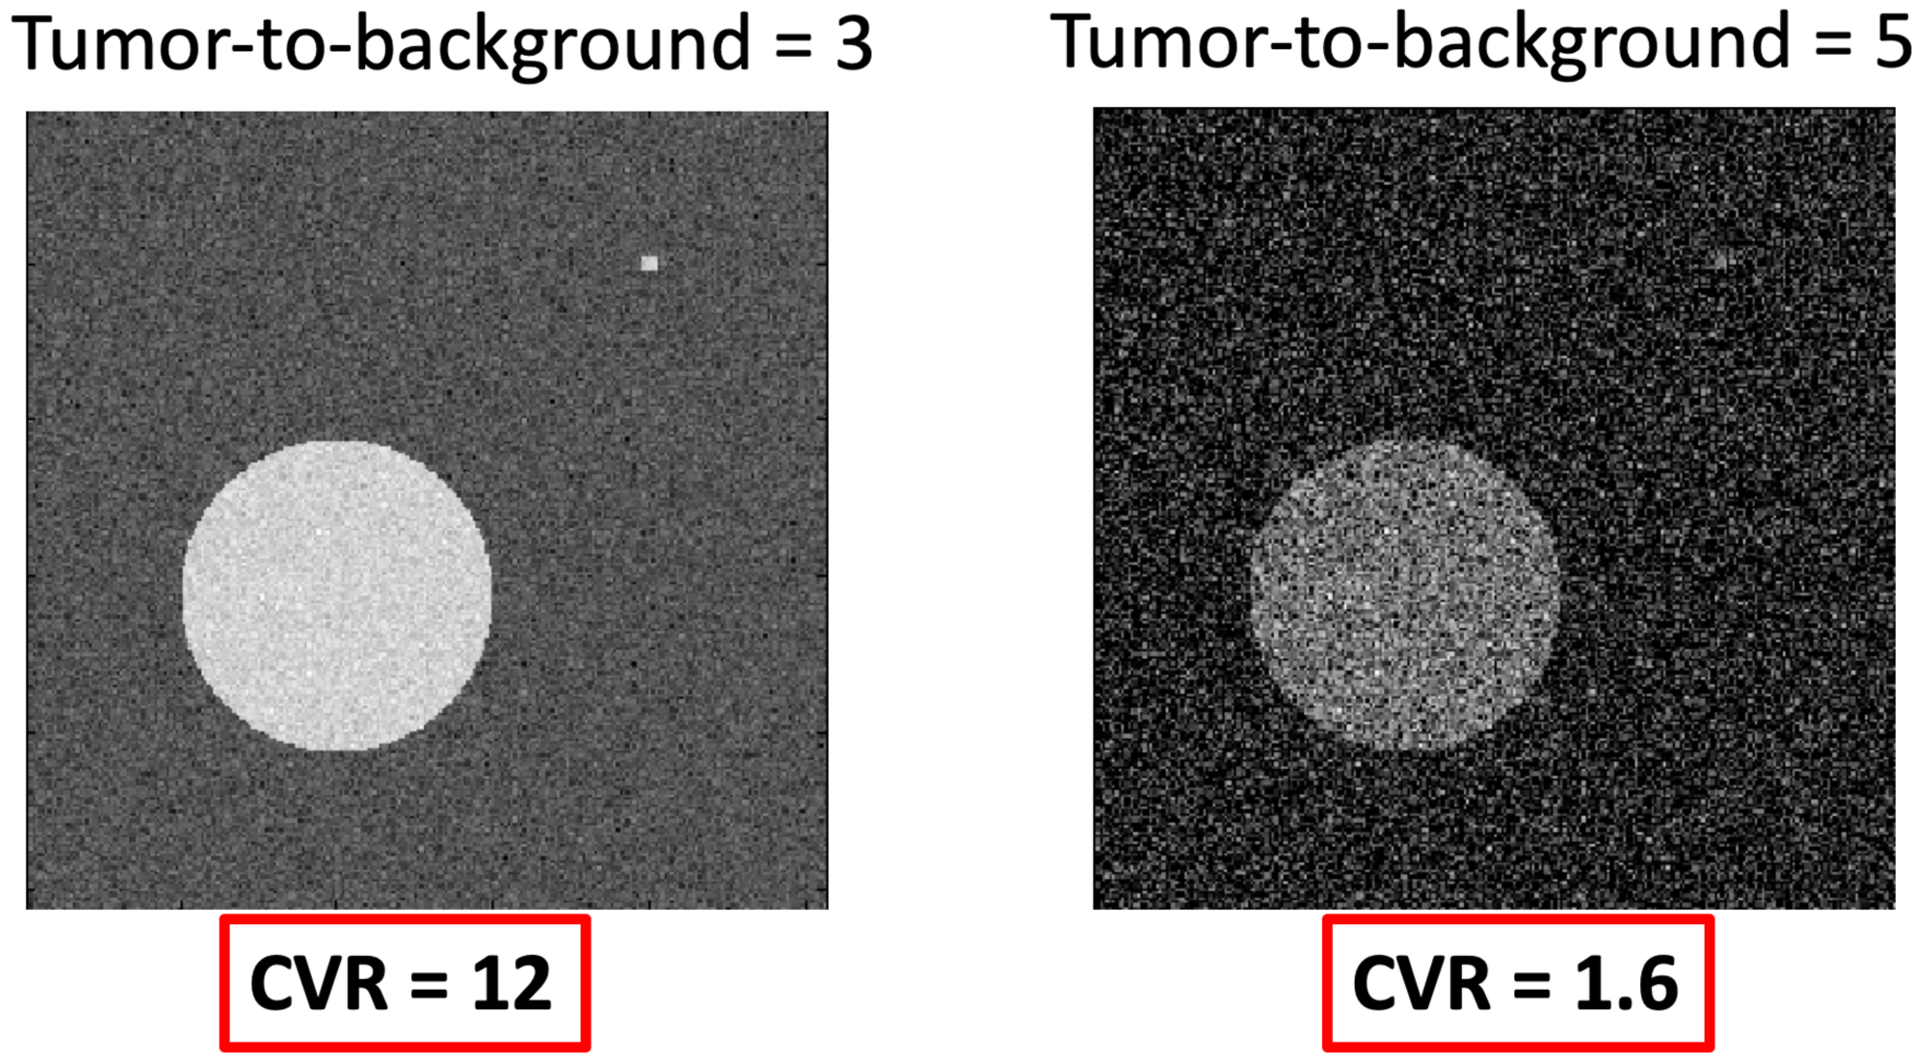
however, while this metric has some rudimentary value in comparing methodologies, its inability to account for variation in the signal makes it ill-suited for predicting the result of a task-based evaluation. Figure 1 presents some preliminary simulation results comparing the both CVR and TBR to the AUC of the ROC for a range of μT, μB, σT and σB.
Figure 1.

Comparison of tumor-to-background ratio (TBR) and contrast-to-variance ratio (CVR) in example noise-added images, with large and small inclusions.
An example of the relevance of CVR over TBR is presented in Fig. 1 where the left image has a TBR of only 3, but much better noise statistics than the image on the right with a TBR of 5, allowing easier identification of the large and small circular regions of interest. However, evaluation of the CVR in both cases demonstrates a >6 times higher CVR in the left image than the right, matching the clear improvement of the left image over the right in terms of identifying the two inclusions.
2.2. Simulations
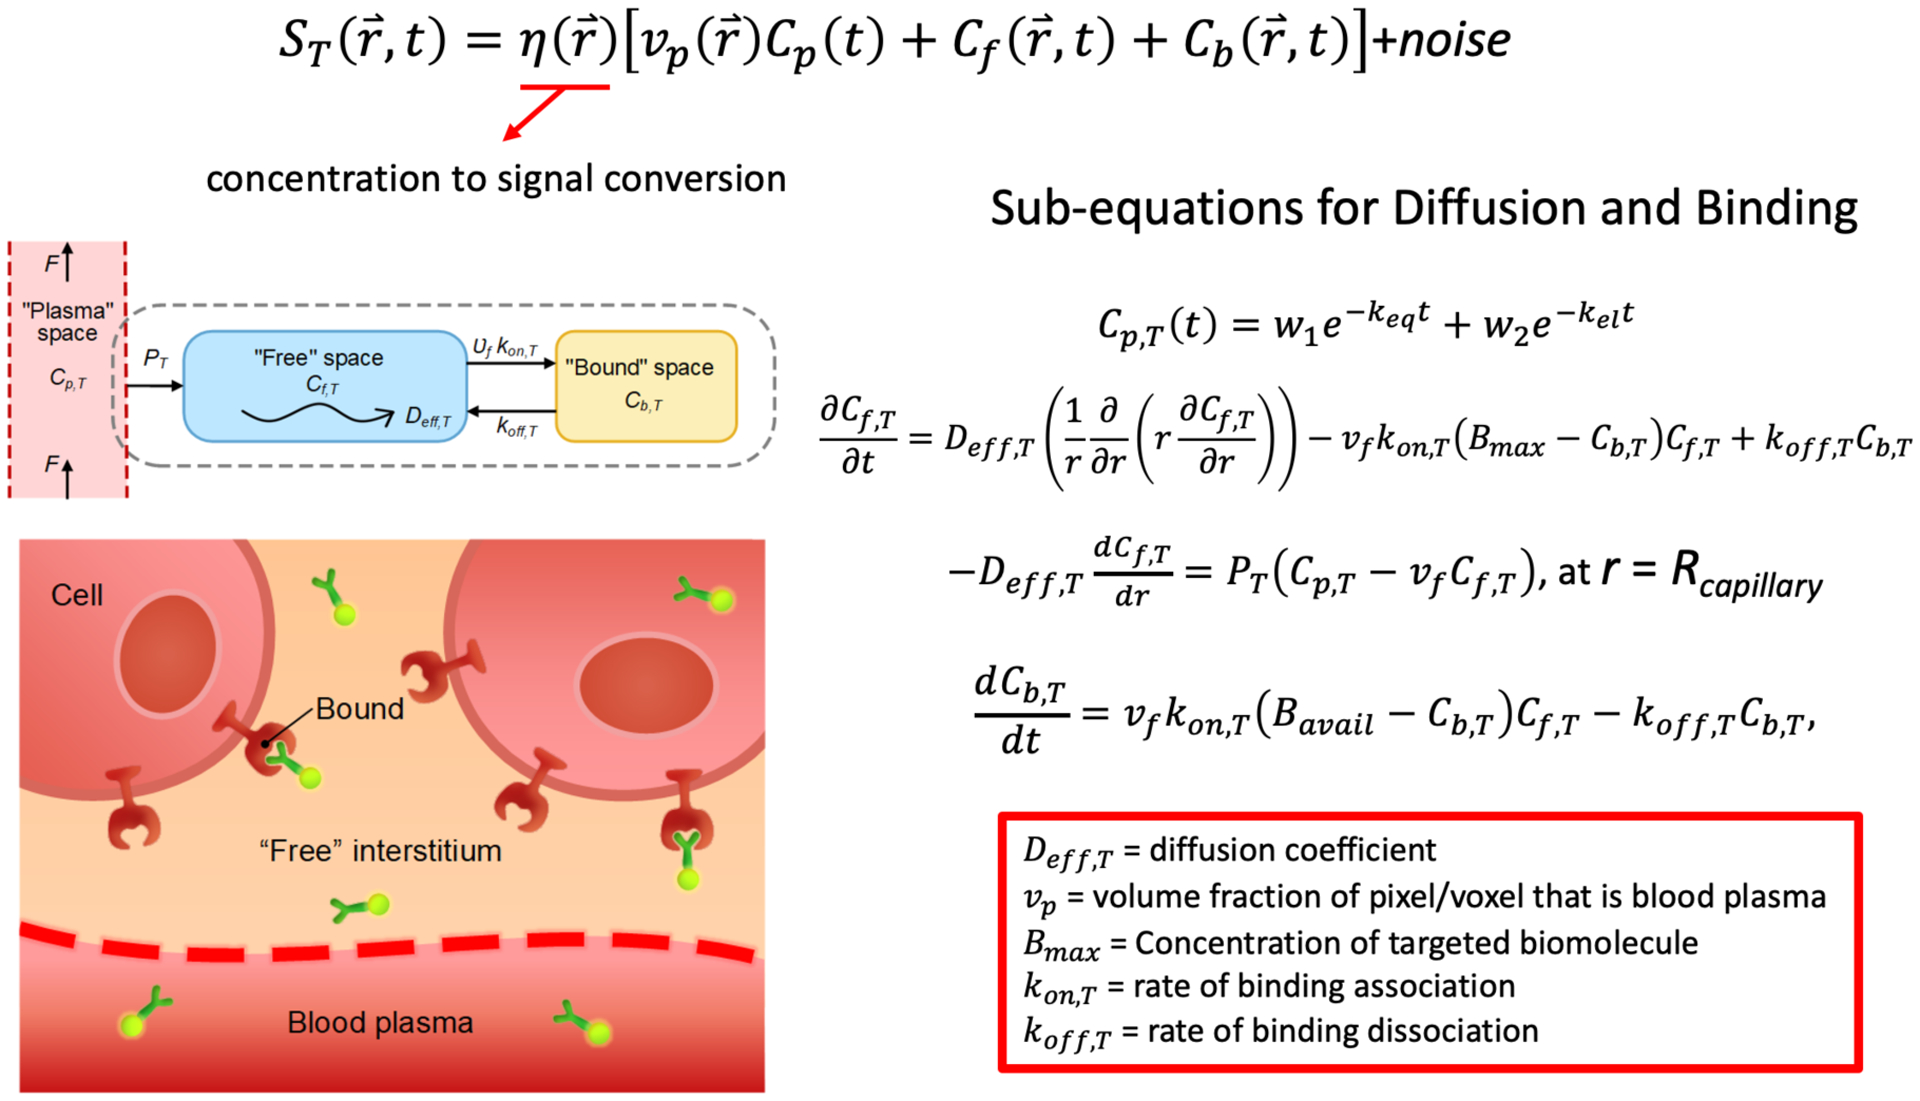
Contrast curves of cell-surface receptor targeted imaging agents were created using a six-stage, fifth-order Runge-Kutta ordinary differential equation solver, ode45() in MATLAB (R2019a, Mathworks, Natick, MA), directly applied to the systems of differential equations presented in Fig. 2. Resulting curves were interpolated to 4 h time windows for small-imaging agent like conditions and for 3–6 days for antibody-like imaging agents. Plasma input functions were created from average plasma input functions of ABY-029 (an affibody based fluorescent agent) and fluorescent cetuximab (an antibody based agent) (2, 3). Extravasation and efflux rate constants, K1 and k2, were set to match that known for affibodies and antibodies, and equal to 0.1 min−1 and 0.08 min−1, for affibody in EPR tumor for 1–10 kDa sized imaging agents in animal and human tumor imaging experiments (4, 5).
Figure 2.

Mathematical models of measured signal based on biological and imaging agent properties.
3. RESULTS
3.1. Simulations
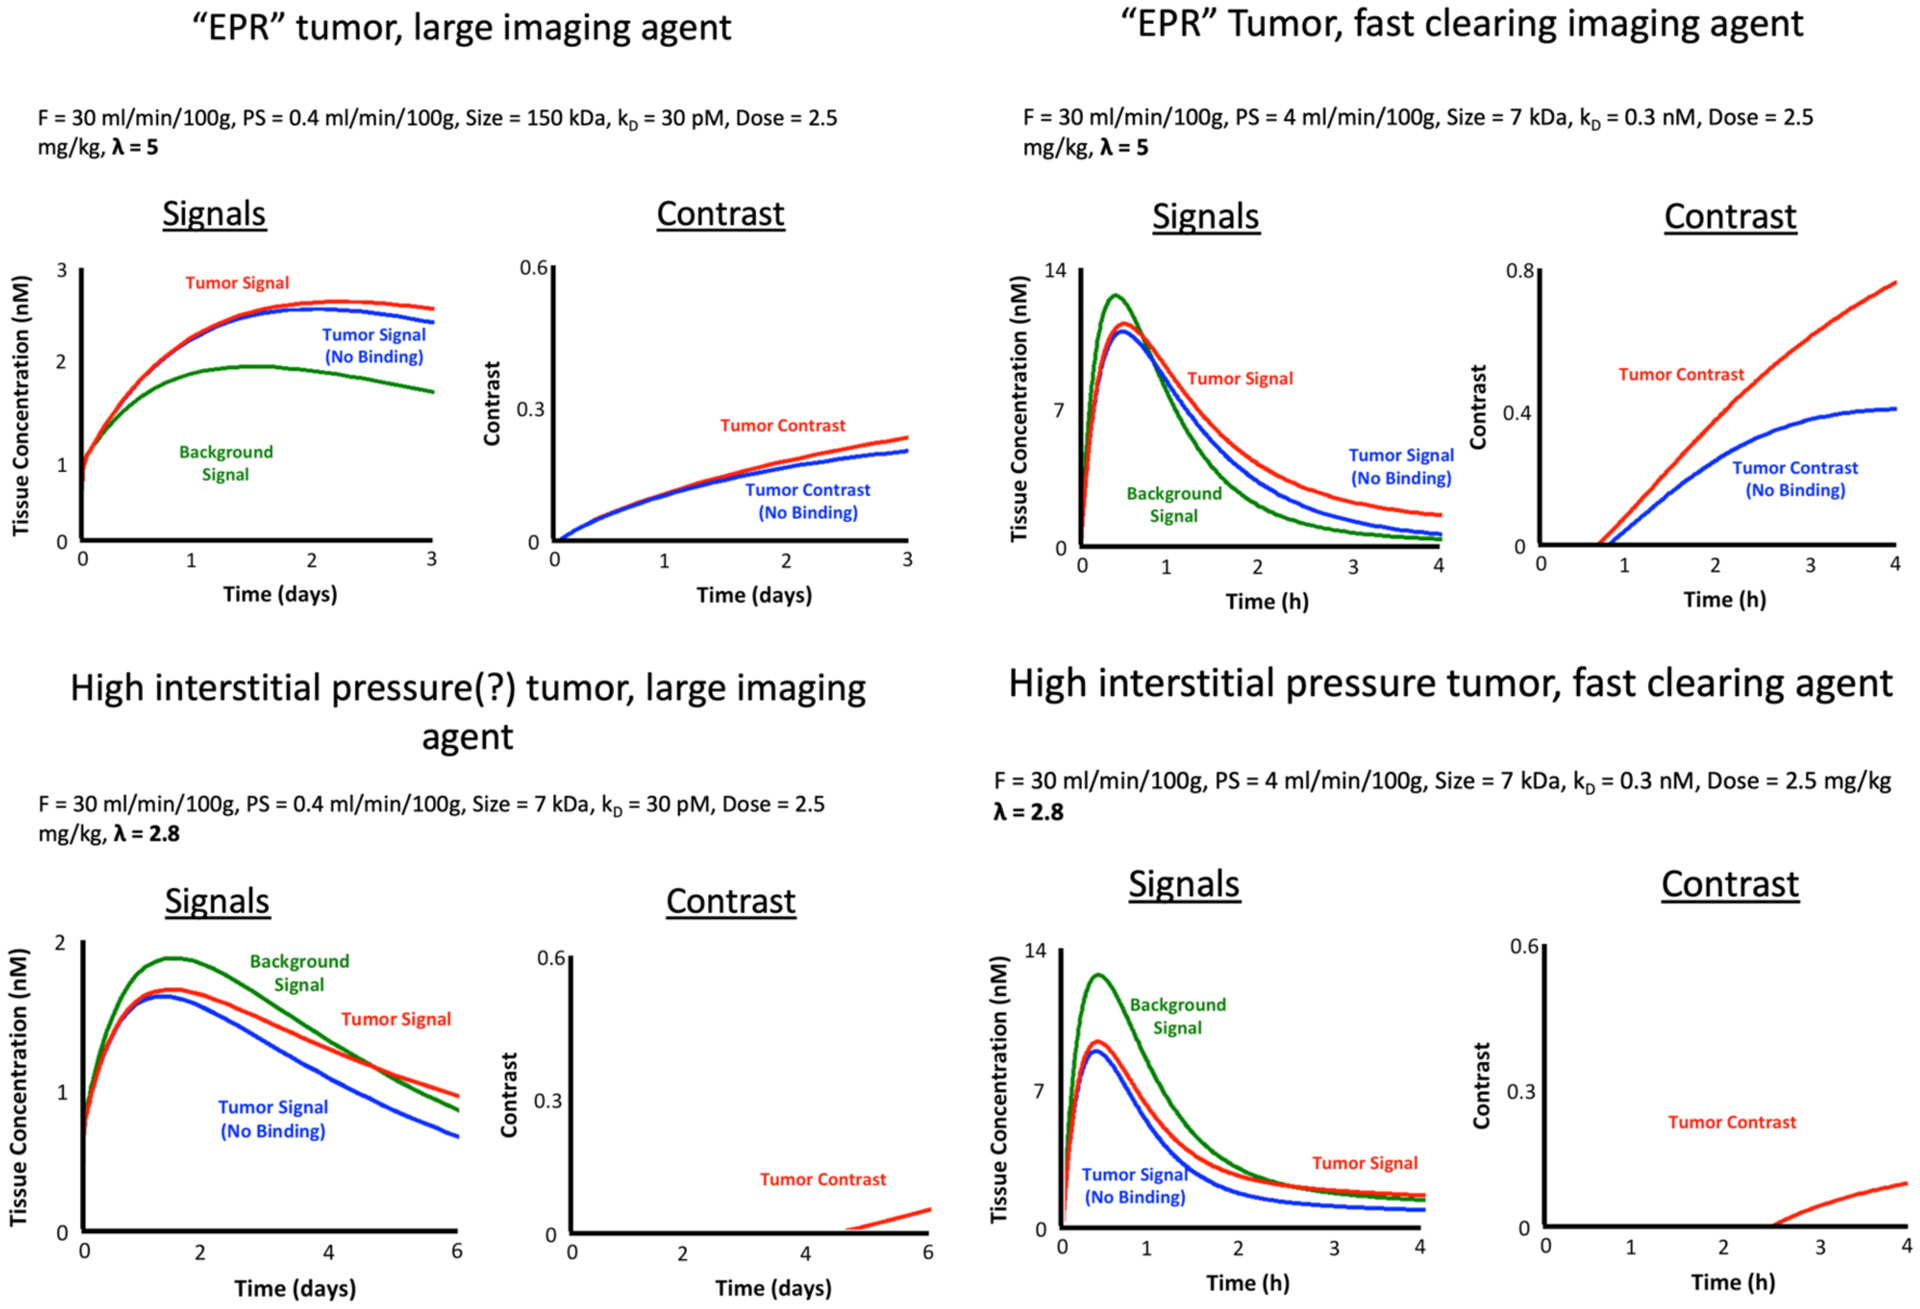
By identifying a simplistic metric—the CVR—that can act as a surrogate for image quality in molecular-guided surgery, it becomes valuable to develop and validate mathematical models of contrast and signal variation that may be expected clinically, particularly in the context of exogenously administered molecular targeted imaging agents. Such models can all manner of parameters to be evaluated in with respect to their effects on CVR. These parameters can include imaging system characteristics (gain, filtering, dynamic range of the detector, exposure, sensitivity, light source, hyperspectral, multi-modality etc…), imaging agent characteristics (plasma pharmacokinetics, plasma protein binding, size, charge, lipophilicity, binding on and off rates, affinity, nonspecific binding, etc…), tissue physiology characteristics (tumor and healthy tissue blood flow, vascular permeability, interstitial pressure, extracellular matrix, lymphatic drainage, etc…), imaging protocol specifics (timing of image or images, multiple imaging agents, etc…), and image processing specifics (kinetic modeling, machine learning, pattern recognition, etc…). As an initial demonstration of what such a model is capable of, Fig. 3 presents estimation of tumor and background signals (as well as contrast) under four conditions; a slow clearing antibody like agent an “EPR” tumor (one with high enhanced permeability and retention effects) and in a high interstitial pressure tumor (low EPR); comparatively, these two tumor states were evaluated in terms of a fast clearing imaging agent.
Figure 3.

Contrast modeling example results
4. DISCUSSION
In shot-noise limited imaging, TBR works will as an indicator of image quality; however, when the noise statistics change, for instance with paired-agent imaging (6, 7), fluorescence lifetime imaging (8), hyperspectral imaging (9), or Raman imaging (10, 11), TBR can change drastically amongst images that have equal quality, while the CVR remains within 5%. It is recommended that to compare different methodologies/technologies for improving molecular-guided surgery, we all start using CVR instead of TBR to estimate image quality.
5. ACKNOWLEDGEMENTS
This work was funded by a NIH R37 CA212187 and an NSF CAREER Award (1653627).
REFERENCES
- 1.Barrett HH, and Myers KJ, Foundations of Imaging Science, Wiley-Interscience; (2004). [Google Scholar]
- 2.Samkoe KS et al. , “Toxicity and Pharmacokinetic Profile for Single-Dose Injection of ABY-029: a Fluorescent Anti-EGFR Synthetic Affibody Molecule for Human Use,” Molecular imaging and biology : MIB : the official publication of the Academy of Molecular Imaging 19(4), 512–521 (2017). [DOI] [PMC free article] [PubMed] [Google Scholar]
- 3.Sexton K et al. , “Fluorescent affibody peptide penetration in glioma margin is superior to full antibody,” PLoS One 8(4), e60390 (2013). [DOI] [PMC free article] [PubMed] [Google Scholar]
- 4.de Lussanet QG et al. , “Dynamic contrast-enhanced MR imaging kinetic parameters and molecular weight of dendritic contrast agents in tumor angiogenesis in mice,” Radiology 235(1), 65–72 (2005). [DOI] [PubMed] [Google Scholar]
- 5.Tichauer KM et al. , “Advantages of a dual-tracer model over reference tissue models for binding potential measurement in tumors,” Physics in medicine and biology 57(20), 6647–6659 (2012). [DOI] [PMC free article] [PubMed] [Google Scholar]
- 6.Tichauer KM et al. , “Improved tumor contrast achieved by single time point dual-reporter fluorescence imaging,” J Biomed Opt 17(6), 066001 (2012). [DOI] [PMC free article] [PubMed] [Google Scholar]
- 7.Tichauer KM et al. , “Quantitative in vivo cell-surface receptor imaging in oncology: kinetic modeling and paired-agent principles from nuclear medicine and optical imaging,” Phys Med Biol 60(14), R239–269 (2015). [DOI] [PMC free article] [PubMed] [Google Scholar]
- 8.Pal R et al. , “Fluorescence Lifetime-Based Tumor Contrast Enhancement Using an EGFR Antibody-Labeled Near-Infrared Fluorophore,” Clin Cancer Res 25(22), 6653–6661 (2019). [DOI] [PMC free article] [PubMed] [Google Scholar]
- 9.Kim A et al. , “Quantification of in vivo fluorescence decoupled from the effects of tissue optical properties using fiber-optic spectroscopy measurements,” J Biomed Opt 15(6), 067006 (2010). [DOI] [PMC free article] [PubMed] [Google Scholar]
- 10.Jermyn M et al. , “Highly Accurate Detection of Cancer,” Cancer Res 77(14), 3942–3950 (2017). [DOI] [PubMed] [Google Scholar]
- 11.Lemoine É et al. , “Feature engineering applied to intraoperative in vivo Raman spectroscopy sheds light on molecular processes in brain cancer: a retrospective study of 65 patients,” Analyst 144(22), 6517–6532 (2019). [DOI] [PubMed] [Google Scholar]


