

Abstract
A major barrier for drug development is ensuring molecules can access intracellular targets. This is especially true for biomolecules, which are notoriously difficult to deliver to the cytosol. Many current methods for measuring the internalization of therapeutic biomolecules are largely indirect and qualitative, and they do not offer information about subcellular localization. We recently reported a new assay, called the ChloroAlkane Penetration Assay (CAPA), that addresses some of the drawbacks of existing methods. CAPA is high-throughput, quantitative, and compartment-specific, and can be used to monitor cytosolic penetration over time and under a variety of culture conditions. We have used CAPA to investigate the cytosolic localization of peptides, proteins, and oligonucleotides. In this chapter, we discuss the materials, protocols, and troubleshooting necessary to perform CAPA and appropriately analyze CAPA data. We end with a discussion about the applications and limitations of CAPA, and we speculate on the future potential of the assay and its variations.
Keywords: Cell penetration, Cytosolic localization, HaloTag, CAPA, Chloroalkane penetration assay, Drug Delivery, Protein Delivery, Peptide Drugs, Oligonucleotide drugs
1. INTRODUCTION
Only a minority of FDA-approved therapeutics act by binding proteins within the cytosol (Lau & Dunn, 2018; Verdine & Hilinski, 2012). One reason why therapies against intracellular drug targets are so difficult to develop is an inability to measure and control intracellular delivery (Dowdy, 2017; Torchilin, 2008; Yang & Hinner, 2015; W. Yin & Rogge, 2019). A molecule that can access the cytosol at a lower concentration will be more potent and therefore more effective. It could also be used in smaller doses, reducing off-target effects such as toxicity. However, the lack of understanding about how to make a molecule more cell-penetrant remains a major obstacle in the field (Pei & Buyanova, 2019; Peraro & Kritzer, 2018). Further, cellular penetration is difficult to measure, particularly if one wants quantitative data on the amount and subcellular location of the molecule of interest (Deprey, Becker, Kritzer, & Plückthun, 2019; Méndez-Ardoy, Lostalé-Seijo, & Montenegro, 2019; Peraro & Kritzer, 2018).
These obstacles are even more difficult when developing biomolecules as therapeutics. Some biomolecules are passively penetrant, meaning that they are able to directly cross the plasma membrane and enter the cytosol in an energy-independent manner (Dougherty, Sahni, & Pei, 2019; Kauffman, Fuselier, He, & Wimley, 2015; Matsson, Doak, Over, & Kihlberg, 2016). Passively penetrant molecules include those that are relatively small and non-polar, but also some cell-penetrating peptides at high concentrations (Kauffman et al., 2015; Matsson et al., 2016; Pye et al., 2017). Most larger biomolecules, including peptides, proteins, and nucleic acids, are unable to enter passively. Instead, these molecules are taken up through endocytosis, and entrapped in intracellular vesicles called endosomes (Dougherty et al., 2019; Jiao et al., 2009; Mayor & Pagano, 2007; Pei & Buyanova, 2019). If a molecule is trapped inside an endosome, it is still physically separated from the rest of the cell. The molecule must escape the endosome in order to access the cytosol and other cellular compartments. This endosomal escape process is poorly understood because it is often low efficiency, and because it is difficult to measure due to the limitations of most cell penetration assays (Deprey et al., 2019; Pei & Buyanova, 2019; Peraro & Kritzer, 2018).
In our discussions of endosomal escape and cell penetration, we use the term “total cellular uptake” to describe all molecules associated with a cell, which includes molecules trapped in the endosome and molecules that have escaped the endosome. We use “cytosolic localization” to describe only the molecules that have escaped the endosome and reached the cytosol. We emphasize the importance of this distinction in discussions surrounding cell penetration (Deprey et al., 2019), as only the cytosolically-localized molecules typically exert a therapeutic effect.
The most common methods that are used to measure cellular internalization of a molecule are fluorescence-based methods. In this type of assay, the molecule of interest is covalently conjugated to a fluorophore, and the extent of uptake is measured by flow cytometry or fluorescence microscopy (Bird et al., 2016; Chu et al., 2015; Fischer, Köhler, Fotin-Mleczek, & Brock, 2004; Richard et al., 2003). While flow cytometry is high-throughput, it does not distinguish between subcellular compartments. Thus, flow cytometry will typically give a positive signal if a molecule has a high degree of total cellular uptake, but this signal may be due to material trapped in endosomes and not material that has localized to the cytosol. Confocal fluorescence microscopy, on the other hand, allows one to visualize the subcellular localization of fluorophore-conjugated molecules, but this method lacks throughput and quantitation.
Other, non-fluorescence-based assays can be used to monitor total cellular uptake and/or cytosolic localization. In a mass spectrometry-based cell penetration assay, cells are incubated with a molecule of interest and lysed, and then the lysates are spiked with a known concentration of a deuterated control. Mass spectrometry is used to detect internalized molecule in the lysates, and the internal control is used for quantitation (Aubry et al., 2010; Burlina, Sagan, Bolbach, & Chassaing, 2005, 2006). This method is quantitative, but it does not distinguish between endosomal and cytosolic material. Reporter assays typically involve labeling a molecule of interest with a specific ligand designed to alter gene expression. These assays use a cell line that expresses a reporter only when its ligand is present, so expression of the reporter indicates that the ligand-molecule of interest conjugate has accessed the cytosol and/or nucleus (Kang, Cho, & Kole, 1998; Wadia, Stan, & Dowdy, 2004; Yu, Liu, & Kodadek, 2005). Reporter-based assays are sensitive and high throughput, but they are indirect and they lack precise quantitation because the signal is amplified. The limitations of these common methods have been widely demonstrated (Birch, Christensen, Staerk, Franzyk, & Nielsen, 2017; Hedegaard et al., 2018; Holub, Larochelle, Appelbaum, & Schepartz, 2013; Puckett & Barton, 2009), inspiring many investigators to develop novel ways to avoid some of these limitations (Holub et al., 2013; Kim et al., 2015; Larochelle, Cobb, Steinauer, Rhoades, & Schepartz, 2015; Milech et al., 2015; Qian, Dougherty, & Pei, 2015; Verdurmen, Luginbühl, Honegger, & Plückthun, 2015a). The full extent of the methods available to measure the cellular internalization of a molecule of interest is beyond the scope of this chapter, and we direct the reader to more comprehensive reviews (Deprey et al., 2019; Méndez-Ardoy et al., 2019; Peraro & Kritzer, 2018).
In 2017, we reported a new assay that addresses many of the drawbacks of commonly used cellular penetration assays (Peraro et al., 2017). The chloroalkane penetration assay (CAPA) measures cytosolic localization of molecules of interest in a high throughput and highly quantitative manner. In 2018, we demonstrated that CAPA can be used to assess the cytosolic localization of peptides with respect to concentration, time, temperature, and the presence of serum (Peraro et al., 2018). Further, we used CAPA to explain differences observed in the activity of a bioactive peptide, providing a unique dataset that contributed to ongoing SAR studies (Peraro et al., 2018). We have previously demonstrated that CAPA can be used to analyze the cytosolic localization of small molecules and peptides, and ongoing work in the lab focuses on proteins, nanoparticles, and oligonucleotides. CAPA has been adopted by several other groups (Cai et al., 2019; Foley, Potjewyd, Lamb, James, & Frye, 2019; Lamb et al., 2019; López-Andarias et al., 2020; Shin, Hyun, Lee, & Lim, 2018). and so far has served as a useful tool to compare specific characteristics that enhance the internalization of peptides, peptoids, cyclotides, and bivalent chemical degraders (Cai et al., 2019; Foley, Potjewyd, Lamb, James, & Frye, 2019; Lamb et al., 2019; Peraro et al., 2018, 2017; Shin et al., 2018; H. Yin et al., 2020). In addition, other groups are beginning to adapt CAPA to other readouts to increase throughput and incorporate high-content imaging (Lamb et al., 2019; López-Andarias et al., 2020).
This article provides a more detailed description of the implementation of CAPA, including experimental protocols, preferred methods for data analysis, and tips for troubleshooting. CAPA requires only straightforward manipulations and no specialized equipment beyond a benchtop flow cytometer. Thus, we expect CAPA to be adaptable to a wide range of molecule types, cell lines, and applications.
2. CHLOROALKANE PENETRATION ASSAY (CAPA)
2.1. Overview of CAPA
CAPA takes advantage of the HaloTag protein, originally developed by Wood and co-workers (Los et al., 2008). HaloTag is a mutant bacterial haloalkane dehalogenase that has been modified to react irreversibly with a chloroalkane ligand. The chloroalkane fits into the deep and narrow active site of HaloTag, while anything attached to the chloroalkane tag remains outside the pocket (Fig 1A). The reaction between HaloTag and the chloroalkane is bioorthogonal and proceeds with rapid kinetics (Encell et al., 2012; Los et al., 2008). CAPA uses a cell line that stably expresses HaloTag exclusively in the cytosol, anchored to the cytosolic face of the outer mitochondrial membrane (Ballister, Aonbangkhen, Mayo, Lampson, & Chenoweth, 2014).
Figure 1. The chloroalkane penetration assay (CAPA).
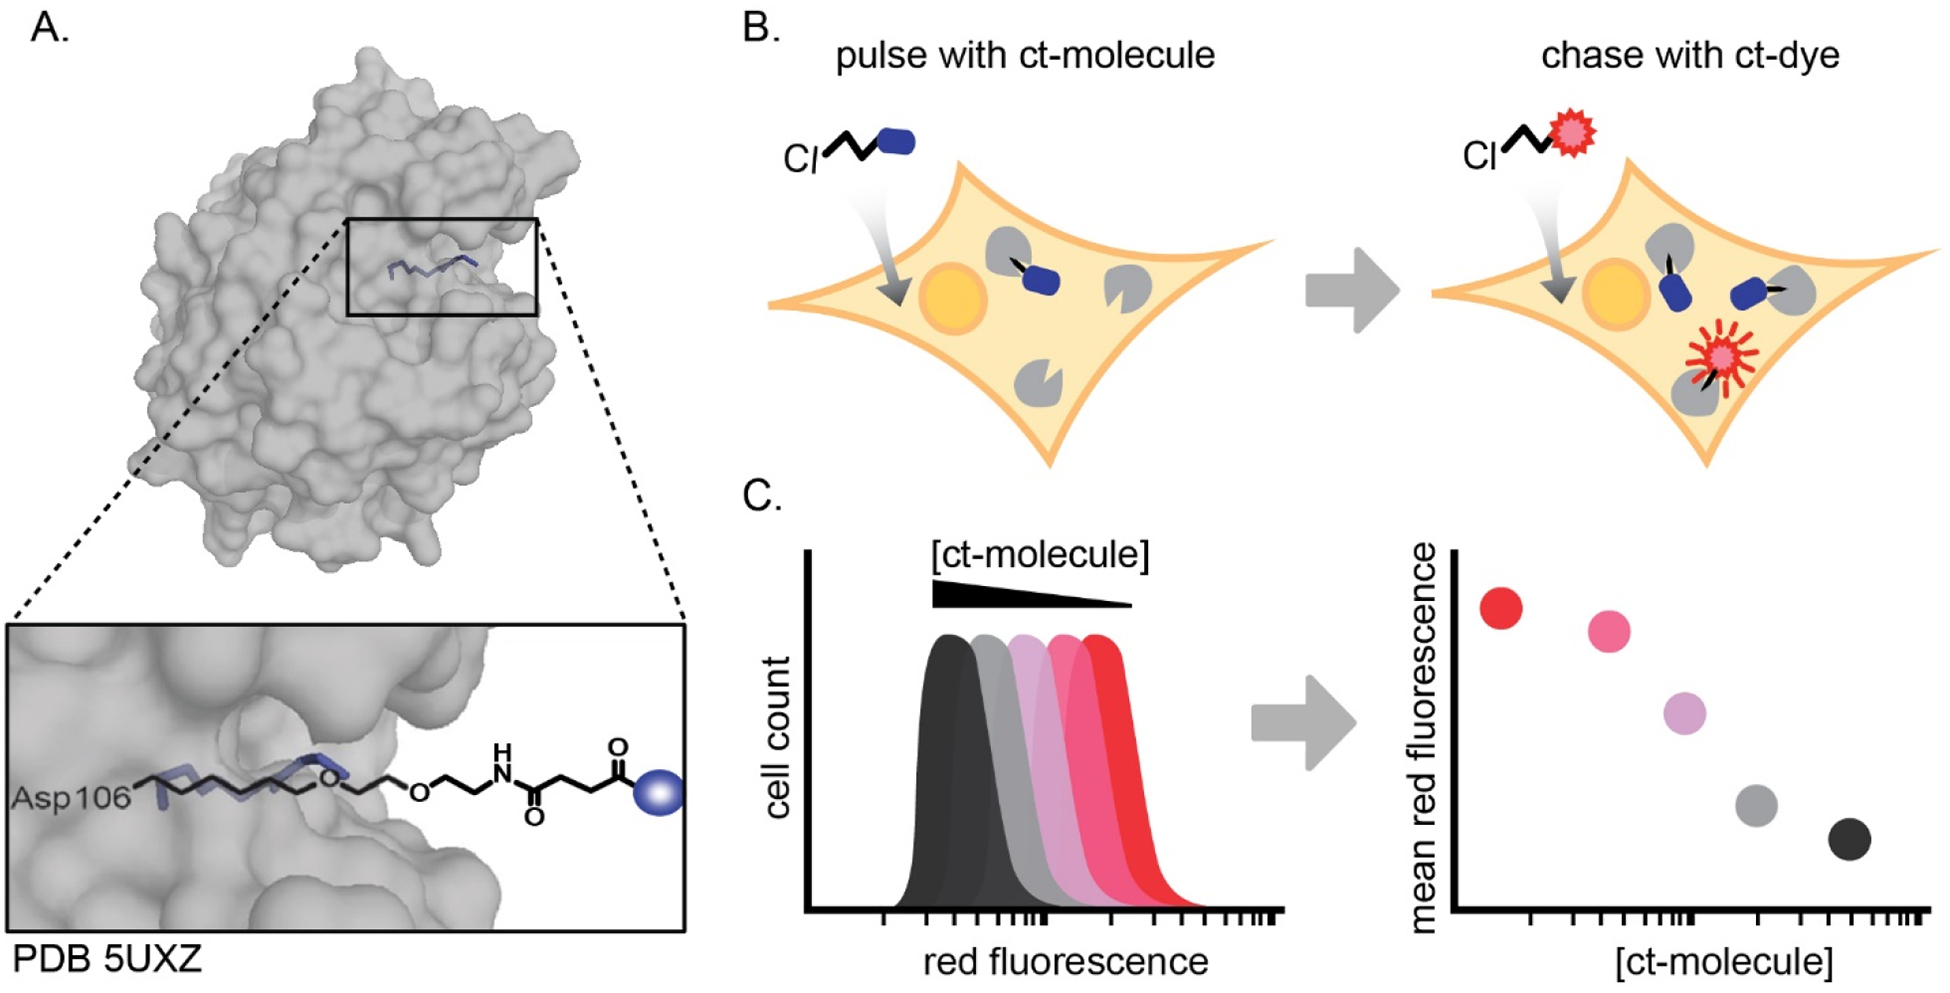
(A) Structure of ligand-bound HaloTag (PDB 5UXZ), with only the linker shown (Liu et al., 2017). Overlay shows a commonly used linker and its relative positioning within the HaloTag active site; blue sphere denotes a molecule-of-interest attached to the chloroalkane and linker. HaloTag is expressed in the cytosol of the CAPA cell line and reacts covalently with chloroalkane-tagged molecules in a deep active site pocket. (B) Schematic of CAPA. Cells are pulsed with a ct-molecule, chased with ct-dye, and analyzed by flow cytometry. (C) The mean red fluorescence of the histogram of 5,000 cells at each concentration is plotted as a single point on a plot of red fluorescence versus concentration of ct-molecule. The dose dependence typically follows a sigmoidal curve, and an IC50 curve fit is used to calculate the midpoint (CP50) value.
In CAPA, the HaloTag-expressing cell line is pulsed with a chloroalkane-tagged molecule of interest (“ct-molecule”). If the ct-molecule reaches the cytosol, it will react with HaloTag and block a portion of HaloTag active sites. A subsequent chase with a chloroalkane-tagged dye (“ct-dye”) allows the ct-dye to react with all remaining open HaloTag active sites (Fig 1B). The cells are then washed to remove unreacted dye, trypsinized, and analyzed by flow cytometry to measure the red fluorescence from the ct-dye (Peraro et al., 2018). The more cell-penetrant the molecule, the less red fluorescence that will be detected. Because the assay can be performed in a 96-well plate using small volumes, we typically test serial dilutions of chloroalkane-tagged molecules in parallel to provide a dose-dependence curve of cytosolic localization (Fig. 1C). In this way, the assay offers relative but precise quantitation of the extent of cytosolic localization of any ct-molecule of interest.
CAPA reads out HaloTag occupancy as a proportional, but indirect, measure of cytosolic localization. In an early control experiment, we sought to validate that decreased CAPA signal indeed correlates to a proportional increase in ct-molecule that covalently reacted with cytosolic HaloTag (Peraro et al., 2018). In this experiment, we performed CAPA with a ct-biotin, and we also lysed a portion of the cells after incubation with ct-biotin to analyze the HaloTag-biotin covalent adduct. After lysing the cells, we pulled down the HaloTag-biotin adduct with streptavidin beads and performed a Western blot to detect the HaloTag construct. We directly compared CAPA signal to degree of HaloTag biotinylation, and verified that CAPA signal was indeed inversely proportional to the degree to which HaloTag was modified by the exogenously added ct-molecule (Peraro et al., 2018).
To simplify discussion, in subsequent sections we will use “ct-molecule” or “ct-functional group” to denote a chloroalkane-tagged molecule or functional group, such as “ct-Tat” or “ct-COOH”.
2.2. Key advantages of CAPA
CAPA offers many advantages over other cell penetration assays. Importantly, CAPA provides information about exclusively cytosolic localization, and is not confounded by endosomally trapped material. This is because HaloTag is genetically encoded to be present only in the cytosol; any signal is a result of the ct-molecule escaping the endosome and localizing to the cytosol. Further, the CAPA readout is non-amplified, which provides a direct relationship between assay signal and cytosolic localization. Thus, the assay provides a direct comparison of the degree of cytosolic localization for many molecules, or among diverse experimental conditions.
Additionally, CAPA provides robust and readily standardized data, leading to highly reproducible results. For example, we typically obtain data for 5,000 cells per well and then plot the mean of each sample. These values are normalized to the minimum red fluorescence, which is measured directly as background fluorescence of the cells without ct-dye, and the maximum fluorescence, which is measured directly as the level of fluorescence when cells are incubated with ct-dye without being pulsed with any ct-molecule. This normalization ensures consistency day-to-day and batch-to-batch, and it allows for direct comparisons among molecules even when tested on different days. The CP50 value is calculated from a Hill equation curve fit (IC50 curve) of dose dependence of CAPA signal. We observe CP50 values are highly reproducible, due to the consistent expression of HaloTag, the robustness of measuring 5000 cells for each molecule at each concentration, and the normalization to experimentally measured minimum and maximum values. The CP50 is a direct measurement of the dose dependence of a ct-molecule’s cytosolic localization, and thus can be used to directly and quantitatively compare the extent of cytosolic localization among molecules of interest. Importantly, CAPA does not report the absolute number of molecules of ct-molecule that reached the cytosol (though, with some assumptions, one may convert a CP50 into a putative amount of molecules delivered; see section 7 for further discussion). Comparing two CP50 values is thus relative, but still highly quantitative. By comparing CP50 values and error values (see section 5.3), one can reproducibly distinguish twofold, or even 1.5-fold, differences between the degree of cytosolic localization of two ct-molecules (Peraro et al., 2018, 2017).
3. MATERIALS REQUIRED
3.1. Cell lines and cell culture media
HeLa cells stably expressing a HaloTag-GFP-mitochondrial localized construct (HGM cells) were used. This cell line was originally constructed as described (Ballister et al., 2014). Cells were cultured in high-glucose DMEM with 10% fetal bovine serum (FBS), 1% penicillin/streptomycin, and 1 μg/mL puromycin. HGM cells were thawed in 20 mL of antibiotic-free cell culture media (DMEM + 10% FBS), passaged once, and selected with 20 μg/mL puromycin in cell culture media. Cells were allowed to recover from selection, and once grown to near-confluency, they were ready to be used in CAPA. Cells were grown at 37 °C with 5% CO2 and passaged every 2–3 days. We routinely conduct CAPA experiments when the cells appear healthy and demonstrate robust HaloTag-GFP expression, typically between passages 3 and 14.
3.2. Synthesis of chloroalkane-carboxylic acid
The chloroalkane-carboxylic acid (ct-COOH) tag is synthesized in four major steps, as described previously (Peraro et al., 2018). The overall synthesis is summarized in Figure 2, and it is described here at a 20 mmol scale, though we have scaled up to a 50 mmol scale with no major adjustments. The synthesis begins with 20 mmol of 2-(2-aminoethoxy)ethanol dissolved in ethanol at 0 °C. Then, 20 mmol of di-tertbutyl-dicarbonate (Boc2O) was added and the reaction was stirred at room temperature for 2 h. The reaction mixture was extracted with DCM, and the organic layers were washed with brine, dried over Na2SO4, and concentrated under vacuum. The product of this reaction is referred to as compound 1.
Figure 2. Synthesis of chloroalkane tag.
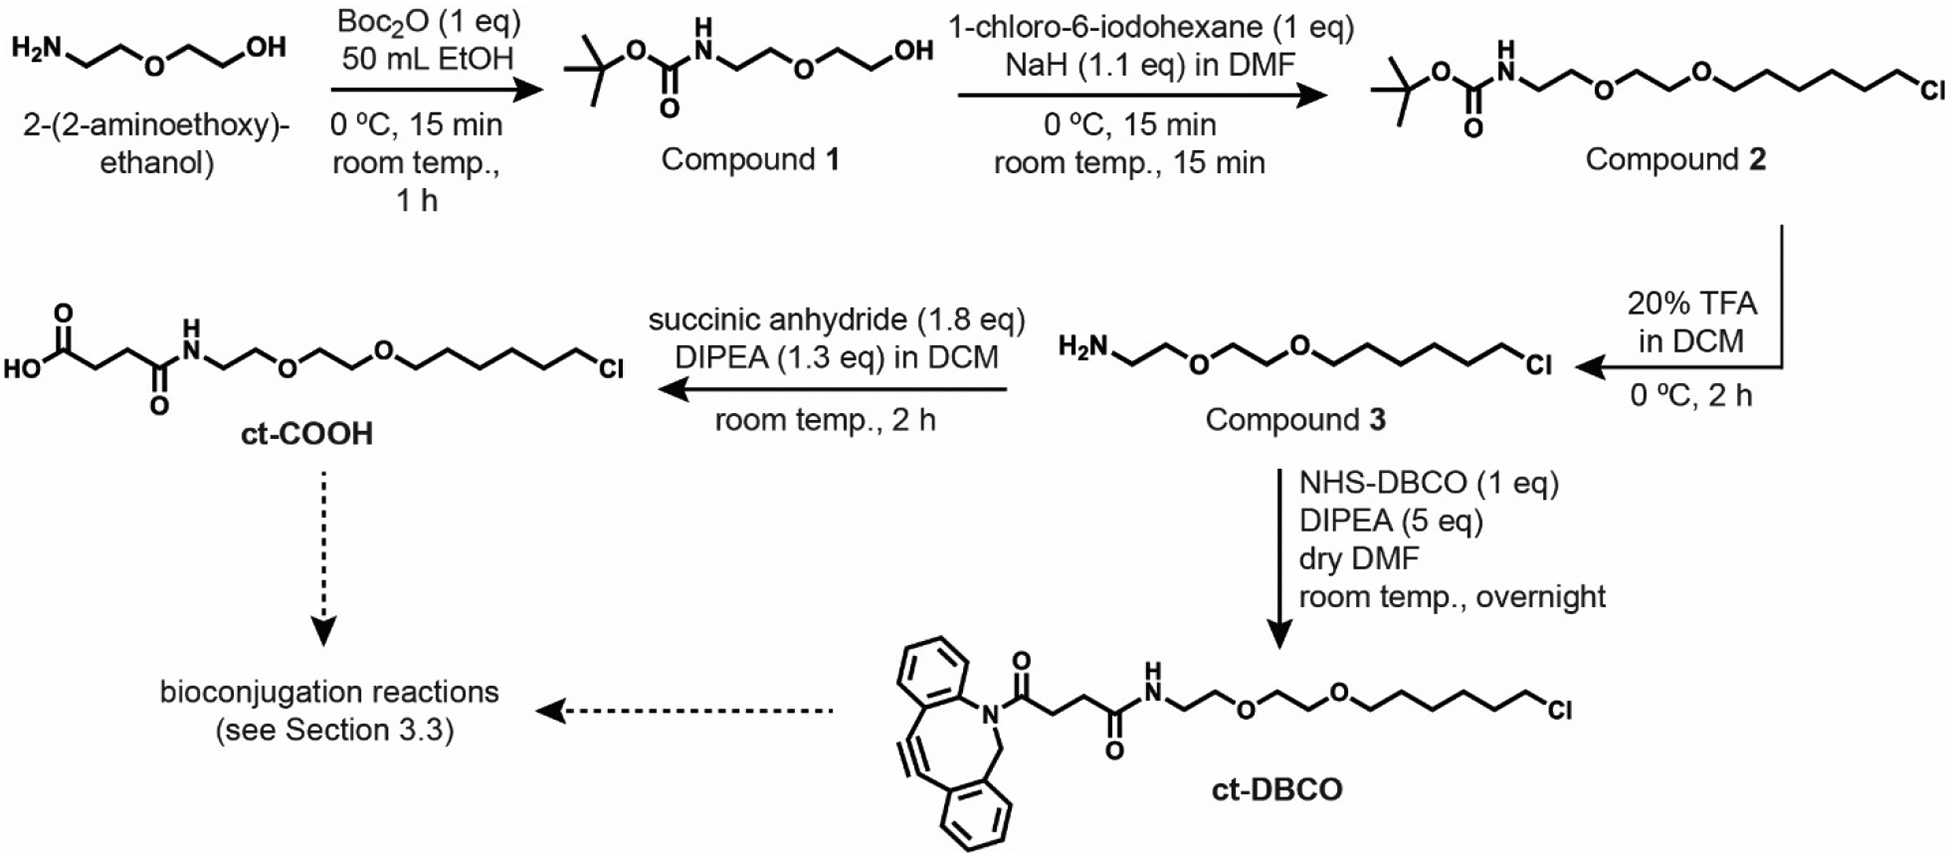
The first step is a nucleophilic acyl substitution with ditertbutyl-dicarbonate to protect the free amine of 2-(2-aminoethoxy)-ethanol with Boc protecting group, to obtain compound 1. The second step is an SN2 reaction under basic conditions to obtain compound 2. Then the Boc group is deprotected under acidic conditions to yield the free amine, compound 3. Compound 3 can be used for conjugation to a molecule or interest, or it can be reacted with succinic anhydride under basic conditions to yield ct-COOH, or it can be reacted with a dibenzocyclootyne-succinimidyl ester to yield ct-DBCO, or it can be reacted with a tetramethylrhodamine succinimidyl ester to yield ct-TMR (not shown).
Compound 1 was dissolved in approximately 20 mL of dry DMF. 1 eq of NaH (60% suspension in mineral oil) was added at 0 °C. After 30 min, 1.2 eq of 1-chloro-6-iodohexane was added slowly to the reaction and stirred at room temperature for 30 min. 1 M HCl was used to quench the reaction, and the mixture was extracted with ethyl acetate. The organic layers were washed with brine, dried over Na2SO4, and concentrated under vacuum. The desired product was purified by silica column chromatography with a gradient of 20:80 ethyl acetate:hexanes to 50:50 ethyl acetate:hexanes as the mobile phase. Elution fractions were monitored by TLC, and the fractions containing compound 2 were combined and concentrated.
Pure compound 2 was stirred in dry DCM and 20% TFA at 0 °C for 2 h to remove the Boc group. Solvent was removed via rotary evaporation, and the deprotected compound 3 was re-dissolved in MeOH and neutralized with K2CO3. The reaction mixture was filtered and concentrated, then extracted with ethyl acetate, washed with brine, and concentrated. Compound 3 is a chloroalkane-amine suitable for direct coupling to carboxylic acids, or for further derivatization to enable other conjugation chemistries (for example, a copper-free “click” cycloaddition reaction; see section 3.3.4).
For the final step of the synthesis of the chloroalkane-carboxylic acid, compound 3 was dissolved in 30 mL DCM and placed under dry nitrogen. Diisopropylethylamine (3 eq) was added and the mixture was stirred at room temperature for 5 min. Succinic anhydride (1.5 eq) was added to the reaction and stirred at room temperature for 1 h, then the reaction was quenched with 1 M HCl. The organic layers were washed with brine, dried over Na2SO4, and concentrated. The crude product was purified with reverse-phase HPLC using a preparatory C18 column with a gradient of water and acetonitrile in 0.1% trifluoroacetic acid. The final product was verified by MALDI-TOF MS and 1H NMR. Our final overall yields for the four-step synthesis of the chloroalkane-carboxylic acid are typically around 30%.
3.3. Conjugation of chloroalkane to molecules of interest (ct-molecule)
We have used several common conjugation chemistries to link chloroalkane groups to molecules of interest, including small molecules, peptides, proteins, and oligonucleotides. As examples, here we describe on-resin amide bond formation between the chloroalkane-carboxylic acid and the N-terminus of a peptide (section 3.3.1), solution-phase amide bond formation with chloroalkane-carboxylic acid and an 18-mer single-stranded oligonucleotide with a 5′ amine (section 3.3.2), solution-phase amide bond formation of chloroalkane-amine and a N-hydroxysuccinimidyl ester-functionalized dye (section 3.3.3), and solution-phase cycloaddition with chloroalkane-DBCO and an 18-mer single-stranded oligonucleotide with a 5′ azide (section 3.3.4).
3.3.1. On-resin amide bond formation using chloroalkane-carboxylic acid
For preparing peptides with an N-terminal chloroalkane tag, we routinely couple chloroalkane-carboxylic acid to the N-terminus of a peptide while it is still on resin. 2.5 eq of chloroalkane-carboxylic acid, 2.5 eq PyBOP, and 5 eq diisopropylethylamine were dissolved in DMF and added to N-terminally deprotected peptide on resin. The resin was shaken at room temperature for 1 h (Fig 3A). Efficiency of the coupling reaction was monitored with a Kaiser test and/or by removing a small amount of resin, cleaving using 50 μL TFA, diluting with 50:50 water:acetonitrile, and performing MALDI-TOF MS on the cleaved sample. If the reaction still contained untagged peptide, a second coupling reaction was performed. The ct-peptide was cleaved from resin using 95% TFA, 2% H2O, 2% 1,2-ethanedithiol, and 1% triisopropylsilane and precipitated with cold ether (Chan & White, 2000). Product was purified by reverse-phase HPLC, using a gradient of 5–100% solvent B over 20 min on a preparatory C18 column (solvent A: water with 0.1% TFA; solvent B: acetonitrile with 0.1% TFA).
Figure 3. Chloroalkane tag reaction schematics and conjugation efficiencies.
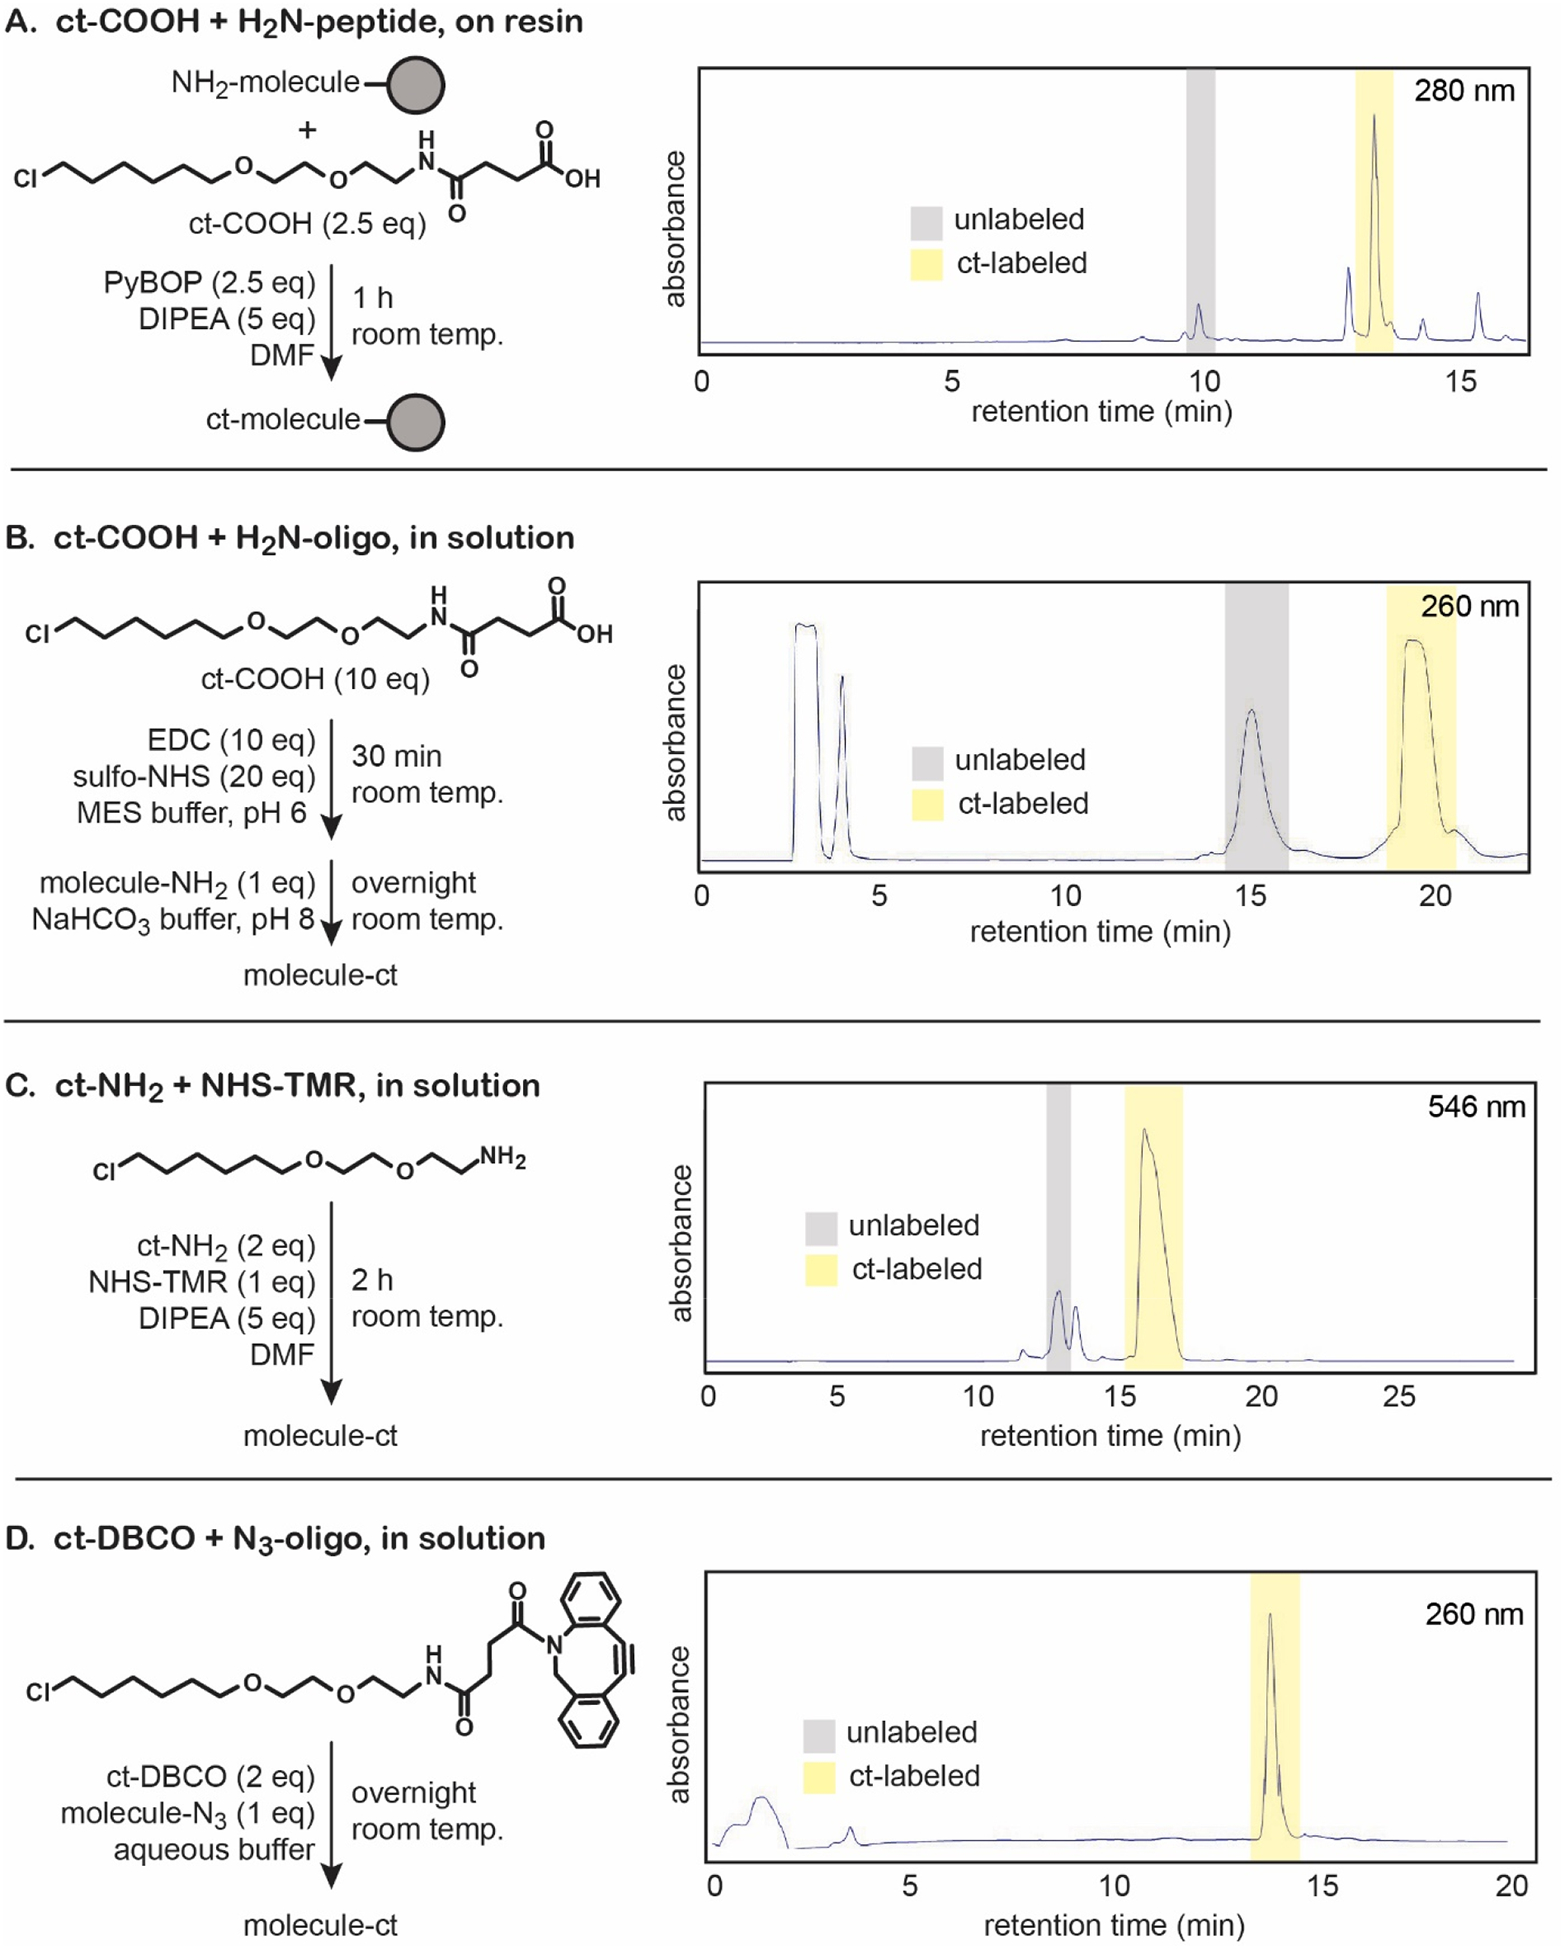
Labeling molecules of interest with the chloroalkane tag was performed according to the reaction conditions above, for (A) on-resin ct-COOH conjugation to synthesize ct-W, (B) in-solution ct-COOH conjugation to synthesize an 18-mer ct-oligo, (C) in-solution ct-NH2 conjugation to synthesize ct-TMR, and (D) in-solution ct-DBCO conjugation. Crude reverse-phase HPLC traces demonstrate the relative labeling efficiencies of each reaction.
The same reaction can be carried out on an orthogonally deprotected lysine anywhere throughout the peptide. Lysine-Mtt or lysine-Mmt was incorporated into a peptide on resin. The Mtt or Mmt protecting group was removed with 3 × 5 min incubations with 1% TFA in DCM, resulting in a free amine for the orthogonally deprotected lysine. Chloroalkane-carboxylic acid was coupled as described above, and the peptide was cleaved from solid support as described above. Chloroalkane groups are non-reactive with thiols and other nucleophiles used in routine peptide deprotection cocktails. However, we recommend coupling the chloroalkane tag as the final synthetic step, as we have seen some degree of elimination of the chloroalkane tag when incubated with 20% piperidine and other bases used for deprotection in Fmoc-based solid phase synthesis.
3.3.2. EDC/NHS coupling
Chloroalkane-carboxylic acid (ct-COOH, 10 eq) was dissolved in approximately 50 μL MES buffer (pH 6.0) with 10 eq EDC and 20 eq sulfo-NHS and incubated at room temperature for 30 min. Next, 200 nmol of a single-stranded, 5′ amine-tagged 18-mer oligonucleotide was added and the mixture was incubated overnight at room temperature (Fig 3B). Crude product was purified on a C18 column using a gradient of 5–100% B over 20 min, with solvent A as aqueous 100 mM triethylammonium acetate (TEAAc) with 5% acetonitrile, and solvent B as 100 mM TEAAc with 30% acetonitrile. After purification, the final yield of ct-oligonucleotide is typically between 30–50%.
3.3.3. Synthesis of chloroalkane-tetramethylrhodamine (ct-TMR)
Dry 5/6-TAMRA-succinimidyl ester (Anaspec, 100 μmol) was dissolved in 2 mL DMF (DMF was dried over molecular sieves). 5 eq of diisopropylethylamine was added, followed by 2 eq of chloroalkane-amine compound 3 (see section 3.2 above). The reaction mixture was incubated at room temperature overnight with shaking, then diluted with 3 mL water (Fig 3C). The crude mixture was purified by reverse-phase HPLC using a preparatory C18 column with a gradient of 5–100% solvent B over 20 min. Solvent A was water with 0.1% trifluoroacetic acid, and solvent B was acetonitrile with 0.1% trifluoroacetic acid.
3.3.4. Synthesis of a chloroalkane-strained cyclooctyne, and copper-free cycloaddition reaction
In order to make a chloroalkane tag suitable for an azide-alkyne Huisgen cycloadditon reaction (“click” reaction), we chose to synthesize a chloroalkane-dibenzocyclooctyne (ct-DBCO). Dibenzocyclooctyne-N-hydroxysuccinimidyl ester (125 μmol) and 2 eq of compound 3 were dissolved in 2 mL dry DMF with 10 eq of diisopropylethylamine (Fig 2). The reaction mixture was stirred at room temperature overnight with shaking, then purified by reverse-phase HPLC using a preparatory C18 column with a gradient of water and acetonitrile in 0.1% trifluoroacetic acid. The yield for this step was roughly 63%.
For the “click” conjugation reaction, a single-stranded, 5′ azide-tagged 18-mer oligonucleotide (200 nmol) was added to 3 eq ct-DBCO in 100 μL of 100 mM TEAAc buffer in 70:30 water:acetonitrile. The solution was incubated at room temperature overnight with shaking (Fig 3D). Crude product was purified by reverse-phase HPLC using a C18 column with a gradient of of 5–100% B over 20 min, with solvent A as aqueous 100 mM TEAAc with 5% acetonitrile, and solvent B as 100 mM TEAAc with 30% acetonitrile. We have obtained a nearly 100% labeling efficiency for this reaction.
3.4. Suppliers of materials
This section lists key materials we have used in the synthesis of ct-molecules and for the cell culture protocols that we routinely use in CAPA.
3.4.1. Synthesis materials
| Reagent | Supplier |
|---|---|
| 2-(2-aminoethoxy)-ethanol | Sigma (A54059-100G) |
| di-tertbutyl-dicarbonate | Sigma (361941-25G) |
| 1-chloro-6-iodohexane | TCI chemicals (34683-73-3) |
| sodium hydride, 60% dispersion in mineral oil | Sigma (452912-100G) |
| diisopropylethylamine | Sigma (D125806-500ML) |
| succinic anhydride | Sigma (239690-50G) |
| PyBOP | ChemPep (121601) |
| lysine-mtt or lysine-mmt | ChemPep (101212) |
| EDC: 1-ethyl-3-(3-dimethylaminopropyl)carbodiimide-HCl | Thermo Fisher Scientific (22980) |
| sNHS: sulfo-N-hydroxysuccinimide | Alfa Aesar (H52795-03) |
| 5/6-TAMRA-succinimidyl ester | Anaspec (AS-81124) |
| dibenzocyclooctyne-N-hydroxysuccinimidylester | Sigma (762040) |
3.4.2. Cell culture materials
| Reagent | Supplier |
|---|---|
| DMEM, high glucose | Gibco, Fisher Scientific (11-965-092) |
| optiMEM | Gibco, Thermo Fisher Scientific (11058021) |
| fetal bovine serum | Neuromics (FBS001) |
| penicillin/streptomycin (10,000 units/mL) | Gibco, Fisher Scientific (15-140-122) |
| puromycin | Gibco, Thermo Fisher Scientific (A1113803) |
| trypsin (+phenol-red) | Gibco, Thermo Fisher Scientific (25300062) |
| trypsin (no phenol-red) | Gibco, Thermo Fisher Scientific (15400054) |
4. PROTOCOL
4.1. Designing the experiment
4.1.1. “No-molecule” and “no-dye” controls
Before performing CAPA, one must consider several important features of experimental design. First, inclusion of proper controls is critical to ensure reproducible and accurate data analysis. In each plate, we include “no-molecule” and “no-dye” control wells to represent the maximum and minimum signals for those cells, in that format, on that specific day. The “no-molecule” controls are wells that receive only dilution buffer, instead of diluted ct-molecule, during the pulse step. Since the ct-dye is cell-permeable and added in vast excess, the no-molecule control represents the maximum red fluorescence for those cells during that experiment (comparable to a ct-molecule with no appreciable cytosolic localization). The “no-dye” controls are separate wells that receive only media, instead of ct-dye, during the chase step. The no-dye control thus represents the minimum red fluorescence, attributed to background fluorescence of the cells and any ct-dye not removed during wash steps. The red fluorescence values for the no-molecule and no-dye controls are used to normalize the red fluorescence of each other sample analyzed in the same 96-well plate. These controls also allow us to account for experimental variation such as stock-to-stock variations in ct-dye intensity or day-to-day changes in HaloTag expression.
If many samples are tested in a single plate, if high cell counts are desired, and/or if there are fewer cells per well, the time required for performing flow cytometry on an entire 96-well plate may lead to lower cell counts and increased clumping in later samples. Because of this possibility, we suggest placing one set of no-molecule and no-dye controls at the beginning of the plate and one set of controls at the end of the plate. Comparing the results from these independent controls ensures the consistency of raw fluorescence values across the entire plate.
4.1.2. Small molecule control
In addition to no-molecule and no-dye controls, we also use a small molecule control in each experiment to ensure the assay is working properly. Any cell-penetrant ct-small molecule whose concentration can be accurately measured is an acceptable positive control. We routinely use chloroalkane-tryptophan (ct-W) as our small molecule control because of its synthetic simplicity and strong absorption at 280 nm for accurate quantitation. By including a complete dose-dependence experiment for ct-W on every plate, we verify the assay is working properly and we ensure data can be directly compared among independent trials. This control also provides reliable saturation values for curve fitting. Since the low-fluorescence (high cytosolic localization) saturation value can change slightly depending on the expression level of HaloTag and the exact durations of the various incubation and wash steps, we use the low-fluorescence saturation value of the ct-W curve as the minimum value for curve fitting for all other ct-molecules in the plate. Curve fitting and data analysis are discussed in more detail in section 5.
4.1.3. ct-molecule dilution and toxicity
Medium composition and additives, particularly dimethylsulfoxide (DMSO), have been shown to alter membrane permeability (de Menorva, Mir, Ferná Ndez, & Reigada, 2012; H. Wang, Zhong, Wu, Huang, & Liu, 2009). Thus, one must ensure that the final percentage of DMSO, salts, or other additives in the ct-molecule stock is kept constant across serial dilutions. For example, we typically store ct-peptides in 100% DMSO as concentrated stocks. We then prepare serial dilutions with a maximum DMSO concentration of 2%, so after 1:5 dilution into the 96-well plate (see section 4.2 for stepwise protocol), the final concentration of DMSO is no higher than 0.4%. Balancing solubility and the concentration of DMSO or other additives is common for cell-based assays, but we have found that good starting points for the highest concentration to be tested are typically 2 μM, 5 μM, and 20 μM, respectively, for small molecules, polycationic cell-penetrating peptides, and other peptides with an unknown penetration ability. DMSO stocks of ct-molecules to be tested should have these target concentrations in mind.
As in any cell-based assay, it is also important to monitor for potential toxicity of a ct-molecule. After the pulse step, the morphology and viability of the cells should be observed by microscopy. Typical signs of toxicity are an abnormal amount of un-adhered cells and/or changes in morphology of adhered cells such as rounding up or blebbing. Toxicity is also quantitated during gating (see section 5.1 below). If any sign of toxicity is observed, especially at higher concentrations of ct-molecule, data from that concentration of ct-molecule should be removed from analysis.
4.1.4. Experimental conditions
One advantage of CAPA is the ability to adjust the experimental conditions of the ct-molecule incubation (“pulse”) step. We typically pulse with ct-molecule for 4 h at 37 °C as a standard for comparison, but the incubation time, temperature, and the presence of serum can be changed with no other complications or alterations to the protocol. This allows one to obtain a more robust dataset, and to ensure CAPA data are comparable to the conditions under which the molecule is known to induce a phenotype change in cell culture. For instance, we have demonstrated that analyzing 96-well plates in parallel, with pulse times of 0.5 h, 2 h, 4 h, 8 h, and 24 h, allows one to produce a time course of cytosolic localization (Peraro et al., 2018). These data provide valuable information as to the time it takes for a large proportion of the exogenously added molecule to reach the cytosol, which has implications for designing appropriate phenotype-based assays, as well as for understanding mechanism of uptake. Conducting the ct-molecule pulse step at 4 °C instead of at 37 °C may also offer insight into the temperature dependence of cytosolic localization, implying whether the ct-molecule has an energy-dependent mechanism of uptake (Augustijns et al., 2000; Fretz et al., 2007; Futaki et al., 2001; Shin et al., 2018). One can also directly measure the effect of serum on cytosolic localization using CAPA. The data obtained from pulsing ct-molecules in the presence of serum may be more representative of cytosolic localization in vivo, and some molecules are more sensitive to the presence of serum than others. For instance, the total cellular uptake and cytosolic localization of some stapled peptides are reduced in the presence of serum, and this property required development work to overcome for a p53-derived stapled helix that is now in human clinical trials (Bird et al., 2016; Chang et al., 2013; Peraro et al., 2018). Overall, CAPA offers a great deal of flexibility for assay conditions, which allows one to directly address these and other common obstacles to drug development.
4.1.5. Flow cytometer requirements
Regardless of the conditions used for the pulse and chase steps, the red fluorescence of each sample is the direct signal that is measured. While other readouts are possible, we currently use a capillary-based flow cytometer that measures side scatter, green fluorescence, and red fluorescence (specifically, a Guava EasyCyte 6HT with InCyte software for data collection and analysis). Laser gains must be empirically adjusted to provide adequate separation between the background and maximum red fluorescence (as measured directly using no-dye and no-molecule controls, see section 4.1.1). After gating and gain optimization, we typically see a separation between the means of the histograms for red fluorescence of the no-dye and no-molecule controls of at least one order of magnitude (see section 5.1 below).
4.2. Stepwise protocol
Seed cells in a tissue culture treated 96-well plate at a density of 3.5 × 10⁴ cells per well in cell culture media. Incubate overnight at 37 °C with 5% CO2. Cells should be between 60–80% confluent at the start of the experiment.
Aspirate culture media from cells and carefully add 100 μL optiMEM to each well.
Prepare serial dilutions of ct-molecules in a separate 96-well plate.
Add 25 μL of ct-molecule dilutions to each well, and add 25 μL of dilution buffer to the no-molecule control wells. Gently rock plate to mix.
(Pulse step) Incubate cells with ct-molecule at 37 °C with 5% CO2 for 4 h.
Aspirate the media and wash cells by adding 80 μL fresh optiMEM. Incubate at room temperature for 15 min.
(Chase step) Aspirate the media and add 50 μL of 5 μM ct-TMR in optiMEM to each well. Add 50 μL optiMEM with no ct-TMR to the no-dye control wells. Incubate at room temperature for 15 min.
Aspirate the media and add 80 μL fresh optiMEM. Incubate at room temperature for up to 30 min to ensure washout of excess dye.
Aspirate the media and add 40 μL of phenol red-free trypsin (0.05%). Incubate at 37 °C for 3–6 min.
Aspirate the trypsin solution and resuspend cells in 180 μL of PBS. Gently pipette up and down to lift cells from the bottom of the plate and separate clumps in solution.
Measure the red fluorescence of cells by benchtop flow cytometry.
5. DATA ANALYSIS
5.1. Gating and normalization
To ensure that we only incorporate data from live cells that express HaloTag, we gate cells for viability and expression of HaloTag-GFP during data collection. Specifically, on a plot of side scatter versus green fluorescence, we set the gain of the green fluorescence detection channel to remove cells that express little or no HaloTag-GFP fusion; this also effectively removes cell debris (Fig 5A). With the HGM cell line (Ballister et al., 2014), we find this typically removes between 30 and 50% of the detection events, depending on vigorousness of washing, the cell passage number, and the amount of time since the last selection. After gating out low-expressing cells, we find that the distribution of HaloTag-GFP expression levels is typically quite narrow (Fig. 5B). If more than 60% of detection events are gated out in this manner, it may suggest that the data should be discarded because the cells are expressing an unusually low amount of HaloTag-GFP, or, more likely, because the ct-molecule is toxic at the concentration applied.
Figure 5. Flow data collection and analysis.
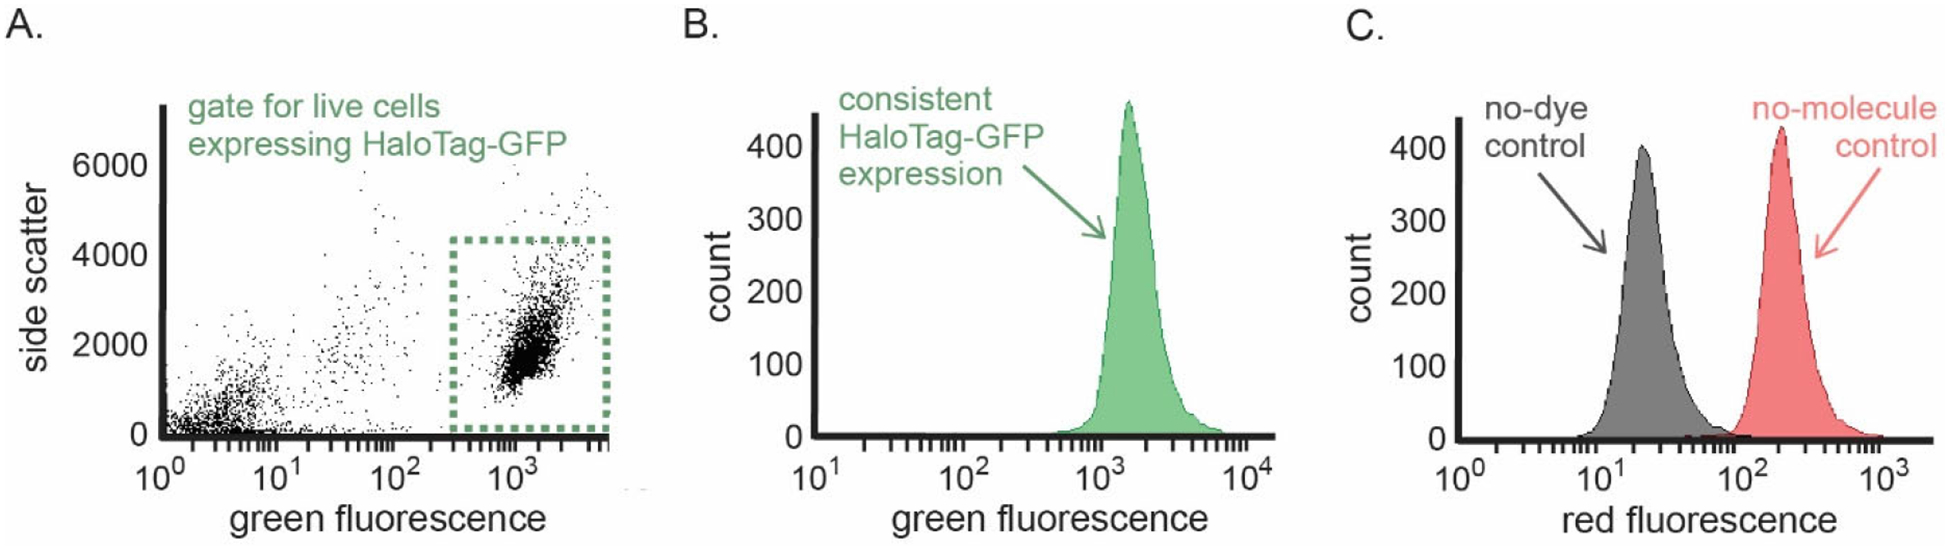
(A) A typical distribution of flow cytometer detection events and example gating parameters to include only live cells that express HaloTag-GFP. Cells expressing HaloTag-GFP that were included in the analysis are in the green rectangular gate. (B) Histogram of 5,000 cells showing a representative distribution of HaloTag-GFP expression in a single sample of cells. (C) Histograms of 5,000 cells showing a representative distribution of the no-dye control (black) and the no-molecule control (red). There should be minimal overlap and at least an order of magnitude of separation between these two controls.
As described in section 4.1.1, we routinely include no-dye and no-molecule controls in each 96-well plate. For each test sample, the mean red fluorescence of 5,000 cells is normalized to the values obtained for the no-dye control and the no-molecule control (the background and maximum red fluorescence, respectively; Fig 5C). We have used both the mean and median to represent individual data points and have not seen much difference, both for raw values and normalized values. The normalized value for red fluorescence of each sample is calculated as follows:
5.2. Curve fitting
To plot the dose dependence of CAPA signal, each of the normalized values is plotted as a single point on a plot of red fluorescence versus concentration of ct-molecule. We use a Hill equation curve fit (IC50 curve) (Gadagkar & Call, 2015; Hill, 1910), with the midpoint value and the slope each allowed to vary to produce the optimal fit. The midpoint value is referred to as the “CP50”, since it is the value at which 50% cytosolic penetration is observed in this cell line under the given conditions. The curve fitting equation we use for deriving CP50 values is the following:
min: minimum of ct-W curve
m1: CP50 value
m2: slope of curve fit
[c]: concentration of ct-molecule
For curve fits, 100% is used as the maximum value, which via normalization (section 5.1) derives from the empirically measured no-molecule control. However, we do not use 0%, which via normalization derives from the empirically measured no-dye control, as the minimum value. Instead, we use the empirically measured saturation value observed for high concentrations of a small-molecule control such as ct-W as the saturation value for low fluorescence (high cytosolic penetration). This value is typically in the range of near-zero to 15%, with some day-to-day variation. Because HaloTag is expressed from a constitutive promoter, this observation is consistent with additional HaloTag being expressed during the dye incubation and wash steps (steps 6–8 in section 4.2). Based on the robustness and reproducibility of our CP50 values derived to date, we recommend using a positive control such as ct-W to empirically derive the appropriate value to use as the high-concentration saturation value for dose-dependence curve fits. Because a small molecule control can be routinely tested in the same plate as ct-molecules of interest (section 4.1.2), this standard provides high consistency and reproducibility in calculated CP50 values.
5.3. Error and reproducibility
Relatively uniform HaloTag-GFP expression levels are observed in the stable cell line, which contributes to high reproducibility of the assay (Fig 5A,B). In extensive optimization, we have found that normalized mean fluorescence values do not change significantly between measurements of 2,000 and 10,000 cells per sample, so we typically count 5,000 cells per well to balance robustness with expedience. Because we count 5,000 cells per well, we have found it superfluous to include technical replicates in separate wells on a single plate. However, conducting three independent biological replicates on different days allows for a relevant estimation of experimental error. We recommend showing CAPA data as normalized mean fluorescence values for each individual concentration, using error bars that represent standard error of the mean for that concentration from at least three biological replicates. However, CP50 values should not be derived from these composite data. Rather, independent CP50 curves should be fit for each biological replicate, and the mean of these three (or more) CP50 values should be reported as the CP50 value for a specific ct-molecule. The standard error of the mean of these three independent CP50 values should be given as a measure of error. This error analysis provides an accurate estimation of what one could expect an independent experiment to show for a given ct-molecule tested in CAPA under the specified conditions.
6. TROUBLESHOOTING
CAPA works robustly and requires no special techniques beyond typical cell culture and flow cytometry methods. However, there are some potential problems to be aware of in performing the experiment and interpreting the results. Table 1 presents some potential pitfalls and their likely causes, as well as recommended solutions to address them.
Table 1.
CAPA troubleshooting.
| Problem | Cause | Solution |
|---|---|---|
| Chloroalkane coupling byproduct | Internal cyclization or side-reaction occurring. We have observed this with some coupling reagents. | Use PyBOP, and avoid HATU or HBTU, when coupling on-resin |
| Gating removes more than 60% of cells | Cells do not express enough HaloTag-GFP | Select cells with 20 μg/mL puromycin |
| Cells are lost during aspiration | Aspirating technique is not optimal, or vacuum is too strong | Add a non-filtered pipette tip to the end of the aspirating pipette to reduce surface area of the vacuum; reduce strength of the vacuum pump |
| Cells do not lift up from bottom of the plate during trypsinization | Low level of protein in the optiMEM inhibits trypsin | Wash with PBS between the final optiMEM wash and trypsinization |
| Low cell counts | Toxic molecules or handling issues | Use a lower concentration of ct-molecule; handle cells cautiously |
| Samples measured later in the plate have lower cell counts or more inconsistent results | Cells sitting for too long, not as healthy as those earlier inthe plate | Split up samples into two plates with staggered incubation and read times; alternatively, lower cell counts for each well or increase capillary flow rate to decrease data collection time |
| Histogram shows a double peak | Cells are clumping | Mix cells more extensively during PBS resuspension; gate for single cells |
| Curves for the minimum and maximum control samples are overlapping | Background fluorescence is too high and/or maximum fluorescence is not high enough | Adjust gain of red fluorescence detection; lengthen the final wash step; change to a brighter ct-dye |
7. APPLICATIONS AND LIMITATIONS
7.1. Experimental applications
CAPA has proven useful for measuring the cytosolic localization of ct-molecules in a direct, relatively quantitative, and high throughput manner. CAPA reports exclusively on the cytosolic access of these molecules instead of total cellular uptake. CAPA can also be configured to report on penetration to cellular compartments other than the cytosol. For example, using a stable cell line with HaloTag fused to histone 3 (Ballister et al., 2014), we have demonstrated that the identical methodology can be used to measure penetration to the nucleus (Peraro et al., 2018). Cell lines with HaloTag expressed in other organelles or compartments would enable the measurement of penetration of ct-molecules to those subcellular locations (Ballister et al., 2014; Murrey et al., 2015; Tomat, Nolan, Jaworski, & Lippard, 2008; J. Wang et al., 2015; Zhu, Fan, Du, & Peng, 2016). Further, CAPA can provide insight into the mechanism of uptake of these ct-molecules. For example, conducting the ct-molecule incubation at various times and temperatures can help distinguish passive uptake and active uptake (Peraro et al., 2018). CAPA could also be conducted in the presence of endocytosis inhibitors to analyze the mechanism of endosomal uptake. We expect these experiments would provide useful data, but not conclusive evidence of uptake mechanism due to the fact that membrane fluidity and the energetics of molecule hydration are also affected by temperature (Augustijns et al., 2000; Shin et al., 2018), and the fact that compensatory pathways can still allow endocytosis even when a preferred pathway is blocked (Madani, Lindberg, Langel, Futaki, & Gräslund, 2011).
CAPA offers the capability to measure cytosolic localization for many classes of molecules for which existing assays have limitations. These include polar small molecules, druglike macrocycles, stapled peptides, miniproteins, splice-switching ASOs, knockdown ASOs, siRNAs, mRNAs, supercharged and other intrinsically penetrant proteins, and large biomolecules (proteins, mRNA, and others) delivered using lipid nanoparticles and liposomes. We and others are currently applying CAPA successfully to these and other classes of molecules. We also have ongoing efforts to screen many molecules in parallel in an arrayed format. This format allows for large-scale analysis of the characteristics that enhance cytosolic localization for a moderately-sized library of hundreds to thousands of molecules, or more if interfaced with a fully automated high-throughput screening platform.
7.2. Caveats associated with the chloroalkane tag
CAPA is versatile and can be adapted for many applications, but the assay does have certain limitations. The most apparent limitation is the fact that CAPA is a tag-based assay, and therefore requires covalent attachment of the chloroalkane tag to the molecule of interest. The chloroalkane may alter the physical properties of the molecule, including hydrophobicity, stability, and solubility. After applying CAPA to over 75 biomolecules, we have observed that the addition of the chloroalkane tag shifts the retention time on reverse-phase HPLC (see, for example, Fig. 3A–C), suggesting that the tag adds a certain degree of hydrophobicity. However, we have never observed insolubility as a result of chloroalkane attachment, even for stapled peptides which are already quite hydrophobic.
Another concern related to attaching the chloroalkane tag is the possibility that the tag could alter the endocytic uptake, endosomal escape, and/or subcellular localization of the molecule of interest. Because the chloroalkane tag is long and fairly lipid-like, ct-molecules may be more cell-penetrant than untagged molecules. If this potential discrepancy is of particular concern for a given molecule, it may be worthwhile to test ct-molecule and untagged molecule side-by-side in an independent assay that measures bioactivity or another relevant cellular readout. These data represent a direct measurement of the impact of the chloroalkane tag on bioactivity, which presumably could be increased if the chloroalkane tag improves cytosolic localization. We applied these controls to an autophagy-inducing stapled peptide, DD5o, in our initial report describing CAPA in 2017 (Peraro et al., 2018, 2017). Specifically, we performed alanine scans on DD5o and ct-DD5o, measured the autophagy-inducing activity of each analog, and derived the CP50 of each ct-analog using CAPA. With a handful of analogs, we saw higher bioactivity for ct-DD5o compared to DD5o. For instance, ct-DD5o was roughly 9-fold more potent than DD5o in autophagy induction (Peraro et al., 2018). Additionally, we observed that ct-DD5o with a valine substituted with 2-amino-3-ethylpentanoic acid (ct-V1Aep) had approximately 3-fold more potent autophagy-inducing activity than its untagged counterpart (Peraro et al., 2018). These data suggest that, for these analogs but not for others, the chloroalkane tag promoted a higher degree of cytosolic localization. In these examples, the chloroalkane tag appears to have enhanced the cytosolic localization for some of the alanine-scanning analogs, but not for others. Still, CAPA still allowed for a systematic investigation that revealed which residues were important for cytosolic localization (Peraro et al., 2018).
We have also studied the impact of the size of the chloroalkane tag and its location within the molecule, using a panel of ct-peptides as a representative group. First, we compared CAPA curves of a panel of peptides conjugated to the standard 18-atom chloroalkane tag (described in section 3) or a series of four longer tags which ranged from 24 to 32 atoms long (Peraro et al., 2018). Most peptides were unaffected by the length of the tag, but a small number of peptides had altered CP50 values when tested with different tags (Peraro et al., 2018). Second, we used stapled peptide ct-DD5o to test the impact of the location of the tag. Whether the chloroalkane tag was conjugated to the N-terminus or to a lysine at the C-terminus, the dose-dependent CAPA data were very similar (Peraro et al., 2018). Overall, we conclude that CAPA is often insensitive to length and location of the chloroalkane tag, but not always. Thus, if possible, we suggest testing the effect of length and location of the chloroalkane tag on each new molecule of interest. To complement the CAPA data, cell-based activity assays on ct-molecules are also helpful for assessing the effect of the chloroalkane tag on biological activity.
A final concern related to the chloroalkane tag is the possibility of degradation of the molecule of interest, which could release the chloroalkane tag and thus produce a false-positive signal. This is particularly concerning if the CAPA dose dependence for a given ct-molecule looks similar to the small molecule positive control, with a CP50 near 10 to 50 nM. So far, we have seen little evidence for interference from degradation, especially at 4-hour incubation times without serum. The chloroalkane tag and linker do not degrade appreciably during cellular experiments – this was examined in earlier experiments with the HaloTag system, and confirmed for CAPA using a ct-biotin control (Los et al., 2008; Peraro et al., 2018). In addition, the CP50 values obtained for linear and stapled peptides have generally aligned with concentrations at which cellular activity is observed (Peraro et al., 2018, 2017). Further, with biomolecules most prone to degradation – such as linear peptides composed exclusively of natural amino acids, and 18-mer oligonucleotides with zero or minimal chemical modifications – we have observed relatively high CP50 values, rather than low CP50 values consistent with degradation. Still, the possibility of CAPA signal from degraded molecule should always be kept in mind. This possibility can be minimized by (1) using shorter incubation times to reduce degradation, (2) checking for molecule stability in serum-containing media and cell lysates, and (3) ensuring chemical modification is sufficient to protect the molecule from degradation. Especially if an individual curve overlaps with the small molecule control, it is important to conduct these or other controls before interpreting the data as indicating that the molecule has high cytosolic localization.
Collectively, these issues are shared by most assays that require a tag for signal readout, including, but not limited to, most fluorescence-based assays (Appelbaum et al., 2012; Birch et al., 2017; Fischer et al., 2004; Hedegaard et al., 2018), some reporter-based assays (Holub et al., 2013; Kang et al., 1998; Yu et al., 2005), and peptide tag assays (Kato & Jones, 2010; Milech et al., 2015; Verdurmen, Luginbühl, Honegger, & Plückthun, 2015b). While CAPA has the limitation of relying on a chemical tag, we have found that the chloroalkane tag is generally less perturbing than a larger, aromatic moiety such as a fluorescent dye.
7.3. Interpretations of CAPA signal and quantitation of absolute cytosolic localization
CAPA offers precise relative quantitation of cytosolic localization, but it does not directly provide absolute quantitation of the number of molecules that have accessed the cytosol. This is because CAPA signal corresponds to the percentage of free HaloTag in the cytosol, not necessarily the absolute amount of ct-molecule in the cytosol. Thus, the CP50 represents the concentration at which HaloTag is 50% blocked, not the concentration at which 50% of the exogenously applied ct-molecule can access the cytosol.
Using several assumptions, one could use CAPA data to obtain an approximate value for the cytosolic concentration of a given ct-molecule. Consider “ct-X” as an example of the most penetrant small molecule tested to date, and let us assume for ct-X that cytosolic localization is not a limiting factor. If this is true, then all the ct-X added to each well is fully able to access the cytosol. With this assumption, the effective intracellular concentration of ct-X at its CP50 concentration is given by:
The most cell-penetrant molecule we have observed to date has a CP50 of 10 nM after a four-hour incubation. Accounting for the 125 μL volume of media in the well, 50,000 cells per well, and an average volume of a HeLa cell of 2.5 × 10⁻⁶ μL (Zhao et al., 2008), this gives an effective intracellular concentration of 10 μM when ct-X it is applied at 10 nM. At the CP50 concentration, 50% of HaloTag has reacted with ct-X, so this provides an estimate for the effective concentration of HaloTag in the cytosol: twice 10 μM, or 20 μM.
The above values allow us to calculate efficiency of cytosolic localization (the proportion of exogenously applied molecule that accessed the cytosol) for a given ct-molecule, as well as the effective cytosolic concentration of the ct-molecule. With the assumption that the ct-X positive control is 100% efficient in reaching the cytosol, the cytosolic localization efficiency of any given ct-molecule is equal to the ratio of the CP50 of ct-X to the CP50 of the ct-molecule:
For example, using a CP50 of 10 nM for ct-X, a ct-molecule with a CP50 of 1 μM would have a cytosolic localization efficiency of 1%. Finally, to estimate the effective cytosolic concentration of a ct-molecule applied at a specific concentration, one can use the following calculation:
To continue the same example, when added at 5 μM, the ct-molecule described above would achieve an intracellular concentration of 50 μM.
The above calculations depend critically on ct-X as a molecule with 100% efficient cytosolic localization. While the most cell-penetrant ct-molecule we have tested to date has a CP50 of 10 nM after four hours of incubation, it is important to note that this value depends on the time of incubation, the volume of medium added to the cells, and the cell culture conditions. If any of these parameters are changed, a new control experiment should be done with an optimally penetrant ct-molecule. Further, as applications of CAPA grow, it is possible that even more cell-penetrant molecules may be tested, which would replace the CP50 value for ct-X with a lower value. Finally, the above calculations require many assumptions, the most uncertain of which is the assumption that the most-penetrant molecule tested to date is 100% efficient at reaching the cytosol. Thus, we caution that these calculations can be useful, but only as a rough estimation of the cytosolic localization efficiency and cytosolic concentration of a ct-molecule.
7.4. Cell lines and HaloTag expression
An additional limitation of CAPA is the dependence on a stably transfected cell line. In our experience, transiently transfected cell lines can be used for CAPA, but with greatly reduced precision and reproducibility. Thus, we anticipate that CAPA will require a new stable cell line to be produced for each cell type and each subcellular compartment one wishes to investigate. While we use CAPA on adhered cells, CAPA could also be adapted to suspension cells. To explore this possibility, we have performed the washing and resuspension steps on HGM cells that were trypsinized just after the pulse step. The results were similar between samples that remained adhered until the final step, and cells that were washed and chased with dye in suspension. Further, the limit of detection of the assay depends upon the level of expression of HaloTag. CP50 values may therefore change between cell lines, not just because the cells have different intrinsic properties such as endocytosis rates, but also due to different expression levels of HaloTag. The ability to modulate HaloTag expression level in one or more stable cell lines could mitigate this limitation, allowing for more sensitive quantitation of smaller amounts of ct-molecule accessing the cytosol. Robust, penetrant, and uniform introduction of HaloTag fusion constructs into primary cells would also permit CAPA to be performed in a wide variety of disease-relevant cell types.
7.5. The future of CAPA
The simplicity, low cost, and high throughput of CAPA make it ideally suited for a wide range of applications which depend on measuring subcellular delivery of exogenously applied molecules. Industry and academic groups are adopting CAPA as a routine assay for drug development and for optimization of chemical biology probes. We envision the ability to routinely optimize druglike molecules for target access (localization to the cytosol, nucleus or other cellular compartment) in parallel with optimization of target affinity and biological activity. CAPA could also be multiplexed, perhaps using orthogonal systems such as SNAP-Tag (Keppler et al., 2003), to measure localization to multiple compartments or to measure subcellular localization of competing molecules added simultaneously. Finally, we foresee CAPA being adapted to animals in order to gain more accurate information about the fate of a candidate therapeutic in vivo. Performing a CAPA-like assay in a HaloTag-expressing animal would produce pharmacokinetics data that does not just report on tissue accumulation, but rather cytosolic accumulation within a target tissue. The ability to quantitatively measure the extent of intracellular delivery and subcellular localization in animal models would be a valuable tool for the development of biomolecule therapeutics.
Figure 4. CAPA workflow schematic.
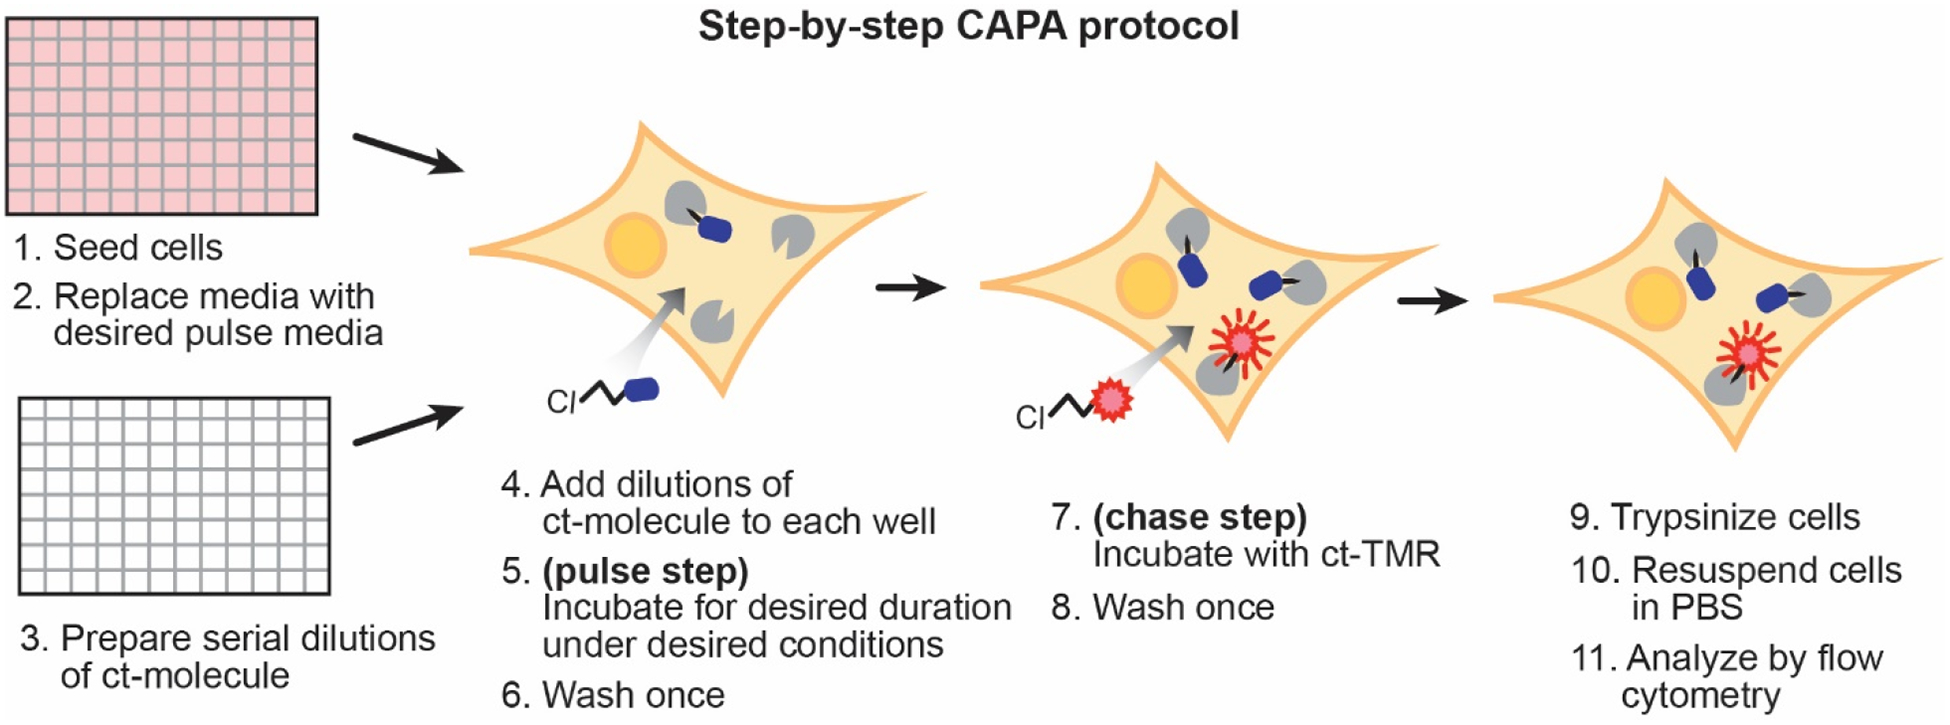
Cells are seeded in a 96-well plate the night before the experiment. Just prior to the start of the experiment, the media is replaced with optiMEM. Dilutions of ct-molecule are prepared in a separate 96-well plate and added to the optiMEM. The ct-molecules are incubated under the desired conditions and for the desired time interval (pulse step). Cells are washed and then incubated with ct-TMR (chase step). Cells are then washed, trypsinized, and resuspended in PBS. Red fluorescence of the cells in each sample is measured by flow cytometry. For more information about each step, see the corresponding number of the stepwise protocol (section 4.2).
8. REFERENCES
- Appelbaum JS, Larochelle JR, Smith BA, Balkin DM, Holub JM, & Schepartz A (2012). Arginine Topology Controls Escape of Minimally Cationic Proteins from Early Endosomes to the Cytoplasm. Chemistry & Biology, 19, 819–830. 10.1016/j.chembiol.2012.05.022 [DOI] [PMC free article] [PubMed] [Google Scholar]
- Aubry S, Aussedat B, Delaroche D, Jiao CY, Bolbach G, Lavielle S, … Burlina F (2010). MALDI-TOF mass spectrometry: A powerful tool to study the internalization of cell-penetrating peptides. Biochimica et Biophysica Acta - Biomembranes, 1798(12), 2182–2189. 10.1016/j.bbamem.2009.11.011 [DOI] [PubMed] [Google Scholar]
- Augustijns PF, Brown SC, Willard DH, Consler TG, Annaert PP, Hendren RW, & Bradshaw TP (2000). Hydration Changes Implicated in the Remarkable Temperature-Dependent Membrane Permeation of Cyclosporin A. Biochemistry, 39, 7621–7630. 10.1021/bi9929709 [DOI] [PubMed] [Google Scholar]
- Ballister ER, Aonbangkhen C, Mayo AM, Lampson MA, & Chenoweth DM (2014). Localized light-induced protein dimerization in living cells using a photocaged dimerizer. Nature Communications, 5, 5475 10.1038/ncomms6475 [DOI] [PMC free article] [PubMed] [Google Scholar]
- Birch D, Christensen MV, Staerk D, Franzyk H, & Nielsen HM (2017). Fluorophore labeling of a cell-penetrating peptide induces differential effects on its cellular distribution and affects cell viability. Biochimica et Biophysica Acta - Biomembranes, 1859(12), 2483–2494. 10.1016/j.bbamem.2017.09.015 [DOI] [PubMed] [Google Scholar]
- Bird GH, Mazzola E, Opoku-Nsiah K, Lammert MA, Godes M, Neuberg DS, & Walensky LD (2016). Biophysical determinants for cellular uptake of hydrocarbon-stapled peptide helices. Nature Chemical Biology, 12(10), 845–852. 10.1038/nchembio.2153 [DOI] [PMC free article] [PubMed] [Google Scholar]
- Burlina F, Sagan S, Bolbach G, & Chassaing G (2005). Quantification of the cellular uptake of cell-penetrating peptides by MALDI-TOF mass spectrometry. Angewandte Chemie - International Edition, 44(27), 4244–4247. 10.1002/anie.200500477 [DOI] [PubMed] [Google Scholar]
- Burlina F, Sagan S, Bolbach G, & Chassaing G (2006). A direct approach to quantification of the cellular uptake of cell-penetrating peptides using MALDI-TOF mass spectrometry. Nature Protocols, 1(1), 200–205. 10.1038/10.1038/nprot.2006.30 [DOI] [PubMed] [Google Scholar]
- Cai B, Kim D, Akhand S, Sun Y, Cassell RJ, Alpsoy A, … Krusemark CJ (2019). Selection of DNA-Encoded Libraries to Protein Targets within and on Living Cells. Journal of the American Chemical Society, 141, 54 10.1021/jacs.9b08085 [DOI] [PMC free article] [PubMed] [Google Scholar]
- Chan WC, & White PD (2000). Fmoc Solid Phase Peptide Synthesis: A Practical Approach (Practical Approach Series). (Chan WC & White PD, Eds.). NY: Oxford University Press. [Google Scholar]
- Chang YS, Graves B, Guerlavais V, Tovar C, Packman K, To K-H, … Robert Grubbs by H. (2013). Stapled α−helical peptide drug development: A potent dual inhibitor of MDM2 and MDMX for p53-dependent cancer therapy. Proceedings of the National Academy of Sciences, E3445–E3454. 10.1073/pnas.1303002110 [DOI] [PMC free article] [PubMed] [Google Scholar]
- Chu Q, Moellering RE, Hilinski GJ, Kim Y-W, Grossmann TN, Yeh JT-H, & Verdine GL (2015). Towards understanding cell penetration by stapled peptides. Med. Chem. Commun, 6(1), 111–119. 10.1039/C4MD00131A [DOI] [Google Scholar]
- de Menorva M-A, Mir LM, Ferná Ndez ML, & Reigada R (2012). Effects of Dimethyl Sulfoxide in Cholesterol-Containing Lipid Membranes: A Comparative Study of Experiments In Silico and with Cells. PLoS ONE, 7(7), e41733 10.1371/journal.pone.0041733 [DOI] [PMC free article] [PubMed] [Google Scholar]
- Deprey K, Becker L, Kritzer J, & Plückthun A (2019). Trapped! A Critical Evaluation of Methods for Measuring Total Cellular Uptake versus Cytosolic Localization. Bioconjugate Chemistry, 30(4), 1006–1027. 10.1021/acs.bioconjchem.9b00112 [DOI] [PMC free article] [PubMed] [Google Scholar]
- Dougherty PG, Sahni A, & Pei D (2019). Understanding Cell Penetration of Cyclic Peptides. Chemical Reviews, 119, 10241–10287. 10.1021/acs.chemrev.9b00008 [DOI] [PMC free article] [PubMed] [Google Scholar]
- Dowdy SF (2017). Perspective Overcoming cellular barriers for RNA therapeutics. Nature Biotechnology, 35(3), 222–229. 10.1038/nbt.3802 [DOI] [PubMed] [Google Scholar]
- Encell LP, Friedman Ohana R, Zimmerman K, Otto P, Vidugiris G, Wood MG, … Wood KV (2012). Development of a Dehalogenase-Based Protein Fusion Tag Capable of Rapid, Selective and Covalent Attachment to Customizable Ligands. Current Chemical Genomics, 6, 55–71. Retrieved from https://www.ncbi.nlm.nih.gov/pmc/articles/PMC3520037/pdf/TOCHGENJ-6-55.pdf [DOI] [PMC free article] [PubMed] [Google Scholar]
- Fischer R, Köhler K, Fotin-Mleczek M, & Brock R (2004). A stepwise dissection of the intracellular fate of cationic cell-penetrating peptides. The Journal of Biological Chemistry, 279(13), 12625–12635. 10.1074/jbc.M311461200 [DOI] [PubMed] [Google Scholar]
- Foley CA, Potjewyd F, Lamb KN, James LI, & Frye SV (2019). Assessing the Cell Permeability of Bivalent Chemical Degraders Using the Chloroalkane Penetration Assay. ACS Chemical Biology. 10.1021/acschembio.9b00972 [DOI] [PMC free article] [PubMed] [Google Scholar]
- Fretz MM, Penning NA, Al-Taei S, Futaki S, Takeuchi T, Nakase I, … Jones AT (2007). Temperature-, concentration-and cholesterol-dependent translocation of L-and D-octa-arginine across the plasma and nuclear membrane of CD34 + leukaemia cells. Biochem. J, 403, 335–342. 10.1042/BJ20061808 [DOI] [PMC free article] [PubMed] [Google Scholar]
- Futaki S, Suzuki T, Ohashi W, Yagami T, Tanaka S, Ueda K, & Sugiura Y (2001). Arginine-rich peptides. An abundant source of membrane-permeable peptides having potential as carriers for intracellular protein delivery. The Journal of Biological Chemistry, 276(8), 5836–5840. 10.1074/jbc.M007540200 [DOI] [PubMed] [Google Scholar]
- Gadagkar SR, & Call GB (2015). Computational tools for fitting the Hill equation to dose-response curves. Journal of Pharmacological and Toxicological Methods, 71, 68–76. 10.1016/j.vascn.2014.08.006 [DOI] [PubMed] [Google Scholar]
- Hedegaard SF, Derbas MS, Lind TK, Kasimova MR, Christensen MV, Michaelsen MH, … Nielsen HM (2018). Fluorophore labeling of a cell-penetrating peptide significantly alters the mode and degree of biomembrane interaction. Scientific Reports, 8(1), 6327 10.1038/s41598-018-24154-z [DOI] [PMC free article] [PubMed] [Google Scholar]
- Hill AV (1910). The possible effects of the aggregation of the molecules of hemoglobin on its dissociation curves. The Journal of Physiology, 40, 4–7. [Google Scholar]
- Holub JM, Larochelle JR, Appelbaum JS, & Schepartz A (2013). Improved assays for determining the cytosolic access of peptides, proteins, and their mimetics. Biochemistry, 52(50), 9036–9046. 10.1021/bi401069g [DOI] [PMC free article] [PubMed] [Google Scholar]
- Jiao CY, Delaroche D, Burlina F, Alves ID, Chassaing G, & Sagan S (2009). Translocation and endocytosis for cell-penetrating peptide internalization. Journal of Biological Chemistry, 284(49), 33957–33965. 10.1074/jbc.M109.056309 [DOI] [PMC free article] [PubMed] [Google Scholar]
- Kang S-H, Cho M-J, & Kole R (1998). Up-Regulation of Luciferase Gene Expression with Antisense Oligonucleotides: Implications and Applications in Functional Assay Development. Biochemistry, 37, 6235–6239. Retrieved from https://pubs.acs.org/doi/pdf/10.1021/bi980300h [DOI] [PubMed] [Google Scholar]
- Kato N, & Jones J (2010). The Split Luciferase Complementation Assay In Plant Developmental Biology (pp. 359–376). Humana Press, Totowa, NJ: 10.1007/978-1-60761-765-5_24 [DOI] [PubMed] [Google Scholar]
- Kauffman WB, Fuselier T, He J, & Wimley WC (2015). Mechanism Matters: A Taxonomy of Cell Penetrating Peptides Trends in Biochemical Sciences. Elsevier Ltd. 10.1016/j.tibs.2015.10.004 [DOI] [PMC free article] [PubMed] [Google Scholar]
- Keppler A, Gendreizig S, Gronemeyer T, Pick H, Vogel H, & Johnsson K (2003). A general method for the covalent labeling of fusion proteins with small molecules in vivo. Nature Biotechnology, 21(1), 86–89. 10.1038/nbt765 [DOI] [PubMed] [Google Scholar]
- Kim J-S, Choi D-K, Park S-W, Shin S-M, Bae J, Kim D-M, … Kim Y-S (2015). Quantitative assessment of cellular uptake and cytosolic access of antibody in living cells by an enhanced split GFP complementation assay. Biochemical and Biophysical Research Communications, 467, 771–777. 10.1016/j.bbrc.2015.10.066 [DOI] [PubMed] [Google Scholar]
- Lamb KN, Bsteh D, Dishman SN, Moussa HF, Fan H, Stuckey JI, … Frye SV (2019). Discovery and Characterization of a Cellular Potent Positive Allosteric Modulator of the Polycomb Repressive Complex 1 Chromodomain, CBX7. Cell Chemical Biology, 26(10), 1365–1379.e22. 10.1016/j.chembiol.2019.07.013 [DOI] [PMC free article] [PubMed] [Google Scholar]
- Larochelle JR, Cobb GB, Steinauer A, Rhoades E, & Schepartz A (2015). Fluorescence correlation spectroscopy reveals highly efficient cytosolic delivery of certain penta-arg proteins and stapled peptides. Journal of the American Chemical Society, 137(7), 2536–2541. 10.1021/ja510391n [DOI] [PMC free article] [PubMed] [Google Scholar]
- Lau JL, & Dunn MK (2018). Therapeutic peptides: Historical perspectives, current development trends, and future directions. Bioorganic & Medicinal Chemistry, 26(10), 2700–2707. 10.1016/J.BMC.2017.06.052 [DOI] [PubMed] [Google Scholar]
- Liu Y, Miao K, Dunham NP, Liu H, Fares M, Boal AK, … Zhang X (2017). The Cation−π Interaction Enables a Halo-Tag Fluorogenic Probe for Fast No-Wash Live Cell Imaging and Gel-Free Protein Quantification. Biochemistry, 56(11), 1585–1595. 10.1021/acs.biochem.7b00056 [DOI] [PMC free article] [PubMed] [Google Scholar]
- López-Andarias J, Saarbach J, Moreau D, Cheng Y, Derivery E, Laurent Q, … Matile S (2020). . Manuscript in Preparation. [DOI] [PMC free article] [PubMed] [Google Scholar]
- Los GV, Encell LP, Mcdougall MG, Hartzell DD, Karassina N, Zimprich C, … Wood KV (2008). HaloTag: A Novel Protein Labeling Technology for Cell Imaging and Protein Analysis. ACS Chemical Biology, 3(6), 373–382. 10.1021/cb800025k [DOI] [PubMed] [Google Scholar]
- Madani F, Lindberg S, Langel Ü, Futaki S, & Gräslund A (2011). Mechanisms of cellular uptake of cell-penetrating peptides. Journal of Biophysics, 2011. 10.1155/2011/414729 [DOI] [PMC free article] [PubMed] [Google Scholar]
- Matsson P, Doak BC, Over B, & Kihlberg J (2016). Cell permeability beyond the rule of 5. Advanced Drug Delivery Reviews, 101, 42–61. 10.1016/j.addr.2016.03.013 [DOI] [PubMed] [Google Scholar]
- Mayor S, & Pagano RE (2007). Pathways of clathrin-independent endocytosis. Nature Reviews Molecular Cell Biology, 8(8), 603–612. 10.1038/nrm2216 [DOI] [PMC free article] [PubMed] [Google Scholar]
- Méndez-Ardoy A, Lostalé-Seijo I, & Montenegro J (2019). Where in the Cell Is our Cargo? Methods Currently Used To Study Intracellular Cytosolic Localisation. ChemBioChem, 20(4), 488–498. 10.1002/cbic.201800390 [DOI] [PubMed] [Google Scholar]
- Milech N, Longville BA, Cunningham PT, Scobie MN, Bogdawa HM, Winslow S, … Hopkins RM (2015). GFP-complementation assay to detect functional CPP and protein delivery into living cells. Scientific Reports, 5, 18329 10.1038/srep18329 [DOI] [PMC free article] [PubMed] [Google Scholar]
- Murrey HE, Judkins JC, Am Ende CW, Ballard TE, Fang Y, Riccardi K, … Johnson DS (2015). Systematic Evaluation of Bioorthogonal Reactions in Live Cells with Clickable HaloTag Ligands: Implications for Intracellular Imaging. Journal of the American Chemical Society, 137, 11461–11475. 10.1021/jacs.5b06847 [DOI] [PMC free article] [PubMed] [Google Scholar]
- Pei D, & Buyanova M (2019). Overcoming Endosomal Entrapment in Drug Delivery. Bioconjugate Chemistry, 30(2), 273–283. 10.1021/acs.bioconjchem.8b00778 [DOI] [PMC free article] [PubMed] [Google Scholar]
- Peraro L, Deprey KL, Moser MK, Zou Z, Ball HL, Levine B, & Kritzer JA (2018). Cell Penetration Profiling Using the Chloroalkane Penetration Assay. Journal of the American Chemical Society, 140(36), 11360–11369. 10.1021/jacs.8b06144 [DOI] [PMC free article] [PubMed] [Google Scholar]
- Peraro L, & Kritzer JA (2018). Emerging Methods and Design Principles for Cell-Penetrant Peptides. Angewandte Chemie International Edition, 57, 2–16. 10.1002/anie.201801361 [DOI] [PMC free article] [PubMed] [Google Scholar]
- Peraro L, Zou Z, Makwana KM, Cummings AE, Ball HL, Yu H, … Kritzer JA (2017). Diversity-Oriented Stapling Yields Intrinsically Cell-Penetrant Inducers of Autophagy. Journal of the American Chemical Society, 139(23), 7792–7802. 10.1021/jacs.7b01698 [DOI] [PMC free article] [PubMed] [Google Scholar]
- Puckett CA, & Barton JK (2009). Fluorescein Redirects a Ruthenium - Octaarginine Conjugate to the Nucleus. Journal of the American Chemical Society, 131, 8738–8739. 10.1021/ja9025165 [DOI] [PMC free article] [PubMed] [Google Scholar]
- Pye CR, Hewitt WM, Schwochert J, Haddad TD, Townsend CE, Etienne L, … Lokey RS (2017). Nonclassical Size Dependence of Permeation Defines Bounds for Passive Adsorption of Large Drug Molecules. Journal of Medicinal Chemistry, 60, 1665–1672. 10.1021/acs.jmedchem.6b01483 [DOI] [PMC free article] [PubMed] [Google Scholar]
- Qian Z, Dougherty PG, & Pei D (2015). Monitoring the cytosolic entry of cell-penetrating peptides using a pH-sensitive fluorophore. Chemical Communications, 51(11), 2162–2165. 10.1177/0963721412473755.Surging [DOI] [PMC free article] [PubMed] [Google Scholar]
- Richard JP, Melikov K, Vives E, Ramos C, Verbeure B, Gait MJ, … Lebleu B (2003). Cell-penetrating peptides. A reevaluation of the mechanism of cellular uptake. The Journal of Biological Chemistry, 278(1), 585–590. 10.1074/jbc.M209548200 [DOI] [PubMed] [Google Scholar]
- Shin M-K, Hyun Y-J, Lee JH, & Lim H-S (2018). Comparison of Cell Permeability of Cyclic Peptoids and Linear Peptoids. ACS Combinatorial Science, 20, 237–242. 10.1021/acscombsci.7b00194 [DOI] [PubMed] [Google Scholar]
- Tomat E, Nolan EM, Jaworski J, & Lippard SJ (2008). Organelle-specific zinc detection using zinpyr-labeled fusion proteins in live cells. Journal of the American Chemical Society, 130(47), 15776–15777. 10.1021/ja806634e [DOI] [PMC free article] [PubMed] [Google Scholar]
- Torchilin V (2008). Intracellular delivery of protein and peptide therapeutics. Drug Discovery Today: Technologies, 5(2–3). 10.1016/j.ddtec.2009.01.002 [DOI] [PubMed] [Google Scholar]
- Verdine GL, & Hilinski GJ (2012). Stapled peptides for intracellular drug targets. Methods in Enzymology, 503, 3–33. 10.1016/B978-0-12-396962-0.00001-X [DOI] [PubMed] [Google Scholar]
- Verdurmen WPR, Luginbühl M, Honegger A, & Plückthun A (2015a). Efficient cell-specific uptake of binding proteins into the cytoplasm through engineered modular transport systems. Journal of Controlled Release, 200, 13–22. 10.1016/J.JCONREL.2014.12.019 [DOI] [PubMed] [Google Scholar]
- Verdurmen WPR, Luginbühl M, Honegger A, & Plückthun A (2015b). Efficient cell-specific uptake of binding proteins into the cytoplasm through engineered modular transport systems. Journal of Controlled Release, 200, 13–22. 10.1016/j.jconrel.2014.12.019 [DOI] [PubMed] [Google Scholar]
- Wadia JS, Stan RV, & Dowdy SF (2004). Transducible TAT-HA fusogenic peptide enhances escape of TAT-fusion proteins after lipid raft macropinocytosis. Nature Medicine, 10(3), 310–315. 10.1038/nm996 [DOI] [PubMed] [Google Scholar]
- Wang H, Zhong C-Y, Wu J-F, Huang Y-B, & Liu C-B (2009). Enhancement of TAT cell membrane penetration efficiency by dimethyl sulphoxide. Journal of Controlled Release, 143, 64–70. 10.1016/j.jconrel.2009.12.003 [DOI] [PubMed] [Google Scholar]
- Wang J, Zhao Y, Wang C, Zhu Q, Du Z, Hu A, & Yang Y (2015). Organelle-Specific Nitric Oxide Detection in Living Cells via HaloTag Protein Labeling. PLoS ONE, 10(4), e0123986 10.1371/journal.pone.0123986 [DOI] [PMC free article] [PubMed] [Google Scholar]
- Yang NJ, & Hinner MJ (2015). Getting Across the Cell Membrane: An Overview for Small Molecules, Peptides, and Proteins. Methods in Molecular Biology, 1266, 29–53. 10.1007/978-1-4939-2272-7_3 [DOI] [PMC free article] [PubMed] [Google Scholar]
- Yin H, Huang Y, Deprey K, Condon N, Kritzer JA, Craik D, & Wang CK (2020). . Manuscript in Preparation. [DOI] [PMC free article] [PubMed] [Google Scholar]
- Yin W, & Rogge M (2019). Targeting RNA: A Transformative Therapeutic Strategy. Clinical and Translational Science, 12, 98–112. 10.1111/cts.12624 [DOI] [PMC free article] [PubMed] [Google Scholar]
- Yu P, Liu B, & Kodadek T (2005). A high-throughput assay for assessing the cell permeability of combinatorial libraries. Nature Biotechnology, 23(6), 746–751. 10.1038/nbt1099 [DOI] [PubMed] [Google Scholar]
- Zhao L, Kroenke CD, Song J, Piwnica-Worms D, Ackerman JJH, & Neil JJ (2008). Intracellular Water Specific MR of Microbead-adherent Cells: The HeLa Cell Intracellular Water Exchange Lifetime. NMR Biomedicine, 21(2), 159–164. 10.1002/nbm.1173 [DOI] [PMC free article] [PubMed] [Google Scholar]
- Zhu H, Fan J, Du J, & Peng X (2016). Fluorescent Probes for Sensing and Imaging within Specific Cellular Organelles. Accounts of Chemical Research, 49(10), 2115–2126. 10.1021/acs.accounts.6b00292 [DOI] [PubMed] [Google Scholar]