Abstract
To analyze diagnostic accuracy of chest computed tomography (CT) and RT-PCR (real-time polymerase chain reaction) for COVID-19 (coronavirus disease 19) pneumonia in early and progressive stages. To evaluate if combination of chest CT with RT-PCR can supplement the shortage of RT-PCR in diagnosis of COVID-19 pneumonia. We conducted a prospective study on 103 male patients. The study population were divided into two groups; early COVID-19 stage (number = 50 patients, with positive RT-PCR but mild symptoms) and progressive COVID-19 stage (number = 53, positive RT-PCR and sever symptoms including fever > 37.5 °C, cough, and shortness of breath). All patients underwent CT imaging. The early stage included typical category; 34% (17 out of 50 cases), 6% indeterminate category (3 cases), 10% atypical category (5 cases) and 50% (25 cases) were normal CT imaging. The progressive stage included typical category that was further divided to five subgroups; (i) peripheral bilateral lower lobe ground-glass opacity (GGO) in (37.7%), (ii) peripheral bilateral lower lobes GGO with peribronchovascular consolidation and bronchiolar dilatation in (18.8%), (iii) peripheral bilateral lower lobes GGO with crazy paving appearance in (15%), (iv) bilateral diffuse GGO in (18.8%), and (v) peripheral bilateral GGO with mediastinal lymph node enlargement (9.4%). Chest CT imaging could aid to supplement the shortages of PCR for clinically suspected patients of COVID-19 in the epidemic area as CT was positive in 50% of patients. Chest CT is very effective in detecting pulmonary parenchymal abnormalities in the progressive stage of COVID-19 patients in 100%.
Keywords: COVID-19, Atypical viral pneumonia, Ground glass opacities, CT
Introduction
The outbreak of a new coronavirus from Wuhan in late December 2019 has spread rapidly across China and worldwide [1]. COVID-19 (coronavirus disease 2019) is an infectious disease caused by severe acute respiratory syndrome coronavirus 2 (SARS-CoV-2), previously known as the 2019 novel coronavirus (2019-nCoV). The current outbreak was officially recognized as a pandemic on March 11, 2020 [2]. The SARS-CoV-2 is the third beta-coronavirus that causes severe respiratory illness in humans after the Middle East respiratory syndrome (MERS) and SARS coronaviruses. The three viruses are closely related as regard their cellular entry method via attachment of its receptor binding domain located in S1 unit to the angiotensin-converting enzyme-related carboxypeptidase receptor [3].
There are three clinical phases of COVID-19: (i) initial asymptomatic phase corresponds to the first two days of infection in which the inhaled virus binds to epithelial cells in the nose and starts replication and the patient is infectious in this phase; (ii) the symptoms appear 5–6 days after infection up to 14 days, infection relocates down the respiratory tract; and (iii) 20% of the patients will progress in the disease; develop pulmonary infiltrates, cytokine storm which triggers a violent attack to the body by the immune system, hypoxia, and acute respiratory distress syndrome (ARDS). The virus now reaches the gas exchange units of the lung and replicate within alveolar cells; finally, apoptosis and lung will lose most of their cells. Unfortunately, healing leads to more damage and fibrosis [4].
Diagnosis of COVID-19 is based on history, clinical manifestations such as fever, dry cough and tiredness, and some investigations. PCR is the gold standard tool for confirming COVID-19 infection, but some suggested that chest CT should be applied for clinically COVID-19 suspected patients to compensate false-negative PCR [5].
Chest CT is the best imaging modality that detects different parenchymal patterns and disease severity in COVID-19 patients [6]. The Radiological Society of North America (RSNA) classified the CT appearance of COVID-19 into four categories: (i) typical appearance: reverse halo sign peripheral, bilateral, ground glass pattern (GGO) with or without consolidation or visible intralobular lines; (ii) indeterminate appearance: few very small GGO with a non-rounded and non-peripheral distribution; (iii) atypical appearance: presence of isolated lobar or segmental consolidation without GGO and smooth interlobular septal thickening with pleural effusion; and (iv) negative for pneumonia: no features to suggest pneumonia, absent GGO and consolidation [7].
The CT findings of COVID-19 are similar to findings of lung injury seen in cryptogenic organizing pneumonia or atypical viral pneumonia. The early typical findings are bilateral peripheral ground pattern with or without superimposed consolidation in the posterior aspect of the lower lobes (Fig. 1). As the disease progresses, the findings are confluent ground glass opacities, crazy paving, bilateral patchy or diffuse consolidation, linear opacities, or archictural distortion or bronchiolar dilatation [8].
Fig. 1.
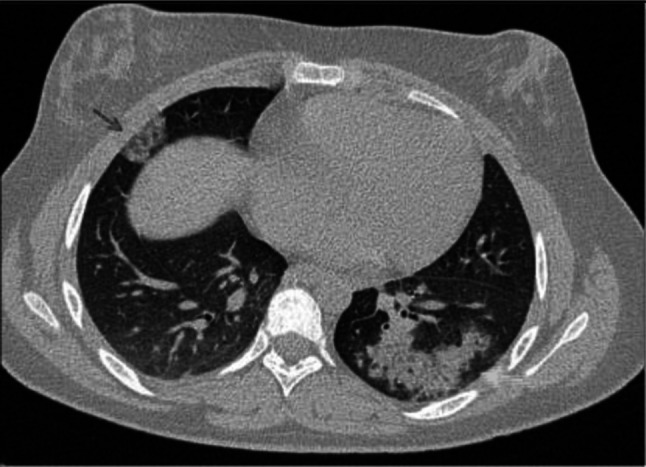
Transverse CT scan of patient with positive RT-PCR test shows RT lower lobe ground glass pattern (red arrows) and LT lower lobe consolidation (green arrows)
CT Manifestations of Patients with Positive COVID-19: Pattern Recognition Approaches for AI
Ground-glass opacity (Fig. 2) appears as hazy increased opacity of lung, with preservation of bronchial and vascular margins. [9].
Fig. 2.
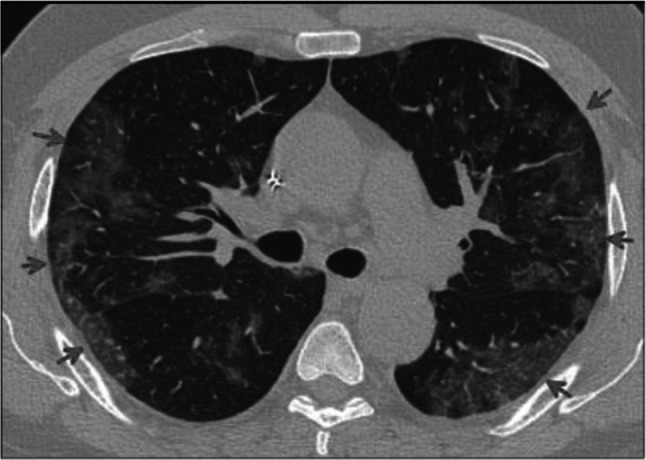
Transverse CT scan of patient with positive RT-PCR test shows bilateral peripheral ground glass appearance (red arrows)
The consolidation (Fig. 3) appears as a homogeneous increase in pulmonary parenchymal attenuation that obscures the margins of vessels and airway walls. An air bronchogram may be present [9].
Fig. 3.
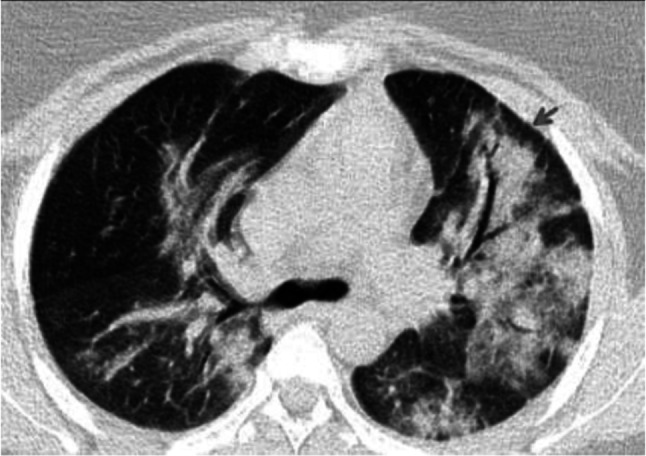
Transverse CT scan of patient with positive RT-PCR test shows air bronchogram as air-filled bronchi (red arrow) against background of high-attenuation consolidation
Crazy-paving pattern (Fig. 4) appears as thickened interlobular septa and intralobular lines superimposed on a background of ground-glass opacity, resembling irregularly shaped paving stones. [9].
Fig. 4.
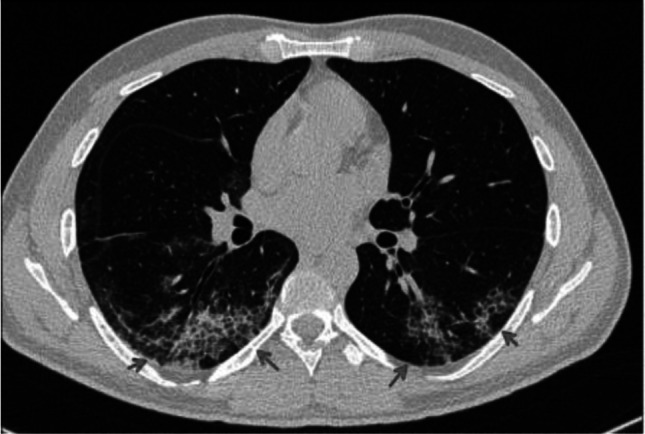
Transverse CT scan of patient with positive RT-PCR test shows bilateral crazy-paving pattern (red arrows)
Bronchiolar dilatation (Fig. 5) refers to widening of the gas filled bronchioles that appear too black relative to the surrounding lung parenchyma [9].
Fig. 5.
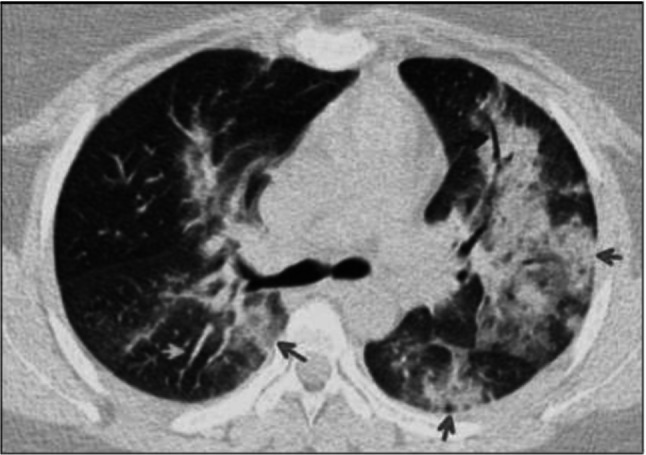
Transverse HRCT scan of patient with positive RT-PCR test shows bilateral diffuse consolidation (red arrows) with bronchiolar (blue arrow) and vascular dilatation (green arrow) suggesting typical category of COVID-19
Reversed halo sign or atoll sign (Fig. 6) refers to a focal rounded GGO surrounded by a ring-like consolidation [9].
Fig. 6.
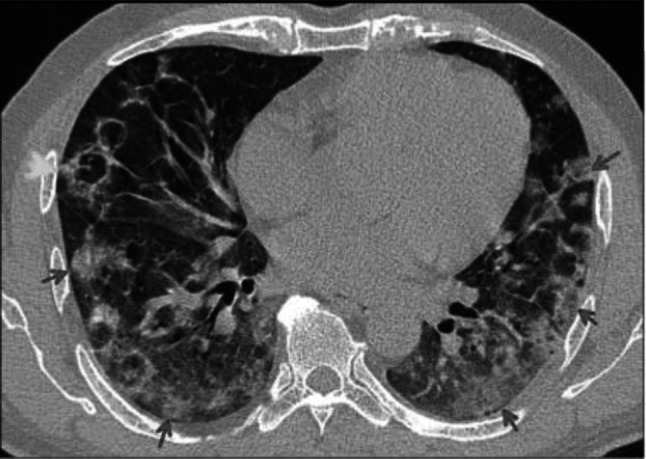
Transverse CT scan of patient with positive RT-PCR test shows bilateral diffuse GGO (red arrows) with reversed halo (atoll) sign (green arrow)
Vascular enlargement (Fig. 7) refers as the dilatation of pulmonary vessels around and within the lesions on CT images [9].
Fig. 7.
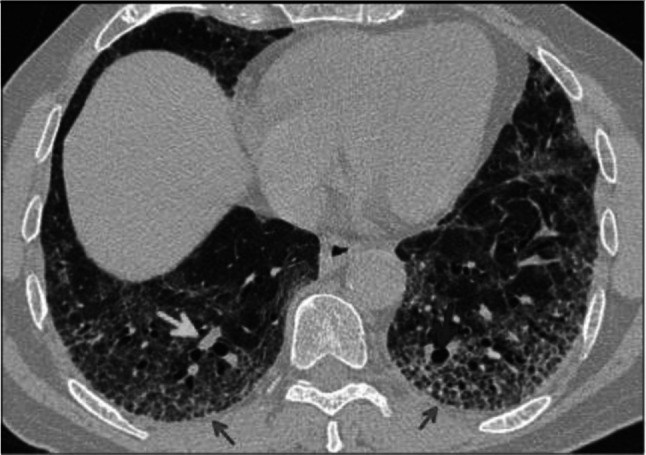
Axial CT image of patient with positive RT-PCR test shows bronchial wall thickening (blue arrow) and vascular enlargement (green arrow) in the setting of focal crazy paving pattern (red arrows)
Lymphadenopathy (Fig. 8): The thresholds for lymphadenopathy were typically 1 cm in short axis diameter for mediastinal nodes [9].
Fig. 8.
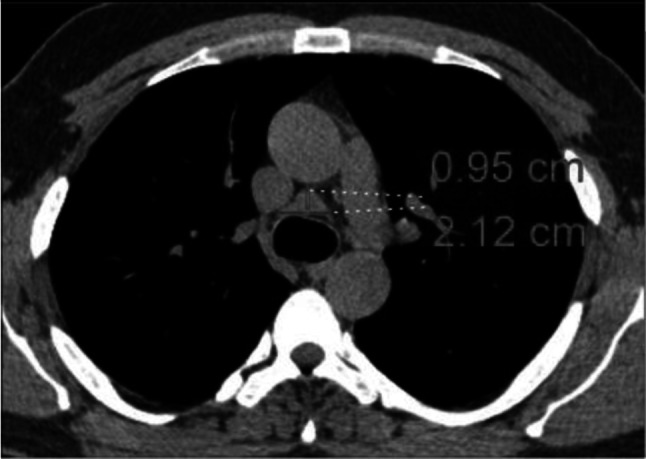
Transverse CT scan of patient with positive RT-PCR test shows enlarged pretracheal lymph nodes with short axis = 0.95 cm
Peribronchovascular bundle consolidation (Fig. 9) refers to consolidation with bronchiocenteric distribution [9].
Fig. 9.
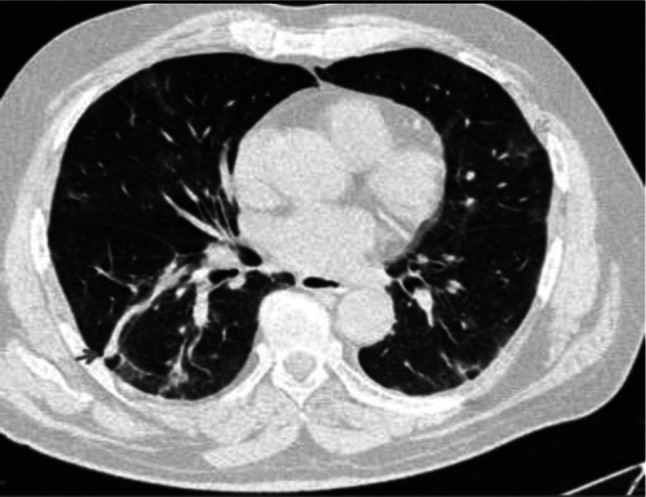
Transverse CT scan of patient with positive RT-PCR test shows RT lung lower lobe peribronchovascular bundle consolidation (red arrow) with ground glass pattern in the lingula of the upper lobe of the LT lung
In this study, we analyzed the diagnostic accuracy of chest CT and RT-PCR in early and progressive stages of COVID-19 pneumonia. Also, we evaluated if chest CT can supplement the shortage of RT-PCR in diagnosis of early stage of COVID-19 pneumonia.
Patients and Methods
Patients
A total of 103 male patients (the hospital is located in a farm area, in which only male farmers work) were enrolled in the current study. All patients were tested positive for SARS-COV2 by RT-PCR in the central laboratory, and their viral loads were reported from their records. The study population was divided into two groups: (i) early COVID-19 stage (number = 50 patients, with positive RT-PCR but mild symptoms) and (ii) progressive COVID-19 stage (number = 53, positive RT-PCR and severe symptoms including fever > 37.5 °C, cough, and shortness of breath). These patients were admitted and subjected to full history taking and clinical examination. An additional 60 patients had respiratory symptoms/suspicious for COVID-19 and negative PCR enrolled in the study as a control group.
CT Acquisition Technique
All patients underwent CT to confirm or exclude viral pneumonia. CT was performed on a Siemens SOMATOM Emotion eco (16-channel scanner). The scans were obtained while the patient in supine position at end inspiration using slice thickness 0.7 mm, scan mode helical, automatic tube current modulation according to the patient’s size, and X-ray attenuation changes during each tube rotation. The images were obtained on lung (window width, 1000–1,500 H; level, − 700 H) and mediastinal (window width, 350 H; level, 35–40 H) settings.
When imaging was needed, point-of-care imaging in the isolation room was used, the radiologist wore level I PPE and two technicians wore Level II PPE, one technician prepared the patient on the CT imaging table, while the other technician operated the CT console. If imaging within the radiology department was deemed to be crucial, planning considerations for the procedure would include clinical criteria, issues of patient transportation, isolation of the patient within the imaging suite, and decontamination of the imaging equipment and suite. Disinfection of a contaminated procedure room would include cleaning of soiled surfaces twice with disinfectant wipes at the completion of CT exam [10].
CT Image Analysis
The CT scans obtained were reviewed, and the consistency of two radiologists, who were aware of positive RT-PCR results, was evaluated with an inter-rater reliability and agreement metric measurement [11]. All chest CT scans were assessed according to the RSNA guidelines for the presence and distribution of abnormalities such as ground-glass opacities, consolidation, nodular opacities and septal lines, and associated abnormalities.
Statistical Analysis
Statistical analysis was performed using SPSS version 21.0 (SPSS Inc. Chicago, IL). All continuous variables were expressed as ranges, mean with standard deviation, and categorical variables as counts and percentages. The diagnostic performance of CT was evaluated with sensitivity, specificity, positive predictive value (PPV), negative predictive value (NPV), and diagnostic accuracy considering RT-PCR as the reference standard. Differences between the groups were tested using chi-square and odds ratio with 95% confidence interval. P < 0.05 was considered as a level of significance.
Results
A total of 103 male patients were included in this study and underwent CT after they had been tested positive by RT-PCR. Their age ranged from 30 to 61 years with a mean 52.49 ± 8.27 years (progressive stage 54.66 ± 7.02 vs. early stage 50.18 ± 8.85). Viral concentration (± SD) was found to be significantly higher among patients with progressive COVID-19, than in those without (5.28 ± 1.51 vs 3.61 ± 1.35, P < 0.001). Patients above 50 years, with chronic disease, and bad social situations were at more risk to have a progressive disease and showed odd ratio = 2.75, 1.41, 1.52, respectively. However, the P value was significant only for the old age. Smokers showed odd ratio = 0.97 indicating a non-significant relationship between smoking and severity of COVID-19) [12], as seen in Table 1.
Table 1.
Risk factors associated with the severity of COVID-19
| Risk factors | Early stage COVID-19 N = 50 | Progressive stage COVID-19 N = 53 | Odd ratio and 95% confidence interval | P value | |||
|---|---|---|---|---|---|---|---|
| No | % | No | % | ||||
| Baseline | Age ≥ 50 | 32 | 64 | 44 | 83 | 2.75 (1.10 to 6.91) | 0.03 |
| Medical disease (asthma, liver, cardiac, renal, cancer) | 40 | 80 | 45 | 85 | 1.41 (0.51 to 3.91) | 0.51 | |
| Crowding (> 2 people/room) | 27 | 54 | 34 | 64 | 1.52 (0.69 to 3.36) | 0.30 | |
| Smoking | 38 | 76 | 40 | 75.5 | 0.97 (0.39 to 2.39) | 0.95 | |
| CT findings | Crazy paving | 0 | 0 | 8 | 15 | 18.87 (1.06 to 336.20) | 0.045 |
| Peribronchovascular consolidation | 0 | 0 | 10 | 18.8 | 24.38 (1.39 to 428.22) | 0.03 | |
| Bronchial dilatation | 0 | 0 | 10 | 18.8 | 24.38 (1.39 to 428.22) | 0.03 | |
| Vascular dilatation | 0 | 0 | 10 | 18.8 | 24.38 (1.39 to 428.22) | 0.03 | |
As regard the control group, only four patients (6.7%) had evidence of abnormal CT compatible with viral pneumonia; on the other hand, chest CT scans of patients with COVID-19 were interpreted into two groups of patients in early stage (50 cases) and in progressive stage (53 cases) and the reporting was classified into four categories for SARS-CoV-2 pneumonia (typical, indeterminate, atypical and negative) according to the standardized CT language of RSNA [7].
Early COVID-19 Stage CT Findings
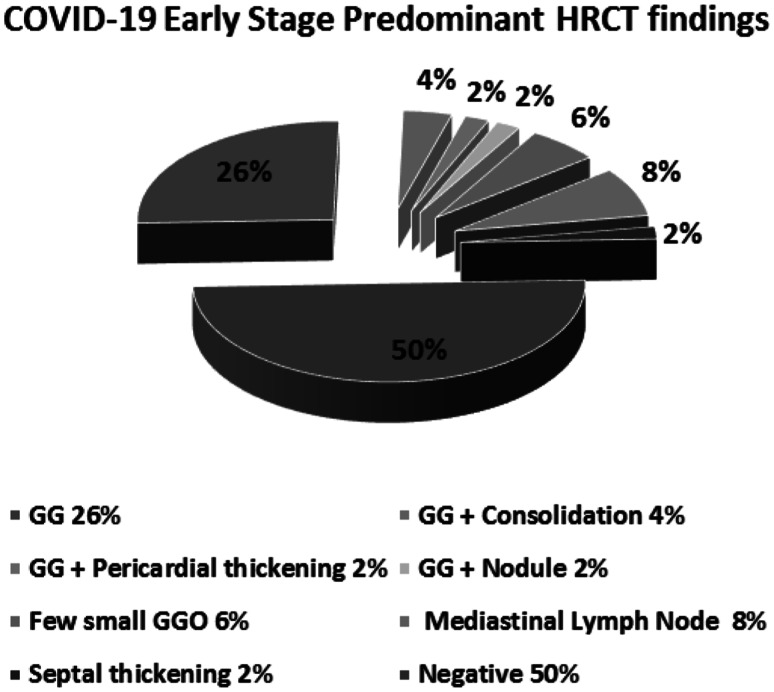
As shown in Table 2 and Fig. 10, the early stage that included typical category, the most prominent CT finding, accounted for 34% (17 out of 50 cases), 6% indeterminate category (3 cases), 10% atypical category (5 cases), and 50% (25 cases), was negative for pneumonia and showed normal CT imaging.
Table 2.
CT chest findings in early COVID-19 stage group of patients
| CT categories | Predominant CT findings | Early stage COVID group No = 50 |
|
|---|---|---|---|
| No | % | ||
| Typical | Ground glass pattern | 13 | 26 |
| Ground glass pattern + consolidation | 2 | 4 | |
| Ground glass pattern + pericardial thickening | 1 | 2 | |
| Ground glass pattern + Nodule | 1 | 2 | |
| Indeterminate | Few small ground glass pattern | 3 | 6 |
| Atypical | Mediastinal lymphadenopathy | 4 | 8 |
| septal thick | 1 | 2 | |
| Negative | No ground glass pattern and no consolidation | 25 | 50 |
Fig. 10.
CT chest findings in early COVID-19 stage group of patients. The typical category (34%), indeterminate category (6%), atypical category (10%), and negative category (50%). Each category was further divided into subgroups. The typical category was subdivided into ground glass opacities (26%), ground glass and consolidation (4%), ground glass and pericardial thickening (2%), and ground glass and nodule (2%). The Indeterminate category contains few small ground glass pattern (6%). The atypical category was subdivided into mediastinal lymphadenopathy (8%) and septal thickening (2%)
The typical category group was further divided into four subgroups: (i) 13 cases showed peripheral bilateral lower lobes ground glass pattern (GGO) (Fig. 11), (ii) two cases showed peripheral bilateral lower lobes GGO with consolidation (Fig. 12), (iii) one case showed peripheral bilateral lower lobes consolidation with thickened pericardium, and (iv) one case showed peripheral bilateral lower lobes GGO with nodule (Fig. 13). The Indeterminate CT category (three cases) was few small GGO with a non-rounded and non-peripheral distribution (Fig. 14). Atypical appearance is divided into two subgroups: (i) four cases showed mediastinal lymph nodes enlargement with short axis more than 1 cm and (ii) one case showed bilateral interlobular septal thickening. Finally, 25 cases showed absent GGO and consolidation and reported negative for pneumonia.
Fig. 11.
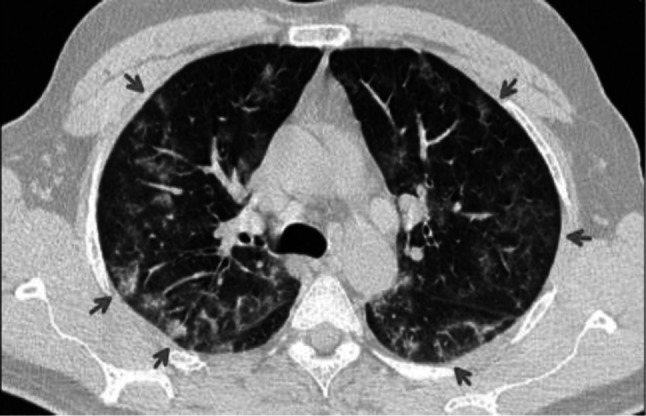
Transverse CT scan of patient with positive RT-PCR test and mild symptoms shows peripheral ground glass pattern in both lungs (red arrows) suggesting typical category of early stage of COVID-19
Fig. 12.
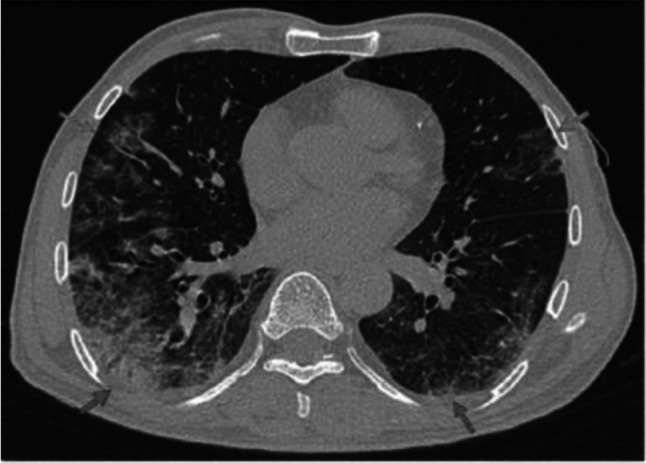
Transverse CT scan of patient with positive RT-PCR test and mild symptoms shows peripheral ground glass pattern in the lateral segment of the middle lobe of the RT lung and inferior lingula of the LT lung (green arrows). Mixed ground glass and consolidation in the posterior and lateral segments of the lower lobes of both lungs (red arrows) suggesting typical category of early stage of COVID-19
Fig. 13.
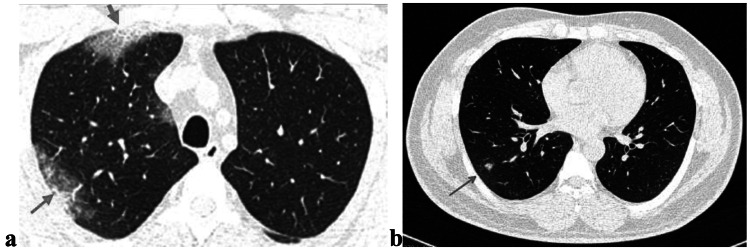
Transverse CT scan of patient with positive RT-PCR test and mild symptoms shows a multiple peripheral ground glass pattern in the anterior and posterior segments of the upper lobe of the RT lung (green arrows) and b a nodule in the lateral segment of the lower lobe of the RT lung (red arrow) suggesting typical category of early stage of COVID-19
Fig. 14.
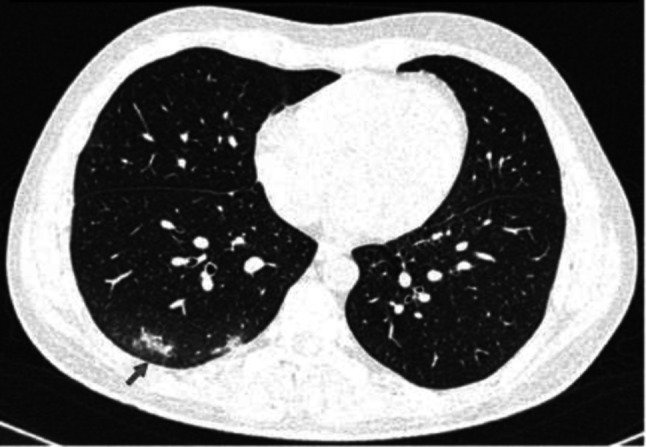
Transverse CT scan of patient with positive RT-PCR test and mild symptoms shows peripheral few ground glass pattern in the posterior segment of the lower lobe of the RT lung (red arrow) suggesting indeterminate category of early stage of COVID-19
Progressive COVID-19 Stage CT Findings
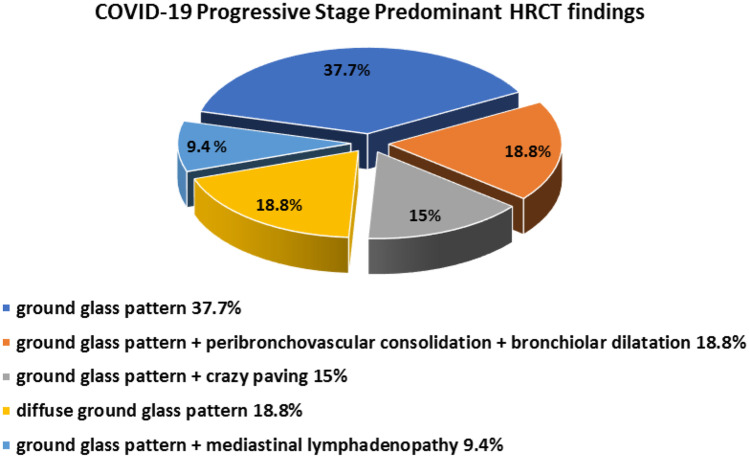
Typical pattern was detected in all 53 cases, as shown in Table 3 and Fig. 15. This group was further divided into five subgroups: (i) peripheral bilateral lower lobes GGO were found in 20 cases (37.7%) (Fig. 16); (ii) peripheral bilateral lower lobe GGO with peribronchovascular consolidation, and bronchiolar and vascular dilatation were found in 10 cases (18.8%) (Fig. 17); (iii) peripheral bilateral lower lobe GGO with crazy paving appearance were found in eight cases (15%) (Fig. 18); (iv) bilateral diffuse GGO were found in 10 cases (18.8%) (Fig. 19); and (v) peripheral bilateral GGO with mediastinal lymph node enlargement-short axis enlargement more than 1 cm was found in five cases (9.4%).
Table 3.
CT chest findings in progressive COVID-19 stage group of patients
| CT category | Predominant CT findings | Progressive COVID-19 group No = 53 |
|
|---|---|---|---|
| No | % | ||
| Typical | Ground glass pattern | 20 | 37.7 |
| Ground glass pattern + peribronchovascular consolidation + bronchiolar and vascular dilatation | 10 | 18.8 | |
| Ground glass pattern + crazy paving | 8 | 15 | |
| Diffuse ground glass pattern | 10 | 18.8 | |
| Ground glass pattern + mediastinal lymphadenopathy | 5 | 9.4 | |
Fig. 15.
CT chest findings in progressive COVID-19 stage group of patients. The typical category was subdivided into ground-glass opacities (37.7%), ground glass, peribronchovascular consolidation, and bronchiolar dilatation (18.8%), ground glass and crazy paving (15%), diffuse ground glass (18.8%), and ground glass and mediastinal lymphadenopathy (9.4%)
Fig. 16.
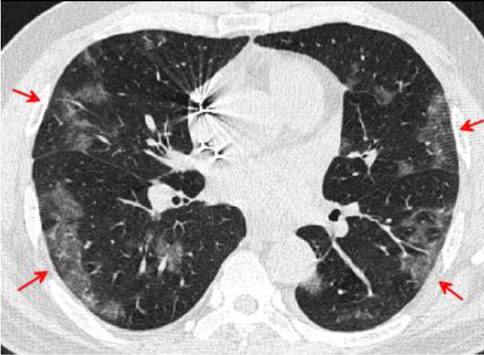
Transverse CT scan of patient with positive RT-PCR test, severe symptoms shows bilateral peripheral ground glass pattern suggesting typical category of progressive stage of COVID-19
Fig. 17.
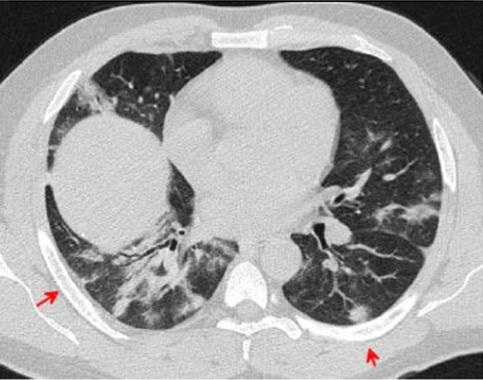
Transverse CT scan of patient with positive RT-PCR test and severe symptoms shows peripheral ground glass pattern in the posterior and lateral aspects of the lower lobes of both lungs with peribronchovascular consolidation, vascular dilatation, and bronchiolar dilatation suggesting typical category of progressive stage of COVID-19
Fig. 18.
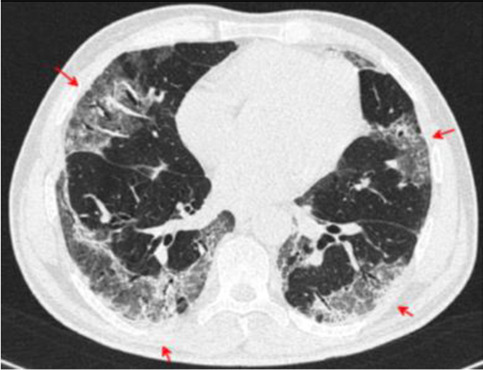
Transverse CT scan of patient with positive RT-PCR test and severe symptoms shows bilateral crazy paving with brochiolar and vascular dilatation, and architectural distortion suggesting typical category of severe stage of COVID-19
Fig. 19.
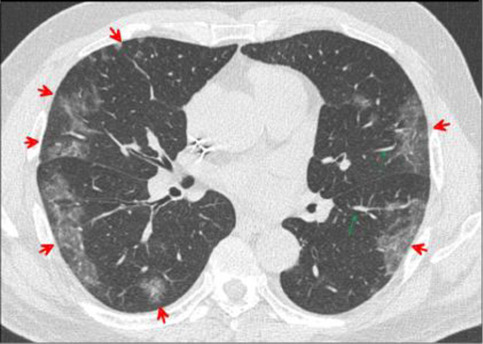
Transverse CT scan of patient with positive RT-PCR test and severe symptoms shows bilateral peripheral patchy ground glass pattern (red arrows) with vascular dilatation (green arrows) suggesting typical category of severe stage of COVID-19
Sensitivity and Specificity of CT When Compared with the PCR as the Gold Standard Test
The sensitivity and specificity of CT imaging were promising in the diagnosis of the progressive stage of COVID-19 (100 and 93.33%, respectively), but when we argue the early stages of the disease, the sensitivity was markedly decreased and the high specificity was kept (50 and 93.33%, respectively). The positive predictive values (PPVs) and negative predictive values (NPVs) showed also disparity in the diagnosis of early and progressive stages of COVID-19 (PPVs; 86.21, 92.98% and NPVs; 69.14, 100% respectively). The accuracy of CT was 73.64% for the early stages and 96.46% in the diagnosis of the progressive stage, as shown in Table 4.
Table 4.
Sensitivity and specificity of CT when PCR is considered as gold standard test; PPV: positive predictive value, NPV: negative predictive value
| CT | Early stage COVID-19 | Progressive stage COVID-19 | Total COVID-19 |
|---|---|---|---|
|
Sensitivity 95% CI |
50.00% 35.53–64.47% |
100.00% 93.28–100.00% |
75.73% 66.29–83.64% |
|
Specificity 95% CI |
93.33% 83.80–98.15% |
93.33% 83.80–98.15% |
93.33% 83.80–98.15% |
|
PPV 95% CI |
86.21% 69.97–94.37% |
92.98% 83.72–97.16% |
95.12% 88.26–98.06% |
|
NPV 95% CI |
69.14% 62.74–74.87% |
100.00% |
69.14% 61.27–76.03% |
|
Accuracy 95% CI |
73.64% 64.38–81.58% |
96.46% 91.18–99.03% |
82.21% 75.46–87.75% |
Imaging Prognostic Factors for Progressive COVID-19
Table 1 showed eight patients with chest CT findings of crazy-paving pattern and 10 patients with peribronchovascular consolidation, and bronchial and vascular dilatation. These CT findings were associated with the risk of severe (COVID 19) disease.
Discussion
No test gives a 100% accurate result. Any diagnostic test needs to be evaluated to determine its sensitivity and specificity by comparison with a gold standard. RT-PCR is considered as the gold standard method of rapid screening of COVID-19; however, the lack of such a clear-cut makes evaluation of PCR test accuracy challenging, especially with reported false negative rates between 2 and 29% and so its sensitivity range is 71–98%. Along these lines, a negative outcome does not exclude COVID-19 disease [13].
Chest CT is relatively low cost and can play a role in detection, evaluation, and monitoring the treatment response of COVID-19 [14]. In the following, we attempt to discuss the importance of combination of RT-PCR and clinical features especially CT images which could facilitate the COVID-19 diagnosis. In the current study, the diagnostic performance of chest CT was hopeful and in concordance with most of the published articles about COVID-19 pneumonia [15–22, 23].
Early COVID-19 Stage CT Findings
In early stage of COVID-19, the typical feature was the most prominent finding (34%) and peripheral bilateral lower lobes; GGO was the most common imaging that found in 26%, which were similar to the systematic review performed by Salehi et al. [24]; however, interesting differences were reported in the existing study as peripheral bilateral lower lobes, GGO with nodule were found in 2% and peripheral bilateral lower lobes, GGO with consolidation were found in 4% and peripheral bilateral lower lobes, and consolidation with thickened pericardium were found in 2%. On the other hand, Zhu et al. reported that a higher percentage, 47%, of GGO were found in patients with COVID-19 [25]. The CT features of few small GGO with a non-rounded and non-peripheral distribution were seen in the early stage indeterminate category (6%) which was inconsistent with many previously published reports [26]. The present study reported two atypical patterns in the early stage of COVID-19 patients; the first was mediastinal adenopathy that was not frequent and reported in 8% of patients only that was in parallel with Xavier Valette et al. findings [27], and the second was the bilateral interlobular septal thickening (2%), which in comparison was disconcordant with the findings reported by Cuiping Bao MD, et al. who showed a higher percentage of the interlobular septal thickening (48.46%) [28].
In the present study, in the early stage, half of the patients with positive RT-PCR were negative for pneumonia (no GG or consolidation) by CT. Using RT-PCR as a reference, the CT sensitivity was 50.00% and the specificity was 93.33%. Higher percentages were reported by He et al. (sensitivity was 77.00%, and the specificity was 96.33%) [29]. Our results suggest that CT imaging was performed in early period before lung injury starts to take place as CT shows lung changes at least one week after pathology starts [30]. The positive and negative predictive values in our study were 86.21% and 69.14%, respectively. Wen et al. reported different values of chest CT for COVID-19 as PPV and NPV were estimated at 92% and 42%, respectively, in a population with high pretest probability for the COVID-19 disease (e.g., 85% prevalence by RT-PCR) [31]. The relatively low negative predictive value suggests that CT may not be valuable as a screening test for COVID-19 at least in earlier stages of the disease.
Progressive COVID-19 Stage CT Findings
In the progressive stage of this study, all the patients with positive RT-PCR were positive for pneumonia appearance by CT and have typical signs for COVID-19. Using RT-PCR as a reference, the CT sensitivity was 100.00%, and the specificity was 93.33%. Our results with high NPV in progressive stage of COVID-19 support the diagnostic value of CT in this stage, which agreed with He et al. who reported that CT and PCR have comparable diagnostic performance in identification of suspected COVID-19 patients [29].
In the existing study, crazy-paving pattern, peribronchovascular consolidation, bronchial dilatation, and vascular dilatation were the chest CT findings which are associated with severe COVID-19 disease, and this agreed with Zhang et al. [32]. Most recently, Chung et al. showed a very low frequency of crazy paving pattern compared with our results [33]. The enlarged subsegmental pulmonary vessels were seen in 18.8% of study participants. This finding was described by Albarello et al. in two patients in Italy [34]. Bai et al. described subsegmental vascular enlargement in 59% of the patients with COVID-19 pneumonia versus 22% of those with non-viral pneumonia. [35]. Ye et al. suggested vascular enlargement may be due to pro-inflammatory factors [36]. Subsegmental vascular enlargement could reflect the hyperemia induced by SARS-CoV-2 infection versus viral pulmonary infections such as SARS and MERS [37–39].
The limitations of this study were the small sample size, and the cases lacked follow-up. Larger sample sizes and follow-up for patients are required for further verification.
Conclusion
In summary, our study shows that although RT-PCR is the gold standard tool for confirming COVID-19 infection, chest CT imaging may aid in rapid screening and diagnosis to supplement the shortages of PCR for clinically suspected patients especially in the epidemic area as CT was found to be positive in 50% of patients when patients develop fever, cough, and unexplained weakness. Chest CT alone is not recommended for early detection of COVID-19 by most radiological societies presumably due to lag of CT detection of lung injury behind clinical disease onset by one week. Chest CT examination is very effective (100%) in detecting pulmonary parenchymal abnormalities in the progressive stage of COVID-19 pneumonia. Typical CT findings of COVID-19 include peripherally distributed multifocal GGOs with patchy consolidations and posterior part of lower lobe involvement predilection. The presence of crazy-paving pattern, vascular enlargement (more than 3 mm diameter), bronchiolar dilatation, and peribronchovascular consolidation indicate disease progression.
Acknowledgements
We would like to acknowledge the entire Radiological Medical and Technical Staff of the Radiology Unit for collection of data.
Abbreviations
- ARDS
Acute respiratory distress syndrome
- COVID-19
Coronavirus disease 19
- GGO
Ground-glass opacity
- MERS
Middle East respiratory syndrome
- RT-PCR
Real-time-reverse-transcription polymerase chain reaction
- SARS
Severe acute respiratory syndrome
- SARS-CoV-2
Severe acute respiratory syndrome coronavirus 2
Declarations
Conflict of Interest
The authors declare that they have no conflict of interest.
Footnotes
Publisher’s Note
Springer Nature remains neutral with regard to jurisdictional claims in published maps and institutional affiliations.
Contributor Information
Mohamed N. E. Kassem, Email: mkassem22@hotmail.com
Doaa T. Masallat, Email: Doaamasallat@yahoo.com
References
- 1.Na Zhu et al. (2020) A novel coronavirus from patients with pneumonia in China, 2019. New England Journal of Medicine. 10.1056/NEJMoa2001017 - Pubmed. [DOI] [PMC free article] [PubMed]
- 2.WHO Director-General’s opening remarks at the media briefing on COVID-19 - 11 March 2020. Who.int. 2020.
- 3.Walls AC, et al. Structure, function and antigenicity of the SARS-CoV-2 spike glycoprotein. Bio Rxiv. 2020 doi: 10.1101/2020.02.19.956581. [DOI] [PMC free article] [PubMed] [Google Scholar]
- 4.Mason RJ. Pathogenesis of COVID-19 from a cell biology perspective Eur Respir J2020; 55: 2000607 10.1183/13993003.00607-2020. [DOI] [PMC free article] [PubMed]
- 5.Joynt Gavin M, Wu William KK. Understanding COVID-19: what does viral RNA load really mean? Lancet Infect Dis. pii. 2020;S1473–3099(20):30237–1. doi: 10.1016/S1473-3099(20)30237-1. [DOI] [PMC free article] [PubMed] [Google Scholar]
- 6.Pan F, Ye T, Sun P, et al. Time course of lung changes on chest CT during recovery from 2019 novel coronavirus (COVID-19) pneumonia. Radiology. 2020 doi: 10.1148/radiol.2020200370. [DOI] [PMC free article] [PubMed] [Google Scholar]
- 7.Simpson S et al. Radiological Society of North America Expert Consensus Statement on Reporting Chest CT Findings Related to COVID-19. Endorsed by the Society of Thoracic Radiology, the American College of Radiology, and RSNA. Radiology: Cardiothoracic Imaging 2020 2:2. 10.1148/ryct.2020200152. [DOI] [PMC free article] [PubMed]
- 8.Yueying Pan and Hanxiong Guan, Imaging changes in patients with 2019-nCov. European Society of Radiology February 2020. 10.1007/s00330-020-06713-z. [DOI] [PMC free article] [PubMed]
- 9.Hansell DM, Bankier AA, Macmahon H et al. Fleischner Society: glossary of terms for thoracic imaging. Radiology. 2008;246 (3): 697–722. Radiology (full text) 10.1148/radiol.2462070712. [DOI] [PubMed]
- 10.Yan C, Lin J, Xu Y. Recommendations for coronavirus disease 2019 (COVID-19) prevention and infection control in the radiology department: Chinese experience. Clin Imaging. 2021 Jan;69:33–36. 10.1016/j.clinimag.2020.06.044. Epub 2020 Jul 1. PMID: 32652455; PMCID: PMC7327467. [DOI] [PMC free article] [PubMed]
- 11.Tinsley HE, Weiss DJ. Interrater reliability and agreement of subjective judgements. Journal of Counseling Psychology. 1975;22:358–376. doi: 10.1037/h0076640. [DOI] [Google Scholar]
- 12.Vardavas CI, Nikitara K. COVID-19 and smoking: A systematic review of the evidence. Tobacco induced diseases. 2020. 18(March):20. 10.18332/tid/119324. [DOI] [PMC free article] [PubMed]
- 13.Oikonomou A, Hansell DM. Organizing pneumonia: the many morphological faces. Eur Radiol. 2002;12(6):1486–1496. doi: 10.1007/s00330-001-1211-3. [DOI] [PubMed] [Google Scholar]
- 14.Watson J, et al. Interpreting a covid-19 test result. BMJ. 2020;369:m1808. doi: 10.1136/bmj.m1808. [DOI] [PubMed] [Google Scholar]
- 15.Correlation Tao Ai, of Chest CT and RT-PCR Testing in Coronavirus Disease,, et al. (COVID-19) in China: A Report of 1014 Cases. Radiology. 2019;2020:200642. doi: 10.1148/radiol.2020200642. [DOI] [PMC free article] [PubMed] [Google Scholar]
- 16.Chung M, Bernheim A, Mei X et al (2020) CT imaging features of 2019 novel coronavirus (2019-nCoV). Radiology:200230. 10.1148/radiol.2020200230. [DOI] [PMC free article] [PubMed]
- 17.Lei J, Li J, Li X, Qi X. CT imaging of the 2019 novel coronavirus (2019-nCoV) pneumonia. Radiology. 2020 doi: 10.1148/radiol.2020200236. [DOI] [PMC free article] [PubMed] [Google Scholar]
- 18.Fang Y, Zhang H, Xu Y, Xie J, Pang P, Ji W. CT Manifestations of two cases of 2019 novel coronavirus (2019-nCoV) pneumonia. Radiology. 2020 doi: 10.1148/radiol.2020200280. [DOI] [PMC free article] [PubMed] [Google Scholar]
- 19.Shi H, Han X, Zheng C. Evolution of CT manifestations in a patient recovered from 2019 novel coronavirus (2019-nCoV) pneumonia in Wuhan. China: Radiology; 2020. [DOI] [PMC free article] [PubMed] [Google Scholar]
- 20.Chinese Society of Radiology (2020) Imaging diagnosis of 2019- nCoV pneumonia: expert recommendation of Chinese Society of Radiology, the first edition. Chin J Radiol 54(00): E001–E001. 10.3760/cma.j.issn.1005-1201.2020.0001.
- 21.Kim EA, Lee KS, Primack SL et al (2002) Viral pneumonias in adults: radiologic and pathologic findings. Radiographics 22 Spec No:S137–S149. 10.1148/radiographics.22.suppl_1.g02oc15s137 [DOI] [PubMed]
- 22.Koo HJ, Lim S, Choe J, Choi SH, Sung H, Do KH. Radiographic and CT features of viral pneumonia. Radiographics. 2018;38(3):719–739. doi: 10.1148/rg.2018170048. [DOI] [PubMed] [Google Scholar]
- 23.Ooi GC, Khong PL, Müller NL et al (2004) Severe acute respiratory syndrome: temporal lung changes at thin-section CT in 30 patients. Radiology 230(3):836–844 75. [DOI] [PubMed]
- 24.Salehi S, Abedi A, Balakrishnan S, Disease Coronavirus, et al. (COVID-19): A Systematic Review of Imaging Findings in 919 Patients. AJR Am J Roentgenol. 2019;2020:1–7. doi: 10.2214/ajr.20.23034. [DOI] [PubMed] [Google Scholar]
- 25.Zhu W, Xie K, Lu H, et al. Initial clinical features of suspected coronavirus disease 2019 in two emergency departments outside of Hubei, China. J Med Virol 2020. 10.1002/jmv.25763 [DOI] [PMC free article] [PubMed]
- 26.Jeffrey P Kanne et al. Essentials for Radiologists on COVID-19: An update—radiology scientific expert panel. (2020). Radiology. 10.1148/radiol.2020200527 - Pubmed [DOI] [PMC free article] [PubMed]
- 27.Valette X et al. Mediastinal lymphadenopathy in patients with severe COVID-19. April 21, 2020 10.1016/S1473-3099(20)30310-8. [DOI] [PMC free article] [PubMed]
- 28.Cuiping Bao MD, et al. Coronavirus disease 2019 (COVID-19) CT findings: a systematic review and meta-analysis. Journal of the American College of Radiology, 25 March 2020. 10.1016/j.jacr.2020.03.006. [DOI] [PMC free article] [PubMed]
- 29.He JL, et al. Diagnostic performance between CT and initial real-time RT-PCR for clinically suspected, coronavirus disease (COVID-19) patients outside Wuhan. China. Respiratory Medicine. 2019;168:105980. doi: 10.1016/j.rmed.2020.105980. [DOI] [PMC free article] [PubMed] [Google Scholar]
- 30.Feng Pan MD, et al. Time Course of Lung Changes On Chest CT During Recovery From 2019 Novel Coronavirus (COVID-19) Pneumonia. Radiology. 2020;295(3):715–721. doi: 10.1148/radiol.2020200370. [DOI] [PMC free article] [PubMed] [Google Scholar]
- 31.Wen Z, Chi Y, Zhang L, Liu H, Du K, Li Z, Chen J, Cheng L, Wang D. Coronavirus disease 2019: initial detection on chest CT in a retrospective multicenter study of 103 Chinese Subjects. RYCT-20–0092, Radiology: Cardiothoracic Imaging, Vol. 2, No. 2. Apr 6 2020 10.1148/ryct.2020200092. [DOI] [PMC free article] [PubMed]
- 32.Zhang et al. CT features of SARS-CoV-2 pneumonia according to clinical presentation: a retrospective analysis of 120 consecutive patients from Wuhan city. European Society of Radiology. April 2020. 10.1007/s00330-020-06854-1. [DOI] [PMC free article] [PubMed]
- 33.Chung M, Bernheim A, Mei X, et al. CT Imaging Features of 2019 Novel Coronavirus (2019-nCoV) Radiology. 2020;295(1):202–207. doi: 10.1148/radiol.2020200230. [DOI] [PMC free article] [PubMed] [Google Scholar]
- 34.Albarello F, Pianura E, Di Stefano F, et al. 2019-novel Coronavirus severe adult respiratory distress syndrome in two cases in Italy: An uncommon radiological presentation. Int J Infect Dis. 2020;93:192–197. doi: 10.1016/j.ijid.2020.02.043. [DOI] [PMC free article] [PubMed] [Google Scholar]
- 35.Bai HX, Hsieh B, Xiong Z, et al. Performance of radiologists in differentiating COVID-19 from viral pneumonia on chest CT. Radiology 2020:200823. 10.1148/radiol.2020200823. [DOI] [PMC free article] [PubMed]
- 36.Ye Z, Zhang Y, Wang Y, et al. Chest CT manifestations of new coronavirus disease 2019 (COVID-19): a pictorial review. Eur Radiol 2020. 10.1007/s00330-020-06801-0 [DOI] [PMC free article] [PubMed]
- 37.Li W, Moore MJ, Vasilieva N, et al. Angiotensin-converting enzyme 2 is a functional receptor for the SARS coronavirus. Nature. 2003;426(6965):450–454. doi: 10.1038/nature02145. [DOI] [PMC free article] [PubMed] [Google Scholar]
- 38.Nicolaou S, Al-Nakshabandi NA, Muller NL. SARS: imaging of severe acute respiratory syndrome. AJR Am J Roentgenol. 2003;180(5):1247–1249. doi: 10.2214/ajr.180.5.1801247. [DOI] [PubMed] [Google Scholar]
- 39.Ooi GC, Khong PL, Muller NL, et al. Severe acute respiratory syndrome: temporal lung changes at thin-section CT in 30 patients. Radiology. 2004;230(3):836–844. doi: 10.1148/radiol.2303030853. [DOI] [PubMed] [Google Scholar]


