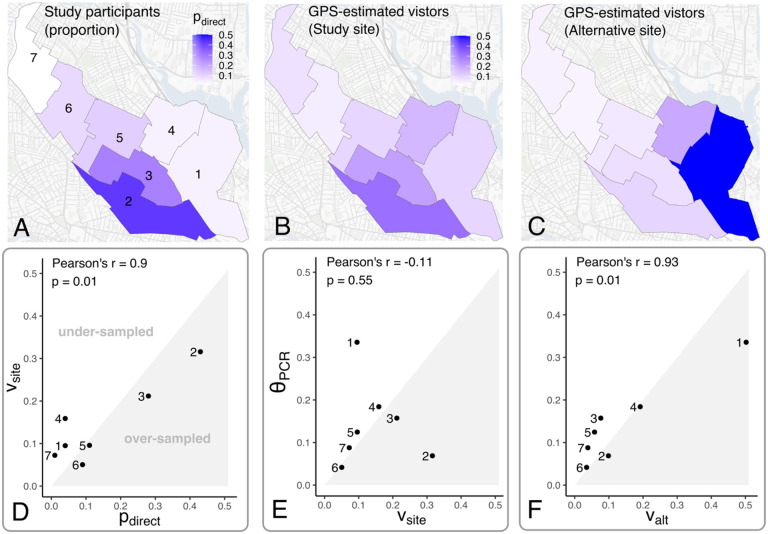
Figure 2. GPS-estimated visitor catchment distributions for actual and hypothetical alternative study sites.
GPS-estimated visitor catchment distributions for (A) the actual study location or (B) a hypothetical alternative study site in Somerville Ward 1 . Correlations between , , and the cumulative incidence of PCR-confirmed SARS-CoV-2 infection are shown in (C) and (D).

