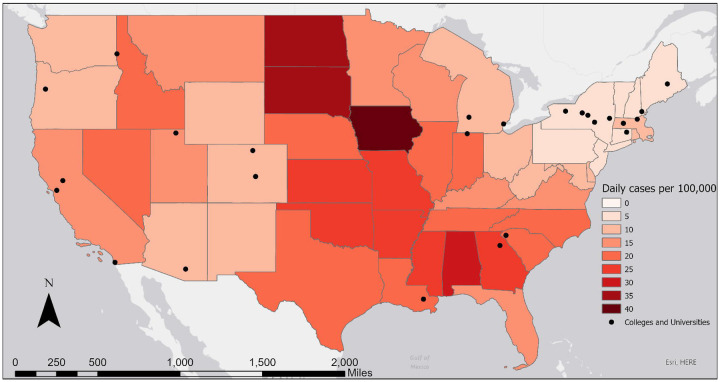
Figure 1.
Map showing location of case study colleges and average daily number of COVID-19 cases per 100,000 population during the last week of August 2020, by state. Data from Centers for Disease Control and Prevention, 2020 (CDC (Centers for Disease Control and Prevention) 2020a). Note: A single dot in Utah, Oregon, and Maine represents a system of more than one university in each state that work together on wastewater surveillance.

