Abstract
Intrinsically disordered proteins (IDP) are proteins that sample a heterogeneous ensemble of conformers in solution. An estimated 25–30% of all eukaryotic proteins belong to this class. In vivo, IDPs function under conditions that are highly crowded by other biological macromolecules. Previous research has highlighted that the presence of crowding agents can influence the conformational ensemble sampled by IDPs, resulting in either compaction or expansion. The effects of self-crowding of the disordered protein Histatin 5 has, in an earlier study, been found to have limited influence on the conformational ensemble. In this study, it is examined whether the short chain length of Histatin 5 can explain the limited effects of crowding observed, by introducing (Histatin 5)2, a tandem repeat of Histatin 5. By utilizing small-angle X-ray scattering, it is shown that the conformational ensemble is conserved at high protein concentrations, in resemblance with Histatin 5, although with a lowered protein concentration at which aggregation arises. Under dilute conditions, atomistic molecular dynamics and coarse-grained Monte Carlo simulations, as well as an established scaling law, predicted more extended conformations than indicated by experimental data, hence implying that (Histatin 5)2 does not behave as a self-avoiding random walk.
1. Introduction
Intrinsically disordered proteins (IDPs) lack a unique singular equilibrium structure; instead, they sample a heterogeneous ensemble of conformers in solution. Despite this, IDPs retain a variety of biological functions1 and have been estimated to account for 25–30% of all proteins in eukaryotic organisms.2 Interactions of IDPs can be regulated by altering the affinity of the protein, through, for example, post-translational modifications, or by inducing changes to the conformational ensemble,3,4 where the latter can be introduced by, for example, modifying the sequence length, the properties of the constituent amino acids, the presence of post-translational modifications, and the properties of the buffer such as ionic strength and pH.5,6In vivo, IDPs are often functional in environments that are highly crowded by other biological macromolecules, with cellular protein concentrations reaching as high as 400 mg/mL.7
Previous research has shown that crowding can alter the conformational ensemble of IDPs in several ways.8−11 These effects are non-trivial and may include folding or compaction,12,13 sampling of more extended conformers,14 or maintaining the conformational ensemble found under dilute conditions.15,16 The three categories of outcomes of crowding were denoted “foldable”, “un-foldable”, and “non-foldable” by Fonin et al.8 Hence, through crowding, the conformational ensemble of IDPs can be modified, presenting a possible avenue through which the biological function of IDPs can be regulated. An important factor observed is the excluded volume of both the crowding agent and the IDP.17 Other factors that affect the crowding-induced effect observed include the linear charge density and the charge patterning of the IDP.18
The effects of self-crowding on the IDP Histatin 5 (Hst5) were recently investigated.19 Hst5 is a relatively short (24 amino acids), well-characterized IDP,20−27 that in solution adopts a conformational ensemble that can be described as a self-avoiding random walk. Under increasing self-crowding conditions, Hst5 mainly conserves the conformational ensemble found under dilute conditions, whereas at higher protein concentrations (>50 mg/mL), aggregates form.19 In this study, we postulate that the limited effect of self-crowding observed for Hst5 is due to its relatively short sequence length. We therefore introduce the protein consisting of two Hst5 repeats linked at the C-to-N terminal, (Hst5)2, thus conserving the amino acid composition and the linear charge density of Hst5, making chain length effects the major difference. The chain length of IDPs has been suggested to affect folding energy and to increase alpha-helical content,28,29 potentially changing the crowding-induced effect observed from “non-foldable” to “foldable”. Increasing the chain length by increasing the number of IDP repeats has previously been investigated by computer simulations. Dignon et al. have showed that increasing the number of repeat units of an IDP with propensity to phase separate decreased the critical phase boundaries to lower protein concentrations due to the increased prevalence of inter-chain interactions.30 Pappu et al. applied polymer physics concepts to study aggregation/phase separation, showing that the critical protein concentration decreases with increasing chain length.31
Here, we determine the effects of chain length on both the properties at dilute conditions and at self-crowding conditions for (Hst5)2. A combination of simulations and experimental data from small-angle X-ray scattering (SAXS) and circular dichroism spectroscopy (CD) is used to investigate the conformational ensemble of (Hst5)2 and comparisons are made with Hst5. The SAXS data yield low-resolution structural information on the properties of the conformational ensemble in solution and can be used to verify the accuracy of the models used in simulation. However, increasing the protein concentration of the system studied results in higher computational costs. In order to make the study of crowding by simulations feasible, we utilize a model consisting of implicit solvent and coarse-grained particles. Due to the discrepancies found between the coarse-grained model and experimental data of (Hst5)2, atomistic modeling is implemented to elucidate further information of the conformational ensemble of (Hst5)2 present under dilute conditions.
2. Methods and Theory
2.1. Bioinformatics
Bioinformatic analysis of (Hst5)2 and Hst5 was achieved with the IUPred2A server32 using the long disorder option and the PrDOS server33 with a false positive rate of 5%.
2.2. Sample Preparation
(Hst5)2 was purchased from TAG Copenhagen A/S (Copenhagen, Denmark). The samples were dissolved in Milli-Q water and dialyzed with 16 mm flat-width, 500–1000 Da MWCO membranes (SpectrumLabs, Piraeus, Greece) against Milli-Q water in at least 200 volume ratio under stirring at room temperature, with change of buffer every 4–12 h. A total of four buffer replacements were made. Thereafter, the samples were freeze-dried and stored at −20 °C.
2.3. Small-Angle X-ray Scattering
Prior to measurements, the peptide was dissolved in 20 mM Tris, pH 7 buffer, with a NaCl concentration of either 10 or 150 mM. The protein concentration was determined by using a Thermo Scientific NanoDrop Spectrophotometer with ϵ = 5960 M–1 cm–1, (extinction coefficient estimated via the PROTPARAM tool34) at λ = 280 nm, and MW = 6054.55 Da. For samples with a 150 mM salt concentration, a stock solution measured to have a protein concentration of 47 mg/mL, was used to obtain a concentration series of nominally 50, 25, 12.5, 6.25, 3.125, and 1.56 mg/mL. A higher concentration sample, 116 mg/mL, was prepared separately. For samples with 10 mM salt, a stock solution with a concentration of 26 mg/mL protein was used to prepare a nominal concentration series of 25, 12.5, 6.25, 3.125, and 1.56 mg/mL, and the higher concentration samples of 50 and 134 mg/mL were prepared separately. SAXS data were collected at the B21 beamline at Diamond Light Source (Didcot, England). This beamline uses an Eiger 4M detector, configured to measure a q-range of 0.0032–0.38 Å–1, with the incident beam having energy of 12.4 keV. For samples of ≤50 mg/mL concentration, the BIOSAXS robot was used to flow the sample through the capillary (0.5 mL/min). An exposure time of 1 s was used, and 10 frames were collected per sample, for three different temperatures: 280, 298, and 310 K. Size-exclusion chromatography (SEC) was performed using a Superdex 200 (GE Healthcare), with a flow rate of 0.5 mL/min, and collecting 1 frame/s. The Primus program from the ATSAS package version 2.8.2 was used for analysis.35 Structure factors were obtained by normalization of the spectrum with the lowest protein concentration measured.
2.4. Circular Dichroism Spectroscopy
CD spectra were acquired using a Jasco J-715 spectropolarimeter (JASCO Corporation, Tokyo, Japan) with a model PTC-348WI Peltier-type temperature control system. Measurements were made in the wavelength range of 185–260 nm, with a data pitch of 0.1 nm, a scanning speed of 20 nm/min, a response time of 2 s, a bandwidth of 2.0 nm, and a Hellma Analytics quartz cell with a length of 0.1 cm. For each sample, five accumulations were collected at 298 K. A dialyzed protein solution was used and filtered with a 0.22 μm Millex-GV filter (Merck Millipore Ltd., Tullagreen, Ireland). The protein solution was mixed with filtered Tris buffer solution, and Milli-Q water, to achieve a 20 mM Tris protein stock solution with a protein concentration of 1.3 mg/mL. The pure buffer solution was also filtered before measurement. The protein stock solution was diluted to yield 0.6, 0.2, 0.13, and 0.07 mg/mL. The corresponding CD spectra were found to be overlapping, with solutions of lower protein concentrations being able to probe shorter wavelengths, at the expense of signal-to-noise ratio. From visual inspection, the spectrum acquired for 0.13 mg/mL was used for analysis. All spectra are supplied in Figure SI-4. The spectra were analyzed with BESTSEL36 in the 200–250 nm wavelength range. Data for Hst5 were measured using 10 mM NaF and 20 mM Tris buffer, at a protein concentration of 0.1 mg/mL. All protein CD spectra were corrected by subtraction of a reference buffer measurement.
2.5. Coarse-Grained Monte Carlo Simulations
Simulations were performed with a coarse-grained model37 developed in the Skepö research group, previously tested for several IDPs.38 In the model, each amino acid is represented by a hard sphere (a “bead”), which is assigned a charge of −1, or +1, or being neutral, depending on the amino acid. End termini are represented as beads to include their charges in the model. The electrostatic interactions are treated with an extended Debye–Hückel potential, given by
| 1 |
where e is the elementary charge, Z is the charge of a given amino acid, κ is the inverse Debye screening length, rij is the distance between any two particles i and j, Ri, Rj are the radii of the hard sphere beads for particles i, j (in this model, all beads have the same radius of 2 Å), ϵ0 is the vacuum permittivity, ϵr is the dielectric constant for water. The counterions are treated explicitly, whereas both the solvent and the salt are treated implicitly, the solvent via the dielectric constant, and the salt via the inverse Debye screening length, defined as
| 2 |
where kB is the Boltzmann constant, T is the temperature, NA is the Avogadro number, and I is the ionic strength. The bonds between the beads are represented by harmonic springs, according to
| 3 |
where kbond is the spring force constant set to 0.4 N/m, r0 is the equilibrium distance between bonded particles set to 4.1 Å, and ri, i + 1 is the distance between two connected beads, where N is the number of monomers in the chain. A short-ranged attraction between particles accounts for van der Waals forces, given by
| 4 |
with ϵ set to 0.6 × 10⁴ kJ Å6/mol to achieve an attractive potential of 0.6 kT at closest contact. This potential applies to all beads. Further description of the model is found in Cragnell et al.37 and Fagerberg et al.19 The simulations were performed in the NVT ensemble, with constant number of particles, volume, and temperature, utilizing the MOLSIM simulation package, version 6.4.7.39 According to the choice of protein concentration, a number of chains and counterions were randomly placed in a cubic simulation box with a side length of 270 Å. For a protein concentration of 1.56 mg/mL, this corresponded to three chains in the box, while 50 mg/mL corresponded to 98 chains (the series is not perfect multiples due to round-off). The counterion concentration was not included in the ionic strength. The equilibration run corresponded to at least 100,000 steps, followed by a production run of 1,000,000 MC cycles. Other settings are set as same as in Fagerberg et al.19 For quantitative comparison of scattering curves, a modified Pearson χ2 value was calculated as
| 5 |
where N is the total number of q-values, Ei is the experimental intensity at q-value i, and Si is the simulation intensity at q-value i after scaling the simulation data to experimental values.
2.6. Atomistic Molecular Dynamics Simulations
Atomistic molecular dynamics (MD) simulations were carried out using the GROMACS software package,40−43 version 5.04 and 2016.3, with the AMBER99SBN-ILDN force field (a modified version of the AMBER99SB-ILDN force field,44 for use with TIP4P-D, as described by Henriques et al.21) with the TIP4P-D water model45 where London dispersion interactions have been optimized.46 (Hst5)2 was built as a linear molecule in PyMOL (version 1.8, Schrödinger, LLC) and processed by the GROMACS pdb2gmx tool. The protein was implemented into a dodecahedron box with a minimum of 1 nm distance between the peptide and the box, and periodic boundary conditions were applied in all directions. A total of 147,745 water molecules were used for solvation, where 10 of these were replaced with Cl– ions to neutralize the system. No other ions or buffer molecules were included. Electrostatic interactions were determined with particle mesh Ewald47 with cubic interpolation and a Fourier spacing of 0.16. Non-bonded interactions were handled with a Verlet cutoff list, whereas short-range interactions were determined using a non-bonded pair-list with all cutoffs set to 1 nm, updating the list every 100 fs. Long-ranged dispersion corrections were applied to energy and pressure. Protein and non-protein species were coupled separately to the velocity-rescale thermostat48 with a reference temperature of 300 K and a relaxation time of 0.1 ps. An isotropic Parrinello–Rahman barostat49 was coupled with a reference pressure of 1 bar, relaxing every 2 ps with isothermal compressibility of 4.5 × 10⁻⁵ bar–1. All bond lengths were constrained with the LINCS algorithm.50 The steepest descent algorithm was used for energy minimization. Other values were left at default values, specified by the software. A stability equilibration was performed with a 2 ns NVT simulation followed by a 2 ns NPT (isothermal–isobaric ensemble, with constant number of particles, pressure, and temperature) simulation. Replicates were differentiated at the first NVT simulation. The first replicate was run for 1100 ns, the other four ran for 1000 ns each.
2.6.1. Analysis
From the atomistic trajectories, SAXS curves were generated using the software FOXS.51 CD spectra were computed from the atomistic trajectories using SESCA, version 0.93,52 applying basis sets HBSS-3, indicated as high-accuracy best of the non-mixed basis sets for a flexible protein, “mixed” basis set DS-dTSC3, which includes side-chain corrections, and indicated to be well-performing for a flexible protein, and DS-dT, which is the default basis set. This was also done using the webserver PDBMD2CD,53 whereas the secondary structure was computed with DSSP.54 Construction of free energy surfaces was performed using the principal components analysis of Campos et al.,55 with the modification used by Henriques et al.20
3. Results and Discussion
3.1. Bioinformatic Analysis
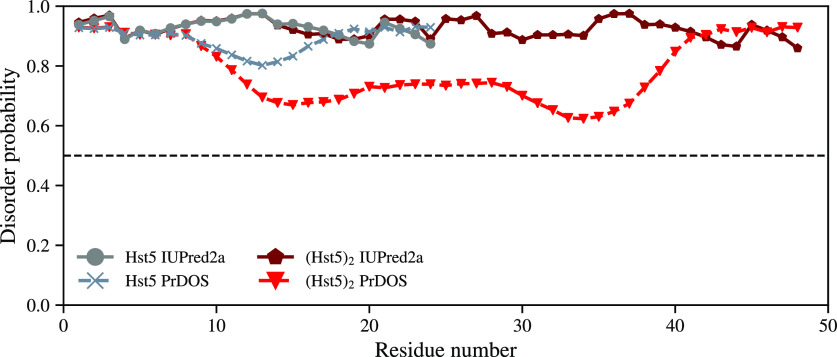
In order to determine the effect of increased chain length on the propensity of secondary structure formation, bioinformatic analysis of the (Hst5)2 sequence was performed by applying the PrDOS33 and IUPred2A32 algorithms. The results from these analyses are compared with those obtained for the Hst5 sequence in Figure 1. As for Hst5, both algorithms predict a lack of structure along the full (Hst5)2 sequence; though, PrDOS indicates a lower disorder probability for the mid-segment, almost as low as 0.6 for some residues. Although the disorder probability is decreased, it is located above the disorder threshold of 0.5. IUPred2A predicts a similar magnitude of disorder probability for both the Hst5 and (Hst5)2 sequences.
Figure 1.
Disorder probability of the Hst5 and (Hst5)2 sequences determined using the PrDOS and IUPred2A algorithms. The dashed line is the threshold of 0.5, if <0.5, the residue is predicted to be ordered.
3.2. Experimental Results of Hst5 and (Hst5)2 at Low Protein Concentrations
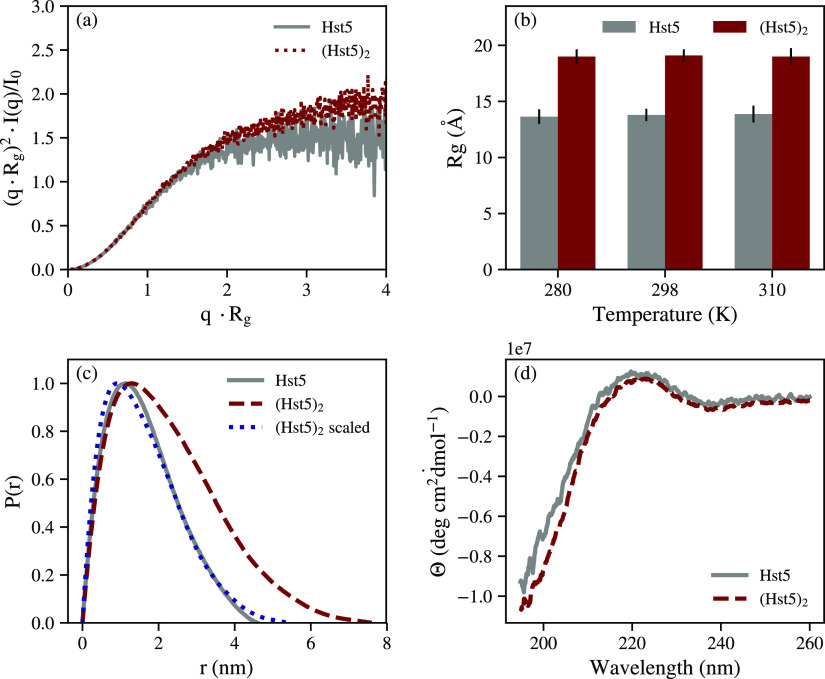
The form factor of (Hst5)2 was determined by SAXS measurements at low protein concentrations, in buffer supplemented with 150 mM NaCl. Monomericity was concluded from the elution profile of SEC, see Figure SI-1. Figure 2a shows the experimentally determined Kratky plot of (Hst5)2 compared with the previously obtained Kratky plot of Hst5 (data from Fagerberg et al.19). As for Hst5, a characteristic IDP behavior of (Hst5)2 is shown; thus, the lack of a well-defined maximum and an increasing intensity at higher values of q. SAXS measurements were performed at varying temperatures, and the radius of gyration (Rg) was extracted by linear fitting of the Guinier region. In the temperature range measured, the Rg determined for (Hst5)2 is invariant with temperature, as seen in Figure 2b, which is in line with measurements of Hst5 by Jephthah et al.56 It has been shown that the Rg of Hst5 is accurately predicted by the Flory equation with an exponent of 0.59, applicable for self-avoiding random walks.38 As expected, from the doubling of chain length, the experimentally determined Rg of (Hst5)2 is larger compared to Hst5. Application of the Flory equation with the exponent of 0.59 yields Rg values of 13.89 and 20.97 Å for Hst5 and (Hst5)2, respectively. For Hst5, this prediction is accurate compared to the experimental result of 13.79 Å, whereas for (Hst5)2, the prediction proves to be less accurate compared to the experimental value of 18.7 Å, indicating that (Hst5)2 deviates from the self-avoiding random walk behavior observed for Hst5. Radial distribution functions for both Hst5 and (Hst5)2, determined by indirect Fourier transform of the scattering data, are shown in Figure 2c. Both Hst5 and (Hst5)2 show a characteristic IDP behavior of a maximum followed by a gentle decay. Scaling of the (Hst5)2 distribution function by the Rg ratio of Hst5 and (Hst5)2 shows a similar distribution function to that obtained for Hst5, although with a slightly higher Dmax as visible in Figure 2c. In order to determine whether the discrepancies between the solution properties of Hst5 and (Hst5)2 were caused by the presence of secondary structure elements, CD spectra of both Hst5 and (Hst5)2 were collected. The results, shown in Figure 2d reveal similar spectra for both (Hst5)2 and Hst5. Combined, the results show that both proteins behave as IDPs in solution. BESTSEL36 was used to gauge the amount of various secondary structure elements from the CD spectra, and some transient secondary structure was found. Fitting yielded a root-mean-square deviation (RMSD, as defined by BESTSEL) of 0.1075, and there were predictions of 54% “Others” (coil/irregular, β bridges, bends, and non-α helices), 18% turn, and 28% antiparallel structure. Similar predictions were obtained with measurements made at 0.2, 0.6, and 1.3 mg/mL (main analysis performed with 0.13 mg/mL). Heating the protein to 353 K, and reverse, did not affect the spectrum, indicating that no thermally irreversible structures are present (Figure SI-4, left panel). As stated above, from the Rg values obtained, it is inferred that (Hst5)2 does not follow the scaling laws expected for a self-avoiding random walk, which Hst5 does. The CD data indicate that the observed difference between Hst5 and (Hst5)2 is not due to an increase in any specific secondary structure elements.
Figure 2.
(a) Normalized experimental Kratky plot of the form factors of Hst5 and (Hst5)2, collected at 298 K in 150 mM NaCl. (b) Temperature variation of the experimentally determined radius of gyration of Hst5 and (Hst5)2, shown for the indicated temperatures in 150 mM NaCl. (c) Radial distribution function determined for Hst5 and (Hst5)2 in 150 mM NaCl. (Hst5)2 scaled represents the radial distribution function of (Hst5)2 scaled by the difference in Rg between Hst5 and (Hst5)2. (d) Circular dichroism spectra of Hst5 and (Hst5)2 collected in 10 mM salt at 298 K, presented as the mean residual ellipticity against wavelength.
3.3. Coarse-Grained Monte Carlo Simulations of Hst5 and (Hst5)2 at Low Protein Concentrations
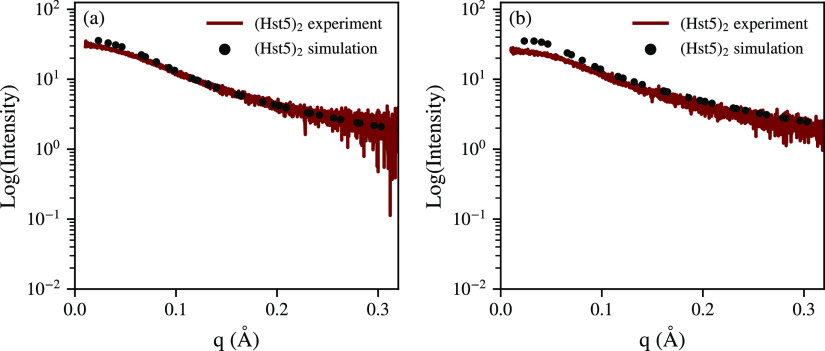
The SAXS and CD data under dilute conditions confirm that (Hst5)2 retains the disordered nature of Hst5, despite the doubling in sequence length. The coarse-grained model has previously been shown to accurately capture the properties of disordered proteins, including Hst5. In order to determine whether length effects influence the accuracy of the coarse-grained model, simulations at low protein concentrations of (Hst5)2 were performed. The experimentally determined form factor of (Hst5)2 is compared in Figure 3 with the scattering curve determined by the Monte Carlo simulations, under both 150 mM NaCl and 10 mM NaCl salt conditions. For the former, there is a slight discrepancy between the experiment and the simulation at low q values, see Figure 3a, whereas for the latter, a greater discrepancy between the simulation and the experiment is visible, as shown in Figure 3b.
Figure 3.
Comparison between the experimental (dark red) and the computational scattering curve determined by the coarse-grained model (black dots) of (Hst5)2 at 298 K for (a) 150 mM NaCl and (b) 10 mM NaCl.
The Rg obtained from the Monte Carlo simulations and the experimental results are given in Table 1. Some variation is observed between experimental measurements of Hst5; although, by considering the error, the data agrees well with the Rg determined by the simulations. For (Hst5)2, the model yields a Rg of 21 Å, compared with 18.7 Å obtained by experiment; hence, a deviation by more than 10%, indicating less good agreement between the model and experiment. The fractal dimension (Dm) of (Hst5)2 coincides well, 1.67 and 1.68; thus, size is the main source of experiment and simulation disagreement.
Table 1. Rg Determined by Different Means and Dm for Hst5 with Data from Different References and (Hst5)2, Along with Monte Carlo Simulation Predictions and 150 mM NaCla.
| condition | Rg, Guinier (qRg < 0.8) [Å] | Rg, P(r) | Dm |
|---|---|---|---|
| Hst5 (ref Cragnell) | 13.3 ± 0.3 | 13.8 ± 0.04 | 1.45 ± 0.1 |
| Hst5 (ref Fagerberg) | 12.6 ± 0.4 | 12.5 ± 0.01 | 1.74 ± 0.2 |
| (Hst5)2 | 18.7 ± 0.3 | 18.5 ± 0.1 | 1.67 ± 0.1 |
| Hst5, model | 13.8 | 13.8 | 1.73 |
| (Hst5)2, model | 21.0 | 21.0 | 1.68 |
For the latter, Rg is determined directly from the simulation, not via the generated SAXS curve. Cragnell et al.37 used a protein concentration of 0.25 mg/mL and a salt concentration of 140 mM, whereas the corresponding numbers for Fagerberg et al.19 were 6.25 mg/mL and 150 mM. (Hst5)2 data from SEC measurements. All measurements and simulations reported were performed at 298 K.
The Monte Carlo simulations follow the general scaling law describing self-avoiding random walk chains, Rg = a*Nb, with a = 2.13 and b = 0.59. Although, as previously mentioned, (Hst5)2 does not follow the general scaling law developed for IDPs with self-avoiding random walk behavior, and hence, the coarse-grained model does not provide an accurate result. Previous works have indicated the model to be accurate within an error margin of 10%, even for chains as long as 258 amino acids, for fully intrinsically disordered proteins.38
Considering intra-chain interactions, there are similarities between Hst5 and (Hst5)2, as shown in the contact map generated by the the Monte Carlo simulations (Figure SI-5). Both chains exhibit local interactions between the 11th and 18th residue and at both end termini, with the C terminal being more prominent. Note that the explicit end terminals are included, giving a total of 50 beads (“residues”), while the actual (experimental) number of residues is 48 for (Hst5)2. (Hst5)2 has six regions of increased intra-chain interaction, seemingly symmetric in that the second half of the chain is a mirror image of the first half in the contact map. Reviewing the exact positions (maximum contact found between residues 2–6, 13–17, 23–26, 26–30, 37–41, and 46–50), it is found not to be the case—for example, for a mirror image, the region with maximum 13–17 would need to have a corresponding region with maximum 33–37, but the closest match is at a higher index of 37–41. (Hst5)2 consists of a C-to-N-terminal fusion of Hst5 and is therefore not symmetric in a “mirror-image” sense in terms of sequence. Hence, the lack of symmetry in the contact map is not unexpected; though, it could have been expected that local regions of interactions would be in corresponding positions for the first and second half of (Hst5)2. This is true for regions with maxima in 13–17 and 37–41, but not for the two regions in the mid-segment. The mid-part constitute a sequence (GYDS) not found in Hst5, which may explain the difference in contact maps between Hst5 and (Hst5)2. Notably, the longer chain length of (Hst5)2 might allow for an increase in non-local intra-chain interactions, but no such contacts are visible at the resolution presented in Figure SI-5.
For low ionic strength, i.e., 10 mM NaCl, as seen in Figure 3b, the experimental SAXS data indicate inter-particle interactions at low protein concentrations. Considering possible particle–particle interactions, application of the Guinier approximation gives Rg values of 15.3 and 9.6 Å for (Hst5)2, and Hst5, respectively, whereas the Monte Carlo simulations predict Rg values of 23.2 and 14.0 Å for (Hst5)2 and Hst5 (using data from Fagerberg et al.19), respectively. Despite the large numerical disparity between the experiment and simulation, the overall fits may seem good visually, at least for Hst5. However, close inspection of the experimental data at the lowest protein concentration and at low ionic strength does not give a clear indication of inter-particle effects.
3.4. Concentrated Protein Solutions Investigated by SAXS
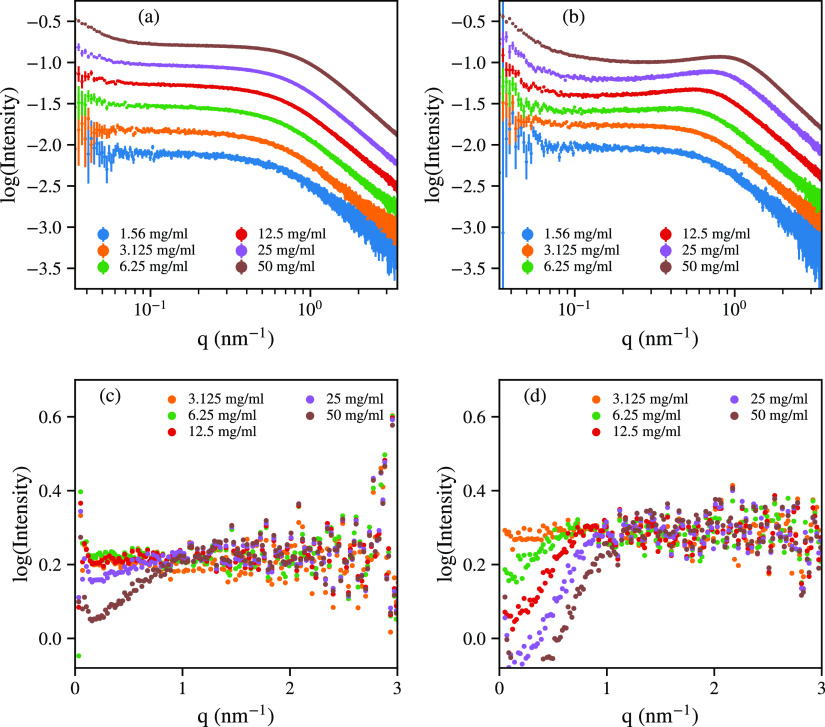
To determine whether the increased length of (Hst5)2 modifies the solution behavior under crowded conditions, SAXS data were collected at increasing protein concentrations, see Figure 4. At 150 mM salt, evidence of aggregation is present at protein concentrations of ≥25 mg/mL, as observed by an upturn in the Guinier region at low q values. At protein concentrations of ≈100 mg/mL, non-solution behavior is observed, as seen in Figure SI-3, which is out of scope for this article. For protein concentrations of ≤25 mg/mL, there is a linear trend in I(0), indicating monomeric conditions, as shown in Figure SI-2. A correlation peak is found at q ≈ 1 nm–1, reflecting observed inter-particle repulsion at ≥25 mg/mL in structure factors determined from the experimental data (Figure 4c). At 10 mM salt, aggregation is present at 6.25 mg/mL, as shown in Figure 4b. This coincides with inter-particle repulsion at lower protein concentrations compared to high salt, whereas the stronger inter-particle repulsion observed at lower ionic strengths is caused by the decreased screening length.
Figure 4.
Experimental scattering curves of (Hst5)2 at the protein concentrations indicated, in (a) 150 mM NaCl and (b) 10 mM NaCl, respectively. Structure factors of (Hst5)2 in (c) 150 mM NaCl and (d) 10 mM NaCl, respectively.
Previously, it was observed that Hst5, at high ionic strength, shows signs of aggregation at protein concentrations above 50 mg/mL, at least double the concentration observed for (Hst5)2. The increased tendency for inter-protein interactions of repeat sequences has previously been explored by Dignon et al., in the case where inter-protein interactions result in liquid–liquid phase separation.30 An increase in chain length resulted in a decrease in the critical protein concentration at which phase separation was initiated. This effect can be described by Flory–Huggins theory and is caused by a decrease in the mixing entropy per segment of the longer chains. Although the phase transitions are different, i.e., phase separation and protein aggregation, the similar decrease in the critical protein concentration is probably caused by the same effect as both are driven by inter-protein interactions.
3.4.1. Temperature Effect
At a protein concentration of 50 mg/mL and in 150 mM salt, a minor temperature effect is observed, in contrast with the invariance of the results with differing temperature at lower protein concentrations, see left panel of Figure SI-10. This may stem from the presence of aggregation. The larger gap between 280 K and higher temperatures is also observed at 25 mg/mL, whereas at 10 mM, this trend is not as visible, although indicated, see Figure SI-6.
3.5. Monte Carlo Simulations at Concentrated Conditions
3.5.1. High Salt Conditions
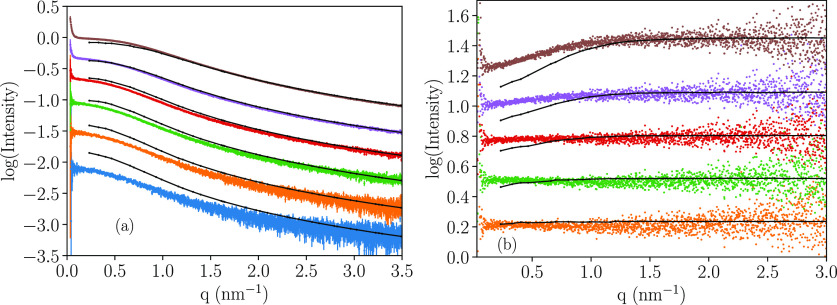
At 150 mM NaCl, the agreement between experiments and simulations increases with increasing protein concentration, ≤25 mg/mL, as seen in Figure 5 and by the χ2 for the 150 mM salt data, found in Table SI-3. Note that the concentrations of 1.56 and 3.125 mg/mL possess higher χ2 values than SEC data, which is attributed to higher noise.
Figure 5.
Experimental and simulated SAXS data as a function of increasing protein concentration, in 20 mM Tris buffer at 298 K using 150 mM NaCl, where (a) shows the intensity spectra and (b) shows the corresponding structure factors. Color code: blue: 1.56 mg/mL, orange: 3.125 mg/mL, green: 6.25 mg/mL, red: 12.5 mg/mL, purple: 25 mg/mL, brown: 50 mg/mL, and cyan: 100 mg/mL. Black indicates corresponding simulation data.
By comparison of the structure factors in Figure 5b, it is shown that the coarse-grained model exaggerates the repulsive interactions at higher protein concentrations, compensating for the initially not correctly predicted large conformers, thereby improving the apparent fit at low q values. Though, experimental data also show repulsive interactions, as visible in Figure 4c. For a longer protein chain, a higher degree of entanglement is expected, which should result in an increase in the repulsive interactions, in agreement with both experimental and simulation data. Since the Monte Carlo simulations use a coarse-grained model, omitting internal degrees of freedom, a more realistic and efficient packing cannot be achieved at the most crowded conditions; thus, the excessive repulsion at higher protein concentrations is not surprising. However, in terms of Rg, the structure is conserved, see Table SI-2.
In the Monte Carlo simulations, the temperature effect is very small, as shown in Table SI-2, where the difference in Rg between the highest and lowest temperature for any protein concentration does not exceed 0.5 Å. This is in line with experimental data, showing only minor/negligible temperature dependence unless there is aggregation.
3.5.2. Low Salt Conditions
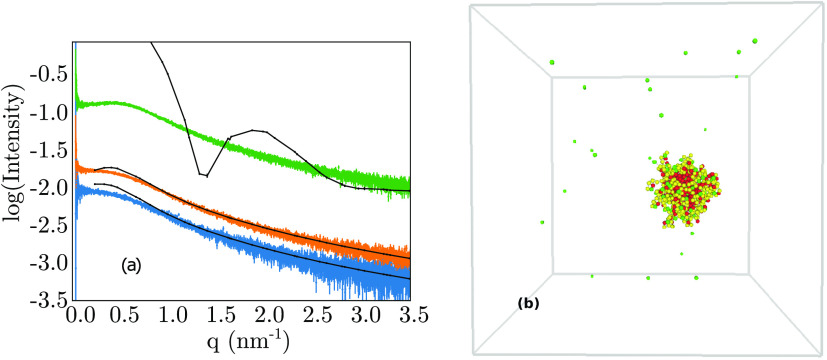
At 10 mM NaCl and protein concentrations of ≥6.25 mg/mL, there is a clear breakdown of the model for (Hst5)2, where the model predicts aggregation, which is not observed in the experiments, see Figure 6. For clarity, only one protein concentration of 6.25 mg/mL is shown in Figure 6, but the same behavior, with aggregated structures, is also displayed at higher protein concentrations.
Figure 6.
(a) Experimental and simulated SAXS spectra as a function of increasing protein concentration, in 20 mM Tris buffer at 298 K using 10 mM salt. Color code: blue: 1.56 mg/mL, orange: 3.125 mg/mL, and green: 6.25 mg/mL. Black indicates corresponding simulation data. (b) Snapshot from simulation of a 6.25 mg/mL protein concentration at 10 mM NaCl, showing aggregation.
The simulation corresponding to 6.25 mg/mL protein concentration, 10 mM salt concentration, and 298 K was repeated with a larger box size of 400 Å (standard box size of 270 Å), which also resulted in the formation of larger aggregates. Notably, with both box sizes, all proteins aggregated into a single sphere, as depicted in Figure 6b. It can be postulated that an even larger box size results in the formation of an even larger aggregate, which would cause the peak in the SAXS spectra to migrate to lower q values. Experimentally, aggregation is observed at higher protein concentrations, at 12.5 mg/mL, in 10 mM salt, although the simulation predicts aggregation at a concentration of 6.25 mg/mL, indicating excessive attractive interactions between protein chains in the model.
At 10 mM salt, the attractive inter-chain interactions are too strong in the coarse-grained model. This is an electrostatic effect as the same dramatic attractive interactions are not observed at 150 mM salt concentrations. Thus, the model exaggerates the electrostatic contribution. One explanation for this behavior is that the ions of the Tris buffer add to the electrostatic screening, resulting in an increase in the effective screening length; hence, experimentally, aggregates form at lower salt concentrations than investigated here. To investigate if this hypothesis has merit, Monte Carlo simulations at different salt concentrations were performed. At a protein concentration of 12.5 mg/mL and a temperature of 298 K, no aggregation was visible at a salt concentration between 15 and 20 mM. Experimentally, the added salt concentration was 10 mM and the buffer concentration was 20 mM; hence, if this hypothesis was true, the contribution to the ionic strength by the buffer ions would be at least 5–10 mM. According to Roberts et al.,57 the added ionic strength of buffer ions varies, with citrate contributing 0.4 mM of ionic strength per 1 mM of buffer at low concentrations, whereas phosphate buffer has a 1:1 ratio of ionic strength per mM buffer added, at low salt concentrations. Furthermore, no distinction between the effects of Tris buffer and phosphate buffer was found, justifying our rectification of decreasing the screening length due to added ionic strength of the Tris buffer. At higher salt concentrations, this effect is not as prominent because the Debye–Hückel model used is an exponentially decaying function in terms of screening length. Therefore, an increase in ionic strength has a more pronounced effect at low salt concentrations.
3.6. Atomistic Simulations
A possible explanation for the discrepancy between the experimental Rg and the Rg determined by both the Monte Carlo simulations and the Flory scaling law for (Hst5)2 may be due the presence of transient secondary structure elements in the (Hst5)2 chain. Atomistic simulations were performed to determine if (Hst5)2 exhibit such conformers or behavior, which the coarse-grained model cannot account for.
Convergence of the atomistic simulation was determined by inspection of the end-to-end distances (Ree), Rg, and the secondary structure content of the trajectories. These were found to be similar across replicates, see Figures SI-7, SI-8, and SI-9. The first 100 ns of each simulation replicate was treated as equilibration and removed for the consequent trajectory analysis, which was based on the evolution of Rg and its autocorrelation (Figure SI-10). It should be noted that Henriques et al.(20) reported secondary structure properties to converge slower than other properties; thus, these may not be as converged as Rg. The trajectories of the replicates were concatenated prior to comparison with experimental data.
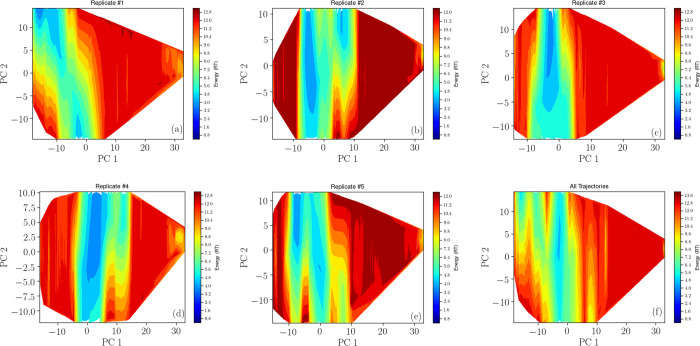
Free energy surfaces, spanned by the first two principal components, in average encompassing 43% of all variance, were determined for all trajectories concatenated, and the separate replicates were projected onto these, shown in Figure 7. Most of the free energy surfaces feature a valley of low energy structures along the second principal component and low sampling at higher values of the first principal component. Replicate #1 partly samples a clearer singular basin. This is in line with the average Rg computed for the separate replicates, being 21.0 ± 4.0, 23.8 ± 4.5, 24.3 ± 4.7, 24.6 ± 4.1, and 23.1 ± 3.7 Å (the latter number after the average is the standard deviation), where the Rg of replicate #1 is indicated as distinct from the other replicates, which highlights the importance of using several replicates. Error on these estimates were found through block-averaging, being 2.0, 2.0, 4.2, 0.8, and 0.7 Å respectively, with a global error of 1.8 Å.
Figure 7.
Free energy surfaces of the five replicates from the atomistic simulation (a)–(e), where (f) gives the full trajectory
3.6.1. Comparison between Atomistic Molecular Dynamics and Coarse-grained Monte Carlo Simulations
The Rg distribution determined from the atomistic simulation shows Gaussian behavior in correspondence to the distribution found by the Monte Carlo simulation (Figure SI-11), where the Rg obtained from the atomistic simulation is in qualitative agreement with the coarse-grained model, at low salt conditions, see Table 2. It is however noted that Rieloff et al.58 showed that atomistic simulations are not able to distinguish between salt-free and high-salt conditions. Thus, it is valid to compare the atomistic simulations with the high-salt experimental results. This method, of comparing salt-free atomistic simulations with high-salt experimental results, has previously been validated for the Hst5 chain.20,21 The contact maps from both the Monte Carlo and the atomistic molecular dynamics simulations are similar (Figure SI-12), where both display local interactions at the C-terminal end of the chain, which can be explained by the interaction between the negative charge of the C terminal and the positively charged arginine at residue 46, two residues apart. For both models, these interactions remain local. Thus, the atomistic simulation share features with the coarse-grained simulation.
Table 2. Properties Determined from Atomistic Simulation: Total Average Secondary Structure Content in Number of Residues with Standard Deviation,a Average Rg, Average Ree Distanceb.
| coil (# residues) | turn (# residues) | bend (# residues) | Rg (Å) | Ree (Å) |
|---|---|---|---|---|
| 35 ± 4(73%) | 4 ± 2(8%) | 9 ± 3(19%) | 23.3 ± 4.4 | 57.0 ± 19.4 |
Round to nearest integer.
Structures with an average of less than 1 are not given.
3.6.2. Comparison of Atomistic Simulation with SAXS Data
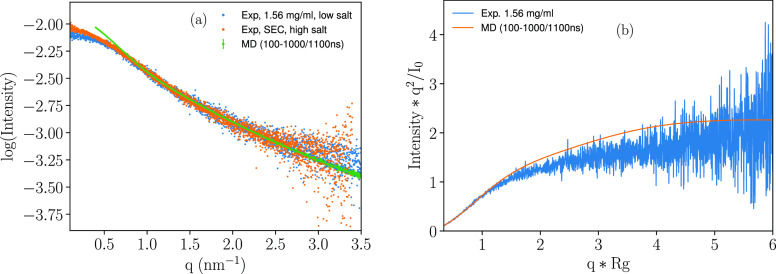
Figure 8a shows the scattering curve calculated using FOXS from the trajectory produced by the atomistic simulation, compared with the experimental data, where a poor agreement is displayed at low q values, caused by the discrepancy between the experimental Rg and that determined by the simulation. We acknowledge that the previously stated motivation for comparing high salt experimental data with low salt simulation data is indicative of the inability of the simulation to accurately capture ionic strength effects. Considering Rg from both experiment and simulation, a dimensionless Kratky plot is produced (Figure 8b). This also seems to indicate a minor effect of the shape.
Figure 8.
(a) Comparison of SAXS scattering curve obtained from atomistic simulation and experimental data, at 10 mM NaCl concentration and a temperature of 298 K, and (b) the corresponding dimensionless Kratky plot.
3.6.3. Secondary Structure Analysis
The secondary structure content of the atomistic simulation was estimated with DSSP.54 These are displayed in Table 2, along with parameters Rg and Ree.
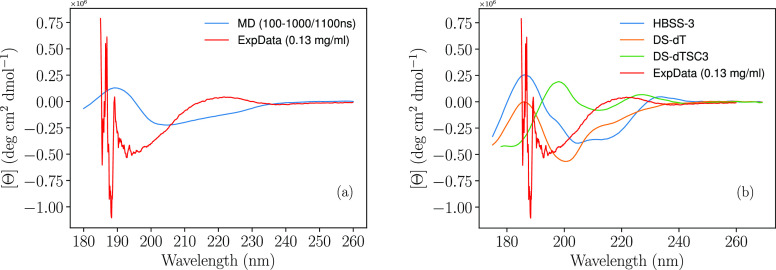
Comparing the numbers in Table 2 with the BESTSEL predictions (54% coil/irregular, 18% turn, and 28% antiparallel), the simulation proposes less secondary structure. Notably, BESTSEL maps DSSP “bend” structures to “Others”, which would suggest a discrepancy between the amount of irregular/coil structures and turn β structure content predicted by simulation and the BESTSEL interpretation of the CD data. However, even if the SAXS data show the simulation to be flawed (and considering convergence to possibly not be as clear as for Rg), the BESTSEL algorithm may still not be the best interpretation of the data. As an alternative, there are several algorithms available to determine CD spectra from simulation trajectories, enabling a comparison with experimental CD spectra. Here, two different algorithms were applied: SESCA52 and PDBMD2CD,53 see Figure 9.
Figure 9.
Comparison of CD data with atomistic simulation data, using different algorithms. Experimental data at 0.13 mg/mL, no salt added, at a temperature of 298 K, with (a) PDBMD2CD and (b) SESCA.
From Figure 9, the algorithms (considering different SESCA basis sets as independent algorithms) are highly heterogeneous, and in line with BESTSEL, all show poor experimental agreement, possibly a consequence of an inadequate force field. The proposition of force field error has further merit considering the poor fit of the I(q) SAXS data, but there is still some similarities in the Kratky plot, after adjusting for error in size prediction. Hence, the overall error cannot be fully attributed to force field error, particularly since predicted CD spectra by different algorithms are disparate. The vastly different results obtained by the CD algorithms suggest that further evaluation, and possibly development, of these algorithms is necessary to gain general confidence in their accuracy. This may be particularly challenging for IDPs that have a transient secondary structure elements.
4. Conclusions
Considering (Hst5)2 at high salt conditions, there is no visible effect of crowding below 25 mg/mL protein concentration, whereafter aggregation occurs. This is in correspondence with earlier results for Hst5; though, the protein concentration for aggregation is lower for (Hst5)2. Hence, the increase in chain length does not change the categorization of the protein, in terms of the “crowding-response” categories proposed by Fonin et al.8 Estimation of the chain size, in terms of Rg, suggests (Hst5)2 to deviate from scaling laws derived for self-avoiding random walks. Coarse-grained Monte Carlo simulations were not in agreement with experimental results at low protein concentrations and high salt concentrations; although, the accuracy of the model improved with increasing protein concentration, attributed to exaggerated interactions in the coarse-grained model. At low salt concentrations, the coarse-grained model performed poorly, possibly due to buffer ions contributing towards the screening effect, which was not accounted for in the model. Using more detailed, atomistic modeling did not yield results in agreement with experimental data, neither in terms of Rg nor in terms of the secondary structure.
Acknowledgments
We acknowledge financial support from the Crafoord Foundation, Sweden. Computer resources for the simulations were provided by the Swedish National Infrastructure for Computing (SNIC) at the Center for Scientific and Technical Computing at Lund University (LUNARC). We acknowledge Diamond Light Source for time on Beamline B21 under proposal SM23750.
Supporting Information Available
The Supporting Information is available free of charge at https://pubs.acs.org/doi/10.1021/acs.jpcb.0c09635.
Figures include CD spectra, SAXS curves, contact maps from simulations, plot of I(0) for different protein concentrations, and plots over time evolution of simulation observables and tables include experimentally computed radii of gyration, simulation predicted radii of gyration, χ2 values for fits of simulated spectra to experimental spectra (PDF)
The authors declare no competing financial interest.
Supplementary Material
References
- Dyson H. J.; Wright P. E. Intrinsically unstructured proteins and their functions. Nat. Rev. Mol. Cell Biol. 2005, 6, 197–208. 10.1038/nrm1589. [DOI] [PubMed] [Google Scholar]
- Uversky V. N.; Dunker A. K. Understanding protein non-folding. Biochim. Biophys. Acta, Proteins Proteomics 2010, 1804, 1231–1264. 10.1016/j.bbapap.2010.01.017. [DOI] [PMC free article] [PubMed] [Google Scholar]
- Choi U. B.; Sanabria H.; Smirnova T.; Bowen M. E.; Weninger K. R. Spontaneous switching among conformational ensembles in intrinsically disordered proteins. Biomolecules 2019, 9, 114. 10.3390/biom9030114. [DOI] [PMC free article] [PubMed] [Google Scholar]
- Bah A.; Forman-Kay J. D. Modulation of intrinsically disordered protein function by post-translational modifications. J. Biol. Chem. 2016, 291, 6696–6705. 10.1074/jbc.R115.695056. [DOI] [PMC free article] [PubMed] [Google Scholar]
- Mohan A.; Uversky V. N.; Radivojac P. Influence of sequence changes and environment on intrinsically disordered proteins. PLoS Comput. Biol. 2009, 5, e1000497 10.1371/journal.pcbi.1000497. [DOI] [PMC free article] [PubMed] [Google Scholar]
- Müller-Späth S.; Soranno A.; Hirschfeld V.; Hofmann H.; Rüegger S.; Reymond L.; Nettels D.; Schuler B. Charge interactions can dominate the dimensions of intrinsically disordered proteins. Proc. Natl. Acad. Sci. U. S. A. 2010, 107, 14609–14614. 10.1073/pnas.1001743107. [DOI] [PMC free article] [PubMed] [Google Scholar]
- Zimmerman S. B.; Trach S. O. Estimation of Macromolecule Concentrations and Excluded volume effects for the Cytoplasm of Escherichia coli. J. Mol. Biol. 1991, 222, 599–620. 10.1016/0022-2836(91)90499-V. [DOI] [PubMed] [Google Scholar]
- Fonin A. V.; Darling A. L.; Kuznetsova I. M.; Turoverov K. K.; Uversky V. N. Intrinsically disordered proteins in crowded milieu: when chaos prevails within the cellular gumbo. Cell. Mol. Life Sci. 2018, 75, 3907–3929. 10.1007/s00018-018-2894-9. [DOI] [PMC free article] [PubMed] [Google Scholar]
- Banks A.; Qin S.; Weiss K. L.; Stanley C. B.; Zhou H.-X. Intrinsically Disordered Protein Exhibits Both Compaction and Expansion under Macromolecular Crowding. Biophys. J. 2018, 114, 1067–1079. 10.1016/j.bpj.2018.01.011. [DOI] [PMC free article] [PubMed] [Google Scholar]
- Cino E. A.; Karttunen M.; Choy W.-Y. Effects of Molecular Crowding on the Dynamics of Intrinsically Disordered Proteins. PLoS One 2012, 7, e49876. 10.1371/journal.pone.0049876. [DOI] [PMC free article] [PubMed] [Google Scholar]
- Brangwynne C. P.; Tompa P.; Pappu R. V. Polymer physics of intracellular phase transitions. Nat. Phys. 2015, 11, 899–904. 10.1038/nphys3532. [DOI] [Google Scholar]
- Johansen D.; Jeffries C. M. J.; Hammouda B.; Trewhella J.; Goldenberg D. P. Effects of macromolecular crowding on an intrinsically disordered protein characterized by small-angle neutron scattering with contrast matching. Biophys. J. 2011, 100, 1120–1128. 10.1016/j.bpj.2011.01.020. [DOI] [PMC free article] [PubMed] [Google Scholar]
- Szasz C.; Alexa A.; Toth K.; Rakacs M.; Langowski J.; Tompa P. Protein Disorder Prevails under Crowded Conditions. Biochemistry 2011, 50, 5834–5844. 10.1021/bi200365j. [DOI] [PubMed] [Google Scholar]
- Zegarra F. C.; Homouz D.; Gasic A. G.; Babel L.; Kovermann M.; Wittung-Stafshede P.; Cheung M. S. Crowding-Induced Elongated Conformation of Urea-Unfolded Apoazurin: Investigating the Role of Crowder Shape in Silico. J. Phys. Chem. B 2019, 123, 3607–3617. 10.1021/acs.jpcb.9b00782. [DOI] [PMC free article] [PubMed] [Google Scholar]
- Flaugh S. L.; Lumb K. J. Effects of Macromolecular Crowding on the Intrinsically Disordered Proteins c-Fos and p27-Kip1. Biomacromolecules 2001, 2, 538–540. 10.1021/bm015502z. [DOI] [PubMed] [Google Scholar]
- Goldenberg D. P.; Argyle B. Minimal effects of Macromolecular Crowding on an Intrinsically Disordered Protein: A Small-Angle Neutron Scattering Study. Biophys. J. 2014, 106, 905–914. 10.1016/j.bpj.2013.12.003. [DOI] [PMC free article] [PubMed] [Google Scholar]
- Soranno A.; Koenig I.; Borgia M. B.; Hofmann H.; Zosel F.; Nettels D.; Schuler B. Single-molecule spectroscopy reveals polymer effects of disordered proteins in crowded environments. Proc. Natl. Acad. Sci. 2014, 111, 4874–4879. 10.1073/pnas.1322611111. [DOI] [PMC free article] [PubMed] [Google Scholar]
- Miller C. M.; Kim Y. C.; Mittal J. Protein composition determines the effect of crowding on the properties of disordered proteins. Biophys. J. 2016, 111, 28–37. 10.1016/j.bpj.2016.05.033. [DOI] [PMC free article] [PubMed] [Google Scholar]
- Fagerberg E.; Lenton S.; Skepö M. Evaluating Models of Varying Complexity of Crowded Intrinsically Disordered Protein Solutions Against SAXS. J. Chem. Theory Comput. 2019, 15, 6968–6983. 10.1021/acs.jctc.9b00723. [DOI] [PubMed] [Google Scholar]
- Henriques J.; Cragnell C.; Skepö M. Molecular Dynamics Simulations of Intrinsically Disordered Proteins: Force Field Evaluation and Comparison with Experiment. J. Chem. Theory Comput. 2015, 11, 3420–3431. 10.1021/ct501178z. [DOI] [PubMed] [Google Scholar]
- Henriques J.; Skepö M. Molecular Dynamics Simulations of Intrinsically Disordered Proteins: On the Accuracy of the TIP4P-D Water Model and the Representativeness of Protein Disorder Models. J. Chem. Theory Comput. 2016, 12, 3407–3415. 10.1021/acs.jctc.6b00429. [DOI] [PubMed] [Google Scholar]
- Iovino M.; Falconi M.; Marcellini A.; Desideri A. Molecular dynamics simulation of the antimicrobial salivary peptide histatin-5 in water and in trifluoroethanol: a microscopic description of the water destructuring effect. J. Pept. Res. 2001, 45–55. 10.1034/j.1399-3011.2001.00885.x. [DOI] [PubMed] [Google Scholar]
- Puri S.; Edgerton M. How Does It Kill?: Understanding the Candidacidal Mechanism of Salivary Histatin 5. Eukaryotic Cell 2014, 13, 958–964. 10.1128/EC.00095-14. [DOI] [PMC free article] [PubMed] [Google Scholar]
- Ruissen A. L. A.; Groenink J.; Helmerhorst E. J.; Walgreen-Weterings E.; van’t Hof W.; Veerman E. C. I.; Amerongen A. V. N. Effects of histatin 5 and derived peptides on Candida albicans. Biochem. J. 2001, 356, 361–368. 10.1042/bj3560361. [DOI] [PMC free article] [PubMed] [Google Scholar]
- Melino S.; Rufini S.; Sette M.; Morero R.; Grottesi A.; Paci M.; Petruzzelli R. Zn2+ Ions Selectively Induce Antimicrobial Salivary Peptide Histatin-5 To Fuse Negatively Charged Vesicles. Identification and Characterization of a Zinc-Binding Motif Present in the Functional Domain. Biochemistry 1999, 38, 9626–9633. 10.1021/bi990212c. [DOI] [PubMed] [Google Scholar]
- Bennick A. Interaction of Plant Polyphenols with Salivary Proteins. Crit. Rev. Oral Biol. Med. 2002, 13, 184–196. 10.1177/154411130201300208. [DOI] [PubMed] [Google Scholar]
- Wróblewski K.; Muhandiram R.; Chakrabartty A.; Bennick A. The molecular interaction of human salivary histatins with polyphenolic compounds. Eur. J. Biochem. 2001, 268, 4384–4397. 10.1046/j.1432-1327.2001.02350.x. [DOI] [PubMed] [Google Scholar]
- Ghosh K.; Dill K. A. Computing protein stabilities from their chain lengths. Proc. Natl. Acad. Sci. U. S. A. 2009, 106, 10649–10654. 10.1073/pnas.0903995106. [DOI] [PMC free article] [PubMed] [Google Scholar]
- Goyal B.; Kumar A.; Srivastava K. R.; Durani S. Scrutiny of chain-length and N-terminal effects in α-helix folding: a molecular dynamics study on polyalanine peptides. J. Biomol. Struct. Dyn. 2017, 35, 1923–1935. 10.1080/07391102.2016.1199972. [DOI] [PubMed] [Google Scholar]
- Dignon G. L.; Zheng W.; Kim Y. C.; Best R. B.; Mittal J. Sequence determinants of protein phase behavior from a coarse-grained model. PLoS Comput. Biol. 2018, 14, 1–23. 10.1371/journal.pcbi.1005941. [DOI] [PMC free article] [PubMed] [Google Scholar]
- Pappu R. V.; Wang X.; Vitalis A.; Crick S. L. A polymer physics perspective on driving forces and mechanisms for protein aggregation. Arch. Biochem. Biophys. 2008, 469, 132–141. 10.1016/j.abb.2007.08.033. [DOI] [PMC free article] [PubMed] [Google Scholar]
- Mészáros B.; Erdős G.; Dosztányi Z. IUPRED2A: context-dependent prediction of protein disorder as a function of redox state and protein binding. Nucleic Acids Res. 2018, 46, W329–W337. 10.1093/nar/gky384. [DOI] [PMC free article] [PubMed] [Google Scholar]
- Ishida T.; Kinoshita K. PrDos: prediction of disordered protein regions from amino acid sequence. Nucleic Acids Res. 2007, 35, W460–W464. 10.1093/nar/gkm363. [DOI] [PMC free article] [PubMed] [Google Scholar]
- Gasteiger E.; Hoogland C.; Gattiker A.; Duvaud S.; Wilkins M.; Appel R.; Bairoch A.The Proteomics Protocols Handbook; Walker J. M., Ed.; Humana Press; 2005; pp. 571–607. [Google Scholar]
- Tria G.; Mertens H. D. T.; Kachala M.; Svergun D. I. Advanced ensemble modelling of flexible macromolecules using X-ray solution scattering. IUCrJ 2015, 2, 207–217. 10.1107/S205225251500202X. [DOI] [PMC free article] [PubMed] [Google Scholar]
- Micsonai A.; Wien F.; Bulyáki É.; Kun J.; Moussong É.; Lee Y.-H.; Goto Y.; Réfrégiers M.; Kardos J. BeStSel: a web server for accurate protein secondary structure prediction and fold recognition from the circular dichroism spectra. Nucleic Acids Res. 2018, 46, W315–W322. 10.1093/nar/gky497. [DOI] [PMC free article] [PubMed] [Google Scholar]
- Cragnell C.; Durand D.; Cabane B.; Skepö M. Coarse-grained modeling of the intrinsically disordered protein Histatin 5 in solution: Monte Carlo simulations in combination with SAXS. Proteins: Struct., Funct., Bioinf. 2016, 84, 777–791. 10.1002/prot.25025. [DOI] [PubMed] [Google Scholar]
- Cragnell C.; Rieloff E.; Skepö M. Utilizing Coarse-Grained Modeling and Monte Carlo Simulations to Evaluate the Conformational Ensemble of Intrinsically Disordered Proteins and Regions. J. Mol. Biol. 2018, 430, 2478–2492. 10.1016/j.jmb.2018.03.006. [DOI] [PubMed] [Google Scholar]
- Jurij R.; Per L. MOLSIM: A modular molecular simulation software. J. Comput. Chem. 2015, 36, 1259–1274. 10.1002/jcc.23919. [DOI] [PMC free article] [PubMed] [Google Scholar]
- Berendsen H. J. C.; van der Spoel D.; van Drunen R. GROMACS: A message-passing parallel molecular dynamics implementation. Comput. Phys. Commun. 1995, 91, 43–56. 10.1016/0010-4655(95)00042-E. [DOI] [Google Scholar]
- Lindahl E.; Hess B.; van der Spoel D. GROMACS 3.0: a package for molecular simulation and trajectory analysis. J. Mol. Model. 2001, 7, 306–317. 10.1007/s008940100045. [DOI] [Google Scholar]
- van Der Spoel D.; Lindahl E.; Hess B.; Groenhof G.; Mark A. E.; Berendsen H. J. C. GROMACS: Fast, flexible, and free. J. Comput. Chem. 2005, 26, 1701–1718. 10.1002/jcc.20291. [DOI] [PubMed] [Google Scholar]
- Hess B.; Kutzner C.; van der Spoel D.; Lindahl E. GROMACS 4: Algorithms for Highly Efficient, Load-Balanced, and Scalable Molecular Simulation. J. Chem. Theory Comput. 2008, 4, 435–447. 10.1021/ct700301q. [DOI] [PubMed] [Google Scholar]
- Lindorff-Larsen K.; Piana S.; Palmo K.; Maragakis P.; Klepeis J. L.; Dror R. O.; Shaw D. E. Improved side-chain torsion potentials for the Amber ff99SB protein force field. Proteins: Struct., Funct., Bioinf. 2010, 78, 1950–1958. 10.1002/prot.22711. [DOI] [PMC free article] [PubMed] [Google Scholar]
- Abascal J. L. F.; Vega C. A general purpose model for the condensed phases of water: TIP4P/2005. J. Chem. Phys. 2005, 123, 234505. 10.1063/1.2121687. [DOI] [PubMed] [Google Scholar]
- Piana S.; Donchev A. G.; Robustelli P.; Shaw D. E. Water Dispersion Interactions Strongly Influence Simulated Structural Properties of Disordered Protein States. J. Phys. Chem. B 2015, 119, 5113–5123. PMID: 25764013 10.1021/jp508971m. [DOI] [PubMed] [Google Scholar]
- Darden T.; York D.; Pedersen L. Particle mesh Ewald: AnN·log(N) method for Ewald sums in large systems. J. Chem. Phys. 1993, 98, 10089–10092. 10.1063/1.464397. [DOI] [Google Scholar]
- Bussi G.; Donadio D.; Parrinello M. Canonical sampling through velocity rescaling. J. Chem. Phys. 2007, 126, 014101 10.1063/1.2408420. [DOI] [PubMed] [Google Scholar]
- Parrinello M.; Rahman A. Polymorphic transitions in single crystals: A new molecular dynamics method. J. Appl. Phys. 1981, 52, 7182–7190. 10.1063/1.328693. [DOI] [Google Scholar]
- Hess B.; Bekker H.; Berendsen H. J. C.; Fraaije J. G. E. M. LINCS: A linear constraint solver for molecular simulations. J. Comput. Chem. 1997, 18, 1463–1472. . [DOI] [Google Scholar]
- Schneidman-Duhovny D.; Hammel M.; Tainer J. A.; Sali A. Accurate SAXS Profile Computation and Its Assessment by Contrast Variation Experiments. Biophys. J. 2013, 105, 962–974. 10.1016/j.bpj.2013.07.020. [DOI] [PMC free article] [PubMed] [Google Scholar]
- Nagy G.; Igaev M.; Jones N. C.; Hoffmann S. V.; Grubmüller H. SESCA: Predicting Circular Dichroism Spectra from Protein Molecular Structures. J. Chem. Theory Comput. 2019, 15, 5087–5102. PMID: 31402660 10.1021/acs.jctc.9b00203. [DOI] [PubMed] [Google Scholar]
- Drew E. D.; Janes R. W. PDBMD2CD: providing predicted protein circular dichroism spectra from multiple molecular dynamics-generated protein structures. Nucleic Acids Res. 2020, W17. 10.1093/nar/gkaa296. [DOI] [PMC free article] [PubMed] [Google Scholar]
- Kabsch W.; Sander C. Dictionary of protein secondary structure: Pattern recognition of hydrogen-bonded and geometrical features. Biopolymers 1983, 22, 2577–2637. 10.1002/bip.360221211. [DOI] [PubMed] [Google Scholar]
- Campos S. R. R.; Baptista A. M. Conformational Analysis in a Multidimensional Energy Landscape: Study of an Arginylglutamate Repeat. J. Phys. Chem. B 2009, 113, 15989–16001. 10.1021/jp902991u. [DOI] [PubMed] [Google Scholar]
- Jephthah S.; Staby L.; Kragelund B. B.; Skepö M. Temperature Dependence of Intrinsically Disordered Proteins in Simulations: What are We Missing?. J. Chem. Theory Comput. 2019, 15, 2672–2683. 10.1021/acs.jctc.8b01281. [DOI] [PubMed] [Google Scholar]
- Roberts D.; Keeling R.; Tracka M.; van der Walle C. F.; Uddin S.; Warwicker J.; Curtis R. Specific Ion and Buffer Effects on Protein–Protein Interactions of a Monoclonal Antibody. Mol. Pharmaceutics 2015, 12, 179–193. PMID: 25389571 10.1021/mp500533c. [DOI] [PubMed] [Google Scholar]
- Rieloff E.; Skepö M. Phosphorylation of a Disordered Peptide—Structural Effects and Force Field Inconsistencies. J. Chem. Theory Comput. 2020, 16, 1924–1935. 10.1021/acs.jctc.9b01190. [DOI] [PubMed] [Google Scholar]
Associated Data
This section collects any data citations, data availability statements, or supplementary materials included in this article.


