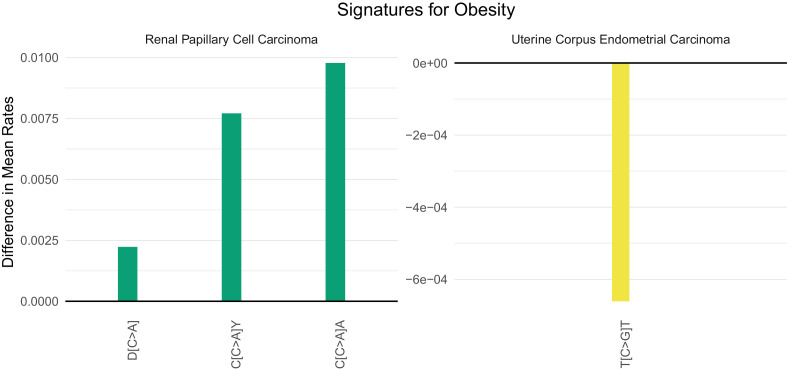
Figure 6. Mutational signatures of obesity in kidney (KIRP) and uterine (UCEC) cancer patients.
All features of a signature are depicted (IUPAC notations: B=not A, D = not C, H = not G, V = not T, W = A or T, S = C or G, M = A or C, K = G or T, R = A or G, Y = C or T). The color of each bar is representing the point mutation type as follows: C to T mutations = red, C to A = green, C to G = yellow, T to C = orange, T to G = purple, T to A = blue. The difference in the mean mutation rate (mutation count/age) between exposed and unexposed is reported for each predictive feature present in the two mutational signatures for obesity. Bars falling below zero represent mutation types which are underrepresented when the given exposure is present.

