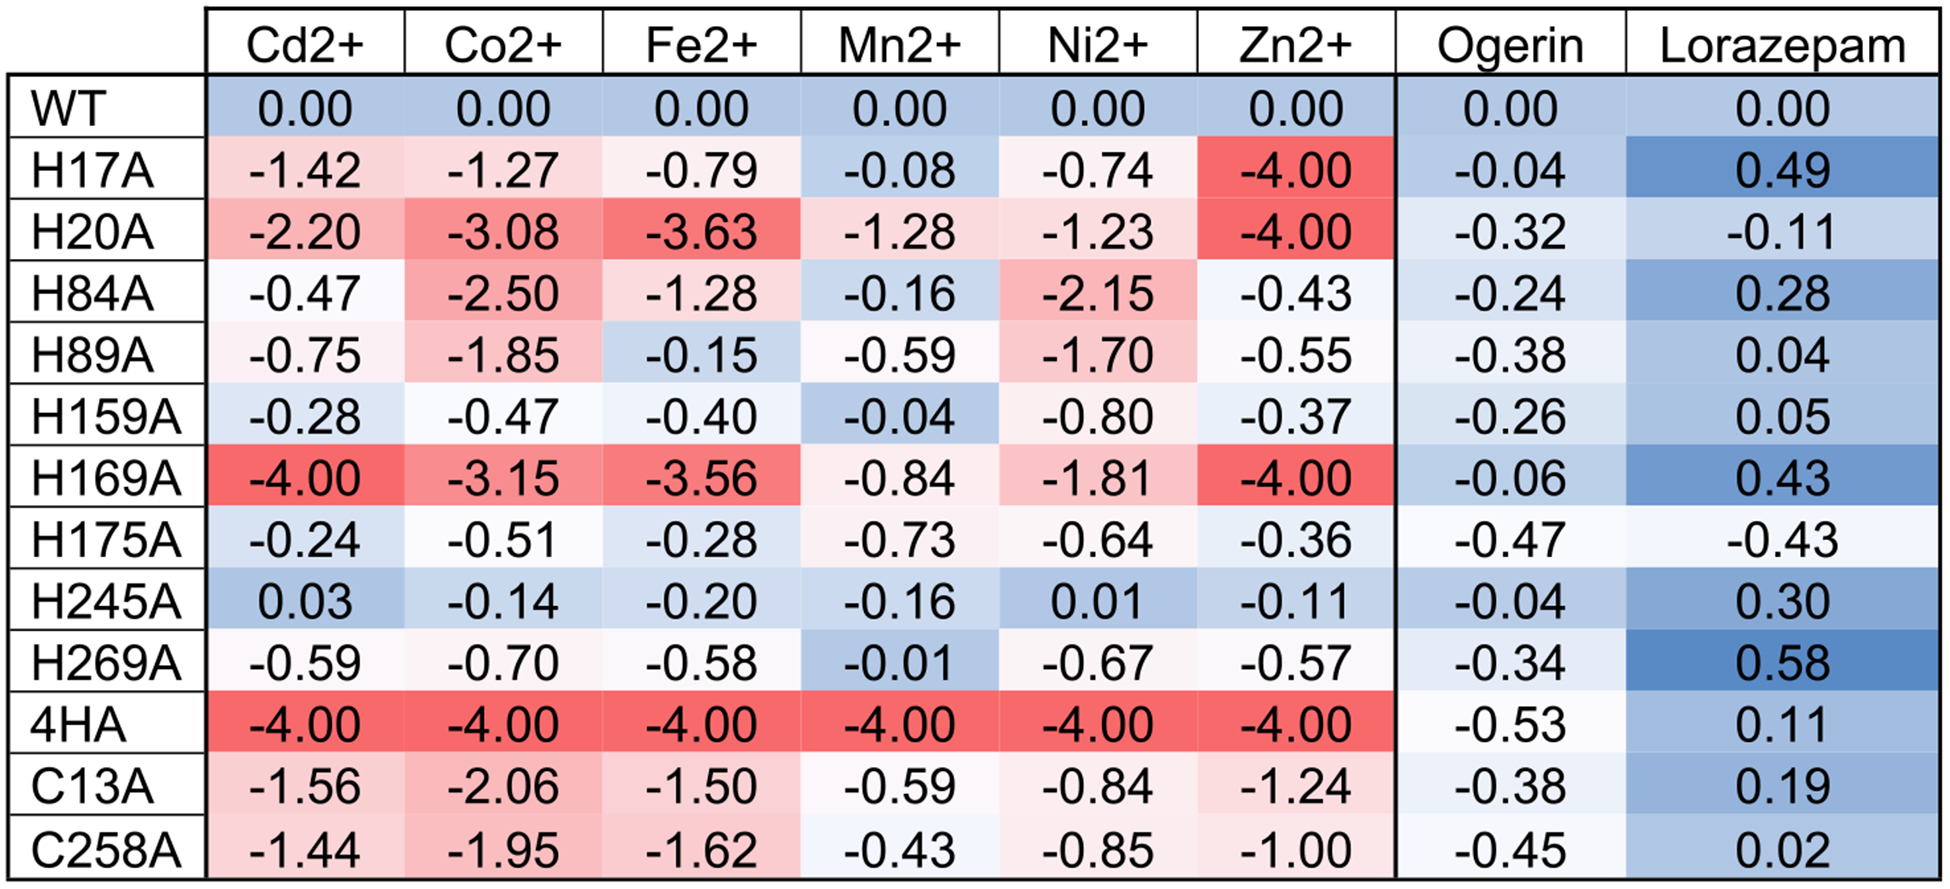
Figure 8.

Heat map presentation of effects of Histidine and Cysteine mutations on metal ions and ogerin and lorazepam. For each ligand, the ΔLog(Max/EC50) value between mutant and wild-type (WT) receptors was calculated from the parameters retrieved from the curves in Figure 7. Negative values stand for reduced activity, and positive values stand for enhanced activity. Results were analyzed in an Excel sheet using the built-in conditional formatting function. For the mutant and ligand pair with no observed PAM activity, Cd2+ at H169A, Zn2+ at H17A, H20A, and H169A mutants, and metals at 4HA (H17A + H20A + H84A + H169A), ΔLog(Max/EC50) values could not be calculated. We set the value at the lowest (−4.00) for presentation purposes. Detail parameters were listed in Table S1.
