Abstract
Novel strain of Severe Acute Respiratory Syndrome Coronavirus 2 (SARS-CoV2) causes mild to severe respiratory illness. The early symptoms may be fever, dry cough, sour throat, and difficulty in breathing which may lead to death in severe cases. Compared to previous outbreaks like SARS-CoV and Middle East Respiratory Syndrome (MERS), SARS-CoV2 disease (COVID-19) outbreak has been much distressing due to its high rate of infection but low infection fatality rate (IFR) with 1.4% around the world. World Health Organization (WHO) has declared (COVID-19) a pandemic on March 11, 2020. In the month of January 2020, the whole genome of SARS-CoV2 was sequenced which made work easy for researchers to develop diagnostic kits and to carry out drug repurposing to effectively alleviate the pandemic situation in the world. Now, it is important to understand why this virus has high rate of infectivity or is there any factor involved at the genome level which actually facilitates this virus infection globally? In this study, we have extensively analyzed the whole genomes of different coronaviruses infecting humans and animals in different geographical locations around the world. The main aim of the study is to identify the similarity and the mutational adaptation of the coronaviruses from different host and geographical locations to the SARS-CoV2 and provide a better strategy to understand the mutational rate for specific target-based drug designing. This study is focused to every annotation in a comparative manner which includes SNPs, repeat analysis with the different categorization of the short-sequence repeats and long-sequence repeats, different UTR’s, transcriptional factors, and the predicted matured peptides with the specific length and positions on the genomes. The extensive analysis on SNPs revealed that Wuhan SARS-CoV2 and Indian SARS-CoV2 are having only eight SNPs. Collectively, phylogenetic analysis, repeat analysis, and the polymorphism revealed the genomic conserveness within the SARS-CoV2 and few other coronaviruses with very less mutational chances and the huge distance and mutations from the few other species.
Keywords: SARS-CoV2, Phylogenomics, Genome map, SNP, UTR, SSR
Introduction
Coronavirus (CoV) is enveloped, positive-sense single-stranded (ss) RNA genome ranging from 27 to 34 kb in length which are divided into four different genera, for example α, β, γ, and δ. Coronavirus is not a new threat to human being or animal kingdom, it’s an old virus and causing the infection in wide numbers of different animals such as Pheasant, Guinea Fowl, Bovine, Beluga whale, rat, rabbit, camel, swine, and other species [1, 2]. CoVs genome contains variable number of open reading frames (ORFs) 6–11. Among ORFs, two-thirds of viral genome located in first orf1a/b which translates two different polyproteins, pp1a and pp1ab. These polyproteins encodes 16 different nonstructural proteins (nsps); however, the rest ORFs encode several accessory and structural proteins. The remaining viral RNA encodes four indispensable structural proteins (spike S glycoprotein, small envelope E, matrix M, and nucleocapsid N protein), in addition, several accessory proteins that assist virus to evade host immune response [2, 3]. Previously, Middle East Respiratory Syndrome (MERS) CoV (2012) and SARS-CoV (2003) caused outbreaks that were considered as the public health threats. But in December 2019, China has reported a novel strain of severe acute respiratory syndrome coronavirus which is renamed as SARS-CoV2 by the World Health Organization [4, 5]. Compared to previous outbreaks, SARS-CoV2 disease (COVID-19) outbreak has been much disturbing due to its high rate of infection at global level. As of November 21, 2020, there are 57,910,582 positive cases that have been confirmed in which 1,377,762 death occurred as reported by WHO, globally. Moreover, due to high rate of infection of SARS-CoV2 and zoonotic disease, it spreads rapidly throughout the world and became a pandemic and ultimate threat to mankind at this time. Studies have shown that SARS-CoV2 shares 96% genome similarity with Bat CoV RaTG13 and it is assumed that bat could be the natural host for SARS-CoV2 origin [6–8]. Scientists across the globe are trying to elucidate the genome characteristics using phylogeny, structural, and mutational analysis. Recently, few scientists are able to crystalize the protein of this virus for future computational modeling and drug-related research [9, 10].
Genome sequencing is considered one of the main factors in research which reveals almost everything of the organism, but in this case, there are more than 400 genomes of SARS viruses are submitted in NCBI genome database and many are still being sequenced and analyzed throughout the world. There are many published research suggested few drugs as effective against COVID-19 [11, 12], but unfortunately, there is no drug as effective to cure from this virus. There are huge complications on designing a drug against any virus due to its mutational adaptation and modification in its genomic islands. In the current work, we have extensively mined the various constraints of the genome like from country, host organism, and reported year and chosen the extensively different data with the SARS-CoV-2 from China and India to get the exact rate of mutations. We have included the data of whale, rat, fowl, camel, and human to get the genomic divergence between all species which are infecting different hosts. Further, we have also created the local database for the genomic reannotation within all species which resulted in the various new annotations from the genome itself and extracted the data for plotting them in graphical format for understanding its various restraints.
In addition, we have identified the restriction sites on the genomes of the species and categorized the long-sequence repeat and short-sequence repeat which can be used in future modeling. Genome-based medication is the present requirement for this pandemic; short-sequence repeats (SSRs) can play an important role in this procedure. The predicted mature peptide can be analyzed further for getting the huge implication on targeting the translation mechanism. Our analysis shows a colossal focus on different annotations to get several ideas on the medication after understanding the genome.
Methodology
Genome Retrieval and Mining
Genome sequence of all coronaviruses have been downloaded and converted to a comma-separated values (CSV) file and have been analyzed the important features such as the geographical locations, period, and host organism where the suitable one for all meanings was taken into consideration and performed for all the analyses of that coronaviruses. Human SARS-CoV2 has been taken 3 times because of its difference in the sequencing timing and geographical locations. After preparation of the final list of 24 genomes, it was renamed as the serial number_Accession Number_sequence_reporting_country_host_year of submission (Table 1) to avoid any confusion during analysis and for the reader as well. Further, all 24 genomes are enlisted below to understand its sequence reporting country host and the name of the virus.
Table 1.
The accession number of coronaviruses and the renamed names of the coronaviruses
| S No | Accession No | Names of the Coronavirus |
|---|---|---|
| 1 | MN996531.1 | 1_MN996531.1_China: WuhanSARS2 2020 |
| 2 | MT050493.1 | 2_MT050493_India_human_2020 |
| 3 | MK581200.1 | 3_MK581200.1_Poland_Infectious bronchitis2019 |
| 4 | MK423876.1 | 4_MK423876.1_China_Pheasant coronavirus 2019 |
| 5 | NC_006213.1 | 5_NC_006213.1_USA_HumanOC43 2019 |
| 6 | MK032180.1 | 6_MK032180.1_China_bronchitis2018 |
| 7 | NC_038294.1 | 7_NC_038294.1_UK_βCV1 2018 |
| 8 | NC_034972.1 | 8_NC_034972.1_China_AcCoV-JC34 2018 |
| 9 | LN610099.1 | 9_LN610099.1_France_GuineaFowl2015 |
| 10 | NC_003045.1 | 10_NC_003045.1__Bovine coronavirus2018 |
| 11 | NC_004718.3 | 11_NC_004718.3_Canada: SARS2018 |
| 12 | NC_006577.2 | 12_NC_006577.2__HumanHKU1 2018 |
| 13 | NC_010438.1 | 13_NC_010438.1_HK_Miniopterus bat2018 |
| 14 | NC_010646.1 | 14_NC_010646.1__Beluga whaleSW1 2018 |
| 15 | NC_010800.1 | 15_NC_010800.1_Canada_Turkey coronavirus 2018 |
| 16 | NC_012936.1 | 16_NC_012936.1__Rat coronavirus Parker 2018 |
| 17 | NC_017083.1 | 17_NC_017083.1_China_RabbitHKU14_2018 |
| 18 | NC_019843.3 | 18_NC_019843.3__MERS_coronavirus 2018 |
| 19 | NC_023760.1 | 19_NC_023760.1_USA: Wisconsin WD1127_2018 |
| 20 | NC_026011.1 | 20_NC_026011.1_China_βCV_HKU24 2018 |
| 21 | NC_028752.1 | 21_NC_028752.1_Saudi_Camel αCV 2018 |
| 22 | NC_028806.1 | 22_NC_028806.1_Italy_Swine enteric2018 |
| 23 | NC_030292.1 | 23_NC_030292.1_Netherlands_Ferret2018 |
| 24 | MN975262.1 | 24_MN975262.1_China_seafood pneumonia2020 |
Annotations and Alignment Analysis
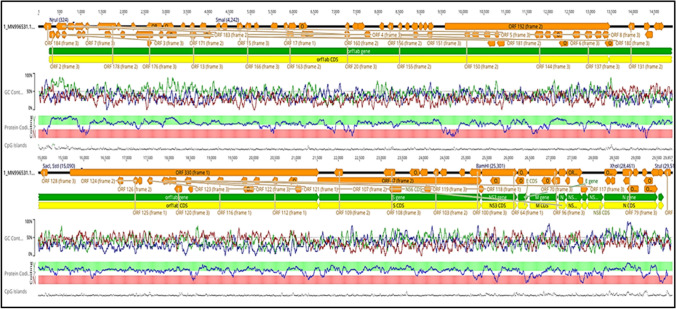
The genome of the different species has been downloaded, through the NCBI plugin in Geneious prime [13] and reannotated through the feature using the local database which creates many new annotations. However, MN996531.1 has been taken as reference for all the analyses. Genomes were aligned using MAFFT [14, 15] with parameters such as Auto algorithm selection and 200PAM/k = 2, Gap open penalty of 1.53, and all the data to find the distance between all the species [14, 15]. Annotation extractions provide a huge specific sequence which was further analyzed and plotted using excel and tableau [16]. The Genome of the SARS-CoV2 is plotted (Fig. 1) using the Geneious prime for better comprehension and understanding by a common reader [13]. All the data have been reannotated with local database feature in Geneious prime and collected the count of each annotation (Table 2).
Fig. 1.
Genome Map of SARS-CoV2 where yellow color represents the coding sequence (CDS), and green color represents genes. The graph represents GC content which is plotted according to the sequence of the genome, protein-coding regions are plotted with the blue graph in the range of red and green where green means protein-coding, red means noncoding region, CpG islands also plotted in accordance with the genome with a black dotted line. There are a total of 129 open reading frame (ORF) regions predicted from the genome and are plotted accordingly with the parallel to the sequence of gene and CDS
Table 2.
Comparative analysis of the count of genomic annotations from different coronaviruses
| Accession Number/Annotations | Sequence Length | GC content | Count of CDS | Count of Gene | Count of ORF | Count of 3′UTR | Count of 5′UTR | Count of Mature Peptide | Count of transcription factor |
| MN996531.1 | 29857 | 38.00% | 11 | 11 | 129 | 0 | 0 | 0 | 501 |
| MT050493.1 | 29851 | 38.00% | 11 | 11 | 144 | 0 | 0 | 0 | 471 |
| MK581200.1 | 27324 | 38.00% | 13 | 0 | 802 | 4 | 1 | 0 | 759 |
| MK423876.1 | 27655 | 38.20% | 9 | 18 | 770 | 0 | 0 | 0 | 835 |
| NC_006213.1 | 30741 | 36.80% | 8 | 16 | 1046 | 0 | 0 | 0 | 905 |
| MK032180.1 | 27678 | 38.10% | 9 | 18 | 825 | 2 | 0 | 0 | 778 |
| NC_038294.1 | 30111 | 41.20% | 10 | 18 | 1062 | 0 | 0 | 0 | 763 |
| NC_034972.1 | 27682 | 40.10% | 9 | 18 | 1008 | 0 | 0 | 0 | 744 |
| LN610099.1 | 27471 | 38.30% | 12 | 26 | 780 | 0 | 0 | 0 | 826 |
| NC_003045.1 | 31028 | 37.10% | 12 | 20 | 1073 | 4 | 1 | 15 | 893 |
| NC_004718.3 | 29751 | 40.80% | 14 | 26 | 1043 | 4 | 1 | 16 | 766 |
| NC_006577.2 | 29926 | 32.10% | 8 | 16 | 901 | 0 | 0 | 15 | 1007 |
| NC_010438.1 | 28773 | 41.80% | 8 | 14 | 1495 | 0 | 0 | 0 | 747 |
| NC_010646.1 | 31686 | 39.20% | 14 | 28 | 1054 | 4 | 1 | 0 | 940 |
| NC_010800.1 | 27657 | 38.30% | 11 | 22 | 760 | 0 | 0 | 15 | 778 |
| NC_012936.1 | 31250 | 41.30% | 10 | 20 | 1120 | 0 | 0 | 0 | 870 |
| NC_017083.1 | 31100 | 37.60% | 11 | 22 | 1110 | 0 | 0 | 0 | 927 |
| NC_019843.3 | 30119 | 41.20% | 11 | 20 | 1066 | 0 | 0 | 0 | 750 |
| NC_023760.1 | 28941 | 37.50% | 10 | 20 | 940 | 0 | 0 | 0 | 772 |
| NC_026011.1 | 31249 | 40.10% | 10 | 20 | 1149 | 0 | 0 | 0 | 886 |
| NC_028752.1 | 27395 | 38.40% | 7 | 14 | 1045 | 0 | 0 | 0 | 795 |
| NC_028806.1 | 28111 | 38.10% | 9 | 18 | 1028 | 0 | 0 | 0 | 731 |
| NC_030292.1 | 28434 | 39.00% | 9 | 16 | 894 | 0 | 0 | 0 | 808 |
| MN975262.1 | 29891 | 38.00% | 11 | 21 | 825 | 4 | 1 | 0 | 821 |
Transcription Factor and Repeat Analysis
The transcription factor was predicted using the Geneious prime plugins with the database of REBAS, the Restriction Enzyme Databases have been reannotated using the locally created database to get the same annotations of all species with the huge number of site identification [17]. Phobos was used for the short-sequence repeat analysis with the parameters of extend where the exact search and the repeat unit length were set to 1(min) to 10 (max) bp long, and the percentage of perfection was set to 0 to max 100 [18]. LSR was analyzed and extracted using the default program of repeat finder in geneious prime with the parameters such as minimum repeat length of 100 and ignoring the repeat up to 10 bp and 0% of mismatch which includes further both repeat sequences analyzed then categorized. All the sequences based on the length were plotted separately to get the difference and specific locations.
Mutational and Other Predictions and Analysis
All the data were again aligned using the MAFFT aligner [14, 15] and the single-nucleotide polymorphisms (SNPs) were extracted separately in another column, and afterwards the percentage of the mutation were calculated with the genome size for wide understanding in a lay or easy format. All the data of the untranslated region of 3′ and 5′ were extracted and enlisted separately and plotted after mining. Mature peptides were predicted using the Geneious prime and reannotated again with the local database then extracted the data from the sequence and mined them for the plotting in accordance with the data size and the name of species and the peptide parallelly.
Phylogeny
The phylogenetic tree was constructed using three programs and steps; first, we have aligned the data using MAFFT aligner [14, 15] because of its fast and accuracy and then plotted the tree using Geneious tree builder [19] and the final editing was done using the iTOL server for the plotting in circular and colorful format [20]. We have used the neighbor-joining method with no-defined outgroup and Tamura-Nei Genetic distance Model as parameters in the Geneious Tree builder [21]. The format of the tree was plotted to be understood for the common person easily and highlighted the specificity such as human-related species.
Results
Genome Map with Functional and Appropriate Annotations
Here, we have mapped the genomes with the specific features of annotations and plotted the graph of the sequence of the genome. Wuhan SARS-CoV2, a new strain of coronavirus now called severe acute respiratory syndrome coronavirus 2 (SARS-CoV2), [22] is plotted using Geneious prime for the annotation of the data and all information about the genomes is collected and reannotated with the local database feature; after reannotation, the data have been updated and the sequences are plotted gene (green) on CDS (yellow) and found a total of 11 CDS and genes, respectively (Fig. 1). The genome is having a total of 129 ORF with small and long read size plotted with copper color in the genome map. We have got a total of 10 restriction sites on the genome of SARS-CoV2 which are PvuI, StuI, XhoI, BamHI, NaeI, SacI, SstI, XmaI, SmaI, and NruI having length of 6 bp and BglI having length of 11 bp. Further, it is plotted within the graph including their names (Fig. 1). The nucleotide content was plotted from 100% to 0% and forecasted accordingly with the AT-rich in green, GC rich in blue, and frame with the red color to avoid any confusion (Fig. 1). The protein-coding region is plotted using the tcode tool of EMBOSS v.6.5.6 [23, 24] which is in yes or no format it depicts that the blue color graph line comes in the green band are protein-coding and the blue line comes to the red band are not coding part of the genome. CpG islands are plotted along with the black line with the other form. Figure 1 gives an intense view with the name of annotations which will guide the researcher to get the exact information and identify which region is actually responsible for a particular function and where restriction sites are located. Collectively, this information will provide a better idea about the future research on it.
Comparative Plot for the Genome Length of Different Coronaviruses
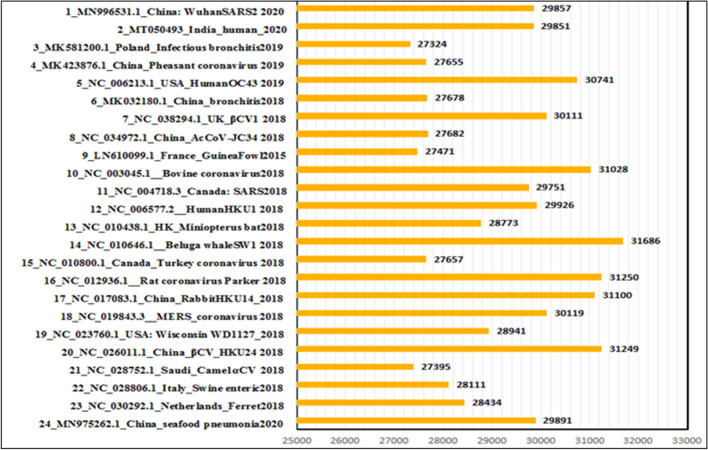
We have taken genomes of 24 coronaviruses and renamed them for better presentation. The data have been extracted from Geneious prime and plotted using Excel. The longest length in bp of the genome is beluga whale which is 31,686 bp long, while the genome size of the Indian and Chinese SARS-CoV2 is 29,851 bp and 29,857 bp, respectively (Fig. 2). When we compared the genome size of the Indian and Chinese SARS-CoV2 with a whale genome, we observed that both had the less genome size of 1835 bp and 1829 bp, respectively. The smallest genome of SARS causing virus is with the genome size of 27,324 bp long. All the genomes are falling within this range (Fig. 2). The length of the genomes matters because of their elements, the longest genome usually contains a greater number of genes which resulted in more complexity in the system while small genomes usually contain less number of genes which may contain the less number of genes.
Fig. 2.
Genome length of Coronaviruses from a different host and geographical locations. Accession numbers along with the reported countries and host have been mentioned
Analysis of Distance Between All Species
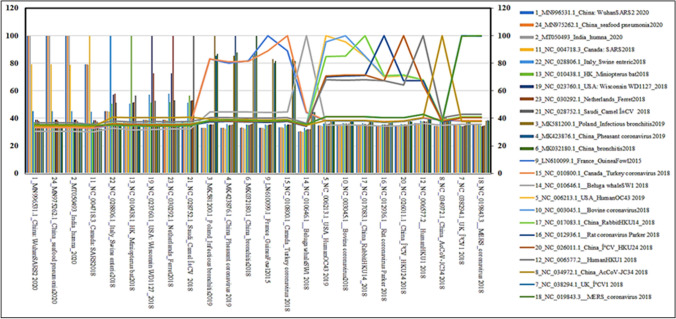
We have aligned all the genomes together and extracted the data into the matrix format. The data are first generated in the percentage of the similarity and then plotted accordingly and proportionally. The maximum similarity has been found in the two genomes of human SARS-CoV2 which are reported from China and India. The percentage of the similarity of Chinese and Indian SARS-CoV2 is 99.977% and 99.973%, respectively (Fig. 3). Moreover, Canadian SARS-2018 is having 79.047%, Italy Swine enteric 2018 is having 45.15%, Human HKU1_2018 is having 36.5%, the Miniopterus bat 2018 is having 37.3%, MERS 2018 is having 35.4% , and Chinese rabbit HKU14 is having 34.8% similarity with SARS-CoV2. The lowest genome similarity has seen in the beluga whale coronavirus which is only 30% similar to the present SARS-CoV2 genome. SARS genome reported from Canada is having 79% similarity. Rest are showing 30–45% similarity with the genomes of the SARS-CoV2 but most of the genomes shows 33% similarity which is still a huge similarity if it is found in the coding region (Fig. 3). The distance is being plotted in 2D format (Supplementary excel sheet). We have plotted the 2D matrix and we have gotten combo plot for the better understanding, one plot is bar graph plot which shows few species to species genome similarity, while the line shows the up and down in the graph that can be observed very easily because of a different color. Both line and the bar graph show the same data and together make a combo plot of genome distance. This distance matrix shows the shared genomic region which could be visualizes during the phylogeny and it is helpful for the species classifications on the basis of genomic similarity.
Fig. 3.
Comparative analysis of the distance matrix between the different coronaviruses matrix obtained after alignments and calculation of distance. All the species with the accession number and geographical location are enlisted for both axes
Single-Nucleotide Polymorphism
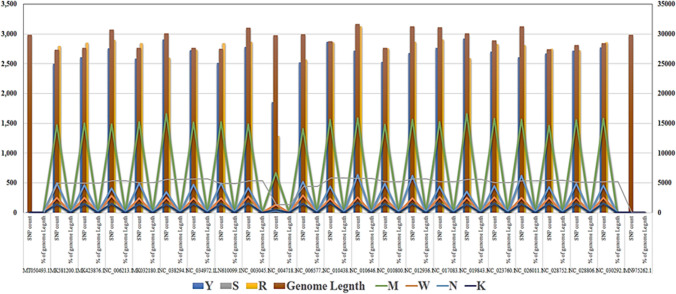
SNPs are one of the important changes in the genomes which help species to acquire different climate and even helps to develop into a different organism [25]. Personalized medicine development is failing only because of the modification or mutational changes in any position which resulted in the failure of the whole system. We have extensively mined the data after MAFFT alignment [14, 15] and found the SNPs with very huge numbers. For better understanding, we have renamed the mutation and provided the detail in Table 3. Because of huge divergence between the species, we have observed a huge number for SNPs. The least number of polymorphisms is 7 in the genome of SARS-CoV2 with accession number of MN975262.1. We have denoted Y which means C is replaced by T which is recurring 6 times in the genome of MT050493.1. The genome, which is reported from Kerala state of India [26], is having a total of 8 SNPs out of which 6Y, 1R, and 1M are on the CDS region. M symbol denotes that A is replaced by C. If we consider the genome of the species that is negligible, so from here, it indicates that the mutational rate of the SARS-CoV2 is very less. This result infers that the genome has very less capability of mutational adaptations. A maximum number of variants are extracted from the beluga whale which is 56.5%. However, rest genomes are in between 0 and 56% of polymorphism with the SARS-CoV2 genome. SARS virus reported in 2018 from Canada showing 20.9% polymorphism which is the least in SNPs after SARS-CoV2 in the genome, MERS is showing 49.60% of the polymorphism with compare to the genome of CoV2. Coronavirus reported from the Bat with accession number of NC_010438.1 shows 53.5% polymorphism in the genome compared to SARS-CoV2. Further, in Fig. 4, we have plotted Y (blue), S (gray), and R (yellow) bar graph; however, M (green), W (orange), N (light blue), and K (violet) depict line graph, and the genome length has been shown with the maroon color in bold bar graph. Taken together, these results suggest that SARS-CoV2 has less chance of mutation.
Table 3.
Meaning of the plotted data for single-nucleotide polymorphism
| Type | MN996531.1 | Query |
|---|---|---|
| Y | C | T |
| M | A | C |
| W | A | T |
| K | G | T |
| R | A | G |
| S | C | G |
| N | – | – |
Fig. 4.
Single-nucleotide polymorphism from every species with the reference. Mutations are enlisted with the count of each type (Y, W, S, R, N, M) and the percentage is calculated with the total genome length for better polymorphic analysis
Comparative Analysis of Annotations
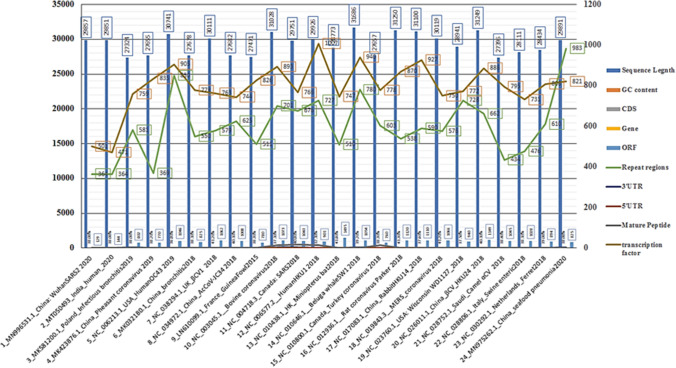
We have collected all annotations from 24 genomes of coronaviruses and plotted them for better understanding about their detail. In annotations, we are taking sequence length, GC content and count of CDS, gene, ORF, repeat regions, untranslated regions, transcription factors, and mature peptides (Fig. 5). The sequence length and GC content have taken just to compare the annotation with a valid point and putting them all together. Beluga whale is having the highest length of the genome whereas Poland-based bronchitis infection coronavirus is having the smallest size of the genome. The highest GC content (41.80%) in Bat coronavirus and UK βcoronavirus1 are 41.80% and 41.20%, respectively. The highest number of CDS is 14 which is present in Beluga whale and Canadian SARS 2018, while the lowest number of CDS is 7 which is present in Saudi Camel αCoV. The highest number of the gene is 28 and it is present in beluga whale, while the lowest number of the gene is 11 which is present in SARS-CoV2 in both Chinese and Indian sequences. Only 6 coronaviruses having the 3′UTRs which are bovine coronavirus, Canadian SARS2018, Poland-based bronchitis coronavirus, Chinese bronchitis coronavirus, Chinese seafood pneumonia, and Beluga whale coronaviruses. Only 5 species are having 5’UTR regions which are Poland bronchitis CoV, Bovine CoV, Canadian SARS2018, Beluga whale coronaviruses, and Chinese seafood pneumonia. In our reannotation procedure, we identified the transcription factor from every species (Fig. 5). Further, all the details are present in the supplementary sheet with the description from every single species for better understanding. All annotations are plotted together with line and bar graph.
Fig. 5.
A comparative plot after annotation of all the data. All genomes were having few annotations and reannotated with the locally created database and predicted
Repeat Analysis
Short-Sequence Repeat analysis
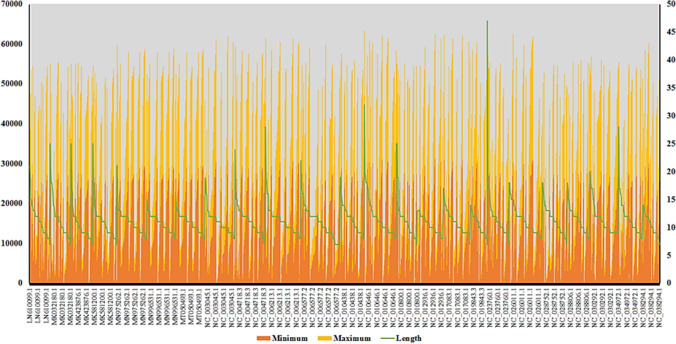
We have used Phobos to identify short-sequence repeats in the genomes of every species and plotted them accordingly. We have found a total of 1250 short-sequence repeats in the sequence of all species. The longest repeat under the SSR is 47 bp long while the smallest repeat is 7 bp long in the sequence of the 24 different genomes of coronaviruses. Short sequences are to be handled in the experimental lab as well as the computational laboratory. Designing antisense mRNA is far easier for the short-sequence repeat to tackle this virus. That could be a better strategy to find the best repeat region which might not found in the human body and targeting to its restriction site together to cut the genome of the coronavirus and that information will be saved in the T cell. Further, reoccurrence of the same virus, the memory T cells will get activated to encounter rapidly and clear it. Though there is the possibility of various complication and failure which needs huge improvements after identifying the right SSRs, we have identified the all short-sequence repeats which are further plotted with the green line. The data were first prepared in the maximum and minimum format to get the exact information of SSRs location. In Fig. 6, yellow bar shows maximum whereas reddish line shows minimum format; however, SSRs falls in between. There are few SSRs which are unique among the SARS-CoV-2 which does not exist in any species, targeting these SSRs could also be an important strategy for the breaking down mechanism. Phobos considered repeats as the same sequence as well as the complementary sequence as well. In SARS-Cov2, ‘AAGAAGAAG’ is considered as AAC repeats. In the sequence, we have found 8 AAC repeats which are found with length of 9–11 bp. A trinucleotide repeats have been found with the length of 9 bp. These repeats found at 614–622 and 22,308–22,316 positions of the genome.
Fig. 6.
Repeat region of genomes with specific identification to the short repeats for specific drug base target identifications; the green line is showing the length concerning the species accession. Yellow and red magenta are plotted for getting the betweenness of the data
Long-Sequence Repeats Analysis
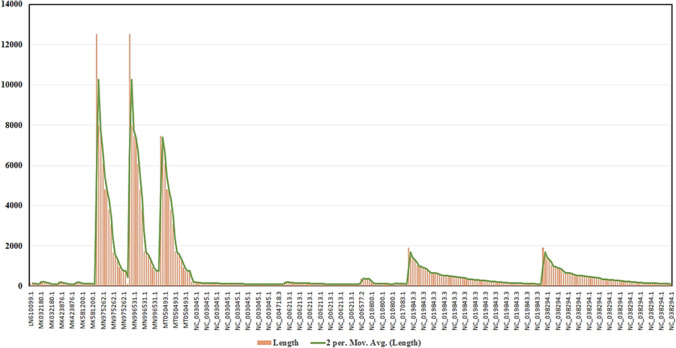
Long-sequence repeats (LSR) analysis was performed using Geneious default program to identify the location. We have identified a total of 311 long-sequence repeats and 12,536 bp sequence was the longest among all repeat regions from the MN975262.1 which is the Chinese seafood pneumonia virus. The shortest LSR is 100 bp long which is from 2 species, NC_003045.1 (Bovine coronavirus) and NC_006213.1 (Human HKU1 2018 coronavirus). SARS-CoV-2 (MN996531.1) is having total of 15 LSRs. Total 59,404 bp sequence length is falling under the LSRs. All other sequences are in between the length of 12,536 and 100 bp. There are many LSR in a single sequence which we have plotted in Fig. 7 with the bar graph for better visualization view of LSR length with respective species. MERS coronavirus is having total of 63 long-sequence repeats. The longest repeat in this genome is 1911 bp long and it found at the position of 20,849–22,759. These LSR will be helpful in the categorization of the genome and the repeat of long sequence will also provide the gap among the genome to cut it specific position and reduce the antigenic protein formation. Collectively, we have plotted the data for complete understanding with its length and the accessions. Further, we have provided the data of the sequence and the positions in the supplementary excel sheet.
Fig. 7.
Repeat region with specific to the higher sequence length, long-sequence repeats (LSR) is extracted. The green line is plotted for the average identification and getting and closer view on data forecasted
UTR Regions of Genomes
In molecular biology, an untranslated region alludes to both of the two segments, one on each side of a coding sequence of mRNA strand. When it is present on the 5′ side, it is called the leader sequence and whenever it is located on the 3′ side, it is called the trailer sequence (3′ UTR) [27, 28]. The mRNA is initially transcribed from the corresponding DNA sequence and then translated into protein. However, several regions of the mRNA are usually not translated into protein, including the 5′ and 3′ UTRs. We have identified and differentiated into 3′ and 5′ untranslated regions of the genome. We have identified total 6, 3′UTRs and total of 5, 5′UTRs. The length of 3′UTR is 401–149 base pairs which are found in 24_MN975262.1_China_seafood pneumonia 2020, 14_NC_010646.1__Beluga whale SW1_2018, 11_NC_004718.3_Canada_SARS2018,10_NC_003045.1__Bovine_CV2018,6_MK032180.1 China Bronchitis 2018, 3_MK581200.1_Poland_Infectious bronchitis 2019, while the 5’UTRvaries in length with maximum and minimum of 523-210 bp long which are found in 3_MK581200.1_Poland_Infectious bronchitis2019, 10_NC_003045.1__Bovine coronavirus2018, 11_NC_004718.3_Canada: SARS2018, 14_NC_010646.1__Beluga whaleSW1 2018, 24_MN975262.1_China_seafood pneumonia2020. Further, we have plotted the data in sunburst plot in Fig. 8 for comparative analysis of size and species which are containing the UTR and its type. We have also depicted the length and the respective name of the UTR with the accession number in sunburst plot of the data. These UTRs from the above species will be helpful in categorization of the genomic data into the fully functional and nonfunctional range to further accelerate the translational analysis.
Fig. 8.
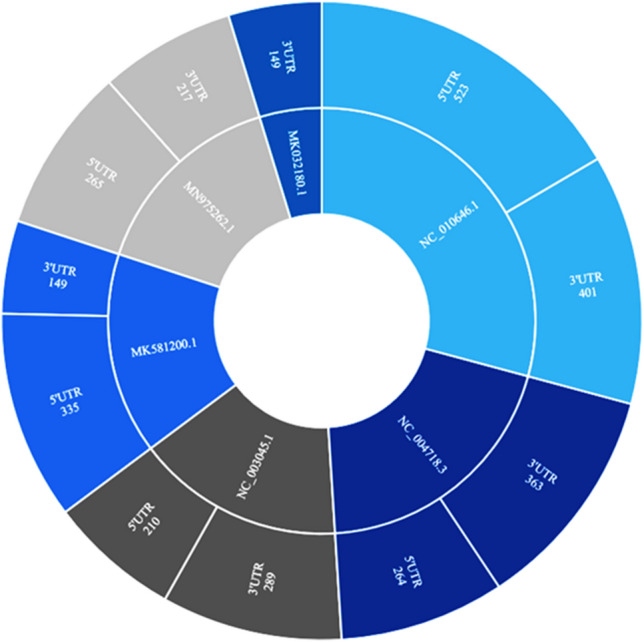
Untranslated regions (UTRs) are identified and reannotated from the locally created database. The length of the region with specific to 3′ and 5′ UTR is represented with respect to the few species
Analysis of Transcription Factors
In molecular biology, sequence-specific DNA-binding factor is called transcription factor (TF) which is a protein that controls the rate of transcription of genetic information from DNA to messenger RNA, by binding to a specific DNA sequence [29]. The function of TFs is to regulate and turn on and off genes to make sure that they are expressed in the right cell at the right time and in the right amount throughout the life of the cell and the organism [30, 31]. The replication and increase in copy numbers of virus in the human body are led by the transcription factors, so blocking TFs could be also a mechanism to tackle the pandemic but having huge complications and limitations. Transcription factors contain at least one DNA-binding domain (DBD), which attaches to a specific sequence of DNA adjacent to the genes that they regulate the functionality of the gene and further it grouped only because of this feature. TFs work alone or with other proteins in a complex, by acting as an activator, or as a repressor of the recruitment of RNA polymerase to specific genes. We have identified a total of 2509 transcriptional factor. There are 84 transcriptional factors are uniquely identified from all 24 species. Length of the transcriptional factors is varying from 19 to 10 bp. All genomes contain mostly similar type of TF and having similar and mismatch in the length as well. We have plotted the data into sunburst plot with the respective length to identify the length differences. All species are containing the TF with exceptional features and the enormous quantity, which could be a great target subject for designing the drug after identification of a unique one. In Fig. 9, we have added the name of the TF and the length together to get a comparative visualization of the data. These transcriptional factors will be helpful for the experimental laboratories working in the area of gene-based drug design to directly stop the mechanism of replication in viruses.
Fig. 9.
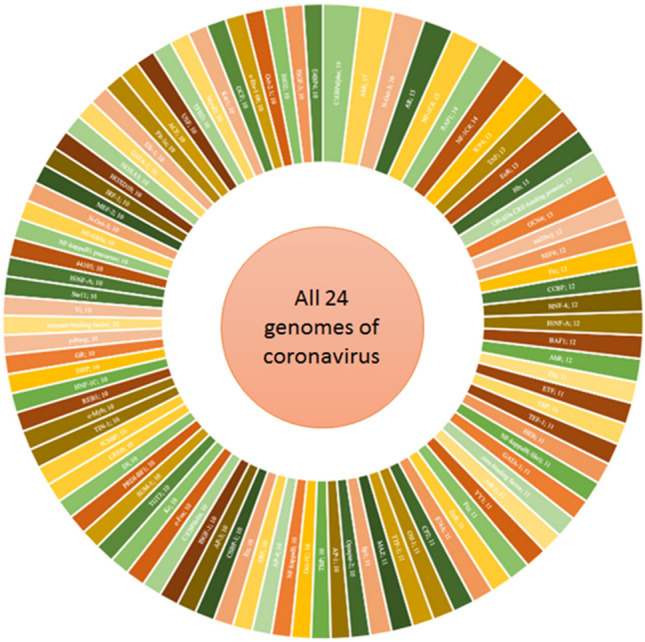
Transcriptional factor; data annotated from the local database and predicted, all the genomes are having the transcriptional factor, but the size of the transcriptional factors and its repeat varied in different genomes. This plot enlists all the transcriptional factors together for further studies with specific to drug response on a specific location. The maximum length of the TF is 19 bp and the smallest is 10 bp
Analysis of Matured Peptides
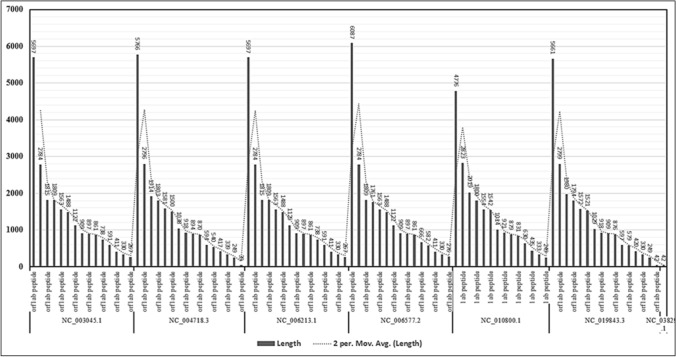
Mature peptides that control infection, including its replication, transmission, pathogenicity, and host immunologic reactions. The first open reading frame (orf1a/1b) translates two polyproteins, pp1a and pp1ab, and encodes 16 nonstructural proteins (NSP) [32–34]. After translation, this polyprotein is processed by viral proteases into mature peptides. We have tried to predict mature peptide sequence from the whole genome of 24 coronaviruses and have gotten the mature peptides from only 7 coronaviruses. The length of the mature peptides varies from species to species. There are only two types of mature peptides which are repeated with the difference of the length and the positions. A mature peptide from all species orf1ab is having the longest sequence length of 6087 bp and the smallest length of 39 bp, while the mature peptide from NC_010800.1_Canada_Turkey coronavirus 2018 1ab is having the longest length of 19,503 bp and the smallest length of 529 bp. Moreover, mature peptide 1ab is only present in NC_010800.1 (Canada-Turkey coronavirus2018). In NC_038294.1 (UK beta coronavirus), there is only one mature peptide with the length of 42 base pairs and it is found at the position of 13,409–13,450. Further, we have plotted the data in Fig. 10 with the accession number and the name of the peptide with their respective length. Targeting the mature peptides could also be one of the aspects of drug design which may provide a significant way of testing a drug.
Fig. 10.
Predicted mature peptides from the genomes of the coronavirus which is specific to the species and the peptide name and its length; name of the peptide is repetitive because of high SSR and LSR in every species
Phylogeny
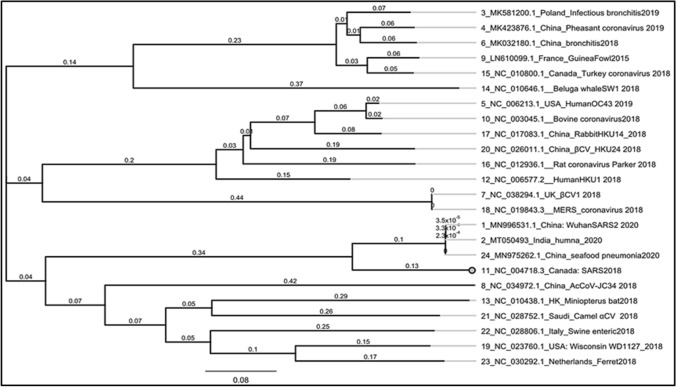
We have analyzed all the various functionalities and structures of the genomes and after that aligned the data using MAFFT [14, 15] and then performed the phylogeny using Geneious Tree builder (Fig. 12). The phylogenetic tree was further modified using the iTOL server for getting a clear view and the node distances as well (Fig. 11). As the tree shows that Beluga whale is the outer species in the tree, all 3 strains of SARS-CoV2 (2 from China and one from Kerala India) come under the same clade and NC_004718.3_Canada: SARS2018 is one of the closest species among the 24 considered genomes and plotted in the yellow color. Miniopterus bat (NC_010438.1) coronavirus is not linked or not even in the same clade; it is present under another clade of the tree and plotted in cyan color. SARS-CoV2 genomes are falling in the same clade and further depicted in green color in the circular phylogenetic tree. UK_βCV1 and MERS coronavirus are in the same clade and plotted it with the red color. In Fig. 12, we have also provided additional information and linear phylogenetic tree for understanding the difference and the divergence of the spices with the clade length.
Fig. 12.
Liner phylogenetic tree for the reference
Fig. 11.
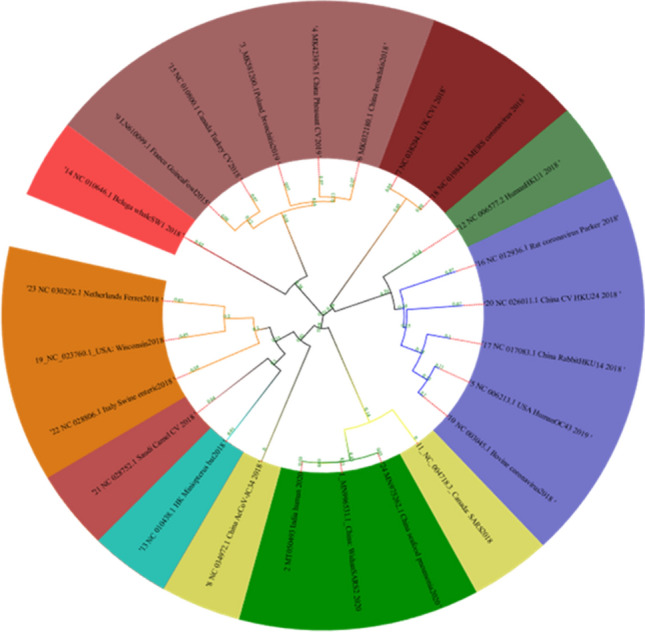
Phylogenetic tree of the 24 coronaviruses under consideration, all human infection SARS are colored in the range of the violet. Branch length annotated on the nodes of the tree for visual identification of divergence
Discussion and Conclusion
The main aim of this study was to take the genomes of coronaviruses from different geographical locations as well as different host to infer the genomic similarity and dissimilarity in addition to the functional understanding of the genome. We have done various analyses regarding the genomes of different coronaviruses which may cause severe respiratory disease and ultimately death. Our deep analysis to the all annotations and extraction of the data (details provided in excel sheets) provide us various interesting facts and strategies to work on few steps for further research to unveil the attacking site within the genome.
Our wide focused analysis of the genome annotations gives an intense view on the genome from a different angle which will be easier to identify the region of the genome and GC content with AT graph, CpG islands, transcriptional factors, and most importantly the region of gene contents and responsible ORF as well. We have also predicted the restrictions sites on the genome in particular to the map for getting the diverge view on that matter and to help future researchers. The length comparison of all the coronaviruses also gives an important fact that the number of genes and other annotations contains within the genomes with base pairs. Analysis of the distance between all the species gives a contrasting view to focus on the coronavirus and the percentage of similarity which means the data of other query species are sharing the either very high or medium amount of genome data.
We have aligned all the genome separately with the reference species SARS-CoV2 (MN996531.1) to get the similarity and single-nucleotide polymorphism, which finally revealed that SARS-CoV2 does not have a huge rate of mutations in a gap of few months but it has a wide difference with other coronaviruses infecting animals and the same result was already inferred by the distance matrix which shows almost 99.97% similarity with the SARS-CoV2. NC_004718.3 reported from Canada in 2018 is having the similarity of 79.047% which is highest among after CoV2 while MERS is showing 35.4% of genome similarity. There are only 8 mutations in the SARS-CoV2 reported from India and China. In details, such as 6 SNPs found on the orf1ab gene, 1 SNP at S gene and 1 SNP at NS8 gene at the position of 28,131. NS8 is the main coding region of the protein which codes for the infectious part of the protein. MERS coronavirus is showing the 15,762 mutations which is 49.60% of the total genome. Coronavirus reported from Canada in 2018 is having a total of 6274SNPs which is 20.9% of the whole genome. Further, we have taken the count of the annotations to get the comparison among all which also reveals a huge difference with other old coronaviruses but like the SARS-CoV2 which means the 8 SNPs are almost negligible while translating the data of genome in the process of protein formation.
Repeat analysis focuses on the short- and long-sequence repeat analysis, short-sequence analysis, and its identification in the genome of coronavirus can be utilized for drug discovery to another level. Identification of the SSRs and targeting to the SSRs can be a good step towards breaching the genome of the coronavirus, it’s a better strategy to break down the genome before it gets translated. There could be many idea and strategy on how to design antisense or directly activating the immune system to produce the antisense mRNA. Identification of long-sequence repeat is also playing a role in the different protein-producing genes and to target them specially.
In addition to the basic annotations, we have identified and extracted the data of untranslated regions from different species of coronavirus and categorized them on the behalf of 3′ and 5′ separately. There are only 6 coronavirus genomes which contain the UTR regions. Only 24_MN975262.1_China_seafood pneumonia2020 contains the UTR region which shares almost 100% similarity the Indian SARS-CoV2. Comparative annotation analysis also unveils all transcriptional factors which are directly related to the division of viruses. Directly taking the action against using specific drugs could directly stop translating the protein and ultimately T cell might automatically identify that viral particle as a foreign pathogen and cleared them from the body. TF is located at different locations of the genome. We have provided detailed information including the sequence in Fig. 9 and full details are available in the supplementary excel sheet. We have also predicted the matured peptides from the different coronaviruses which will clarify the genome complexity of the coronavirus. Phylogenetic analysis also reveals that all coronaviruses are diverse and SARS-CoV2 from china and India is found to be in the same clade. Beluga whale coronavirus is found to be one of the outliers of the all considered genomes.
The whole analysis especially SNP and phylogenetic tree suggests that the Indian SARS-CoV2 is having very less 8 mutations on its CDS region while another SARS-CoV2 reported from china is having 7 mutations with the reference species MN996531.1_China_WuhanSARS2_2020 which is almost negligible. Distance analysis between all species also suggests the same update on the genomic evolutions and modifications. NC_010438.1_HK_Miniopterus_bat-2018 coronavirus shares only 37.6% genomic content to the SARS-CoV2 which clarifies the concept that SARS-CoV2 is not originated from the miniopterus bat coronavirus (Figs. 11, 12). As the maximum amount of genomic content is shared by the NC_004718.3_Canada: SARS, which is reported from Canada in 2018, seems to be the closest species among all 24 considered coronaviruses. We have additionally identified the short-sequence repeats and their position in the genome which could be useful in the further drug development process.
Acknowledgements
The authors acknowledge with much obliged for Almanac Life Science India Pvt. Ltd. for data analysis and valuable inputs. This work is funded by the Deanship of Scientific Research at King Khalid University through the Research Project (RCAMS/KKU/003/20).
Compliance with ethical standards
Conflict of Interest
The authors declared no conflicts of interest. All the data including sequences and calculations are provided to journal as supplementary excel sheets to make it public access for the future research on this pandemic.
Footnotes
Publisher’s Note
Springer Nature remains neutral with regard to jurisdictional claims in published maps and institutional affiliations.
Change history
12/9/2021
A Correction to this paper has been published: 10.1007/s11010-021-04317-9
References
- 1.Yuen K-S, Ye Z-W, Fung S-Y, Chan C-P, Jin D-YJ. SARS-CoV-2 and COVID-19: the most important research questions. Cell Biosci. 2020;10:1–5. doi: 10.1186/s13578-020-00404-4. [DOI] [PMC free article] [PubMed] [Google Scholar]
- 2.Guo Y-R, Cao Q-D, Hong Z-S, Tan Y-Y, Chen S-D, Jin H-J, Tan K-S, Wang D-Y, Yan Y. The origin, transmission and clinical therapies on coronavirus disease 2019 (COVID-19) outbreak–an update on the status. Mil Med Res. 2020;7:1–10. doi: 10.1186/s40779-020-00240-0. [DOI] [PMC free article] [PubMed] [Google Scholar]
- 3.Chan JF-W, Yuan S, Kok K-H, To KK-W, Chu H, Yang J, Xing F, Liu J, Yip CC-Y, Poon RW. A familial cluster of pneumonia associated with the 2019 novel coronavirus indicating person-to-person transmission: a study of a family cluster. SJTL. 2020;395:514–523. doi: 10.1016/S0140-6736(20)30154-9. [DOI] [PMC free article] [PubMed] [Google Scholar]
- 4.Xu X-W, Wu X-X, Jiang X-G, Xu K-J, Ying L-J, Ma C-L, Li S-B, Wang H-Y, Zhang S, Gao H. Clinical findings in a group of patients infected with the 2019 novel coronavirus (SARS-Cov-2) outside of Wuhan, China: retrospective case series. NJB. 2020;368:m606. doi: 10.1136/bmj.m606. [DOI] [PMC free article] [PubMed] [Google Scholar]
- 5.Lai C-C, Shih T-P, Ko W-C, Tang H-J, Hsueh P-R. Severe acute respiratory syndrome coronavirus 2 (SARS-CoV-2) and corona virus disease-2019 (COVID-19): the epidemic and the challenges. Int J Antimicrob Agents. 2020;55:105924. doi: 10.1016/j.ijantimicag.2020.105924. [DOI] [PMC free article] [PubMed] [Google Scholar]
- 6.Tang X, Wu C, Li X, Song Y, Yao X, Wu X, Duan Y, Zhang H, Wang Y, Qian Z (2020) On the origin and continuing evolution of SARS-CoV-2. JNSR [DOI] [PMC free article] [PubMed]
- 7.Shafique L, Ihsan A, Liu QJ. Evolutionary trajectory for the emergence of novel coronavirus SARS-CoV-2. Pathogenes. 2020;9:240. doi: 10.3390/pathogens9030240. [DOI] [PMC free article] [PubMed] [Google Scholar]
- 8.Zhou P, Yang X-L, Wang X-G, Hu B, Zhang L, Zhang W, Si H-R, Zhu Y, Li B, Huang C-L. A pneumonia outbreak associated with a new coronavirus of probable bat origin. Nature. 2020;579:270–273. doi: 10.1038/s41586-020-2012-7. [DOI] [PMC free article] [PubMed] [Google Scholar]
- 9.Lin S-M, Lin S-C, Hsu J-N, Chang C-K, Chien C-M, Wang Y-S, Wu H-Y, Jeng U-S, Kehn-Hall K, Hou M-H. Structure-based stabilization of non-native protein-protein interactions of coronavirus nucleocapsid proteins in antiviral drug design. J Med Chem. 2020;63:3131–3141. doi: 10.1021/acs.jmedchem.9b01913. [DOI] [PubMed] [Google Scholar]
- 10.Crawshaw AD, Baslé A, Salgado PS. A practical overview of molecular replacement: clostridioides difficile PilA1, a difficult case study. Acta Crystallogr D Struct Biol. 2020;76:261–271. doi: 10.1107/S2059798320000467. [DOI] [PMC free article] [PubMed] [Google Scholar]
- 11.Gautret P, Lagier J-C, Parola P, Meddeb L, Mailhe M, Doudier B, Courjon J, Giordanengo V, Vieira VE, Dupont HT. Hydroxychloroquine and azithromycin as a treatment of COVID-19: results of an open-label non-randomized clinical trial. IJAA. 2020;56:105949. doi: 10.1016/j.ijantimicag.2020.105949. [DOI] [PMC free article] [PubMed] [Google Scholar] [Retracted]
- 12.Colson P, Rolain J-M, Lagier J-C, Brouqui P, Raoult DJ. Chloroquine and hydroxychloroquine as available weapons to fight COVID-19. IJAA. 2020;55:105932. doi: 10.1016/j.ijantimicag.2020.105932. [DOI] [PMC free article] [PubMed] [Google Scholar]
- 13.Geneious_Prime: Geneious version 2020.1 created by Biomatters. Available from https://www.geneious.com 2020.1.2: 2020
- 14.Katoh K, Standley DM. MAFFT multiple sequence alignment software version 7: improvements in performance and usability. Mol Biol Evol. 2013;30:772–780. doi: 10.1093/molbev/mst010. [DOI] [PMC free article] [PubMed] [Google Scholar]
- 15.Katoh K, Misawa K, Ki K, Miyata T. MAFFT: a novel method for rapid multiple sequence alignment based on fast Fourier transform. Nucleic Acids Res. 2002;30:3059–3066. doi: 10.1093/nar/gkf436. [DOI] [PMC free article] [PubMed] [Google Scholar]
- 16.Elizabeth Connor (2016) MJJMLA. Resour Rev 104:181
- 17.Roberts RJ, Vincze T, Posfai J, Macelis DJ. REBASE—a database for DNA restriction and modification: enzymes, genes and genomes. Nucleic Acids Res. 2010;38:D234–D236. doi: 10.1093/nar/gkp874. [DOI] [PMC free article] [PubMed] [Google Scholar]
- 18.Mayer C (2010) Phobos—a tandem repeat search tool for complete genomes. http://www.ruhr-uni-bochum.de/spezzoo/cm. In: Accessed 2018
- 19.Olsen C, Qaadri K, Moir R, Kearse M, Buxton S, Cheung M (2004) Geneious R7: a bioinformatics platform for biologists. In: International plant and animal genome conference Xxii
- 20.Letunic I, Bork P. Interactive Tree Of Life (iTOL): an online tool for phylogenetic tree display and annotation. Bioinformatics. 2007;23:127–128. doi: 10.1093/bioinformatics/btl529. [DOI] [PubMed] [Google Scholar]
- 21.Saitou N, Nei M. The neighbor-joining method: a new method for reconstructing phylogenetic trees. Mol Biol Evol. 1987;4:406–425. doi: 10.1093/oxfordjournals.molbev.a040454. [DOI] [PubMed] [Google Scholar]
- 22.Wu F, Zhao S, Yu B, Chen Y-M, Wang W, Song Z-G, Hu Y, Tao Z-W, Tian J-H, Pei Y-Y. A new coronavirus associated with human respiratory disease in China. Nature. 2020;579:265–269. doi: 10.1038/s41586-020-2008-3. [DOI] [PMC free article] [PubMed] [Google Scholar]
- 23.Palmenberg A Sgro J-Y. EMBOSS Software for sequence analysis
- 24.Rice P, Longden I, Bleasby A (2000) EMBOSS: the European molecular biology open software suite. In: Elsevier current trends [DOI] [PubMed]
- 25.Allendorf FW, Hohenlohe PA, Luikart G. Genomics and the future of conservation genetics. Nat Rev Genet. 2010;11:697–709. doi: 10.1038/nrg2844. [DOI] [PubMed] [Google Scholar]
- 26.Yadav PD, Potdar VA, Choudhary ML, Nyayanit DA, Agrawal M, Jadhav SM, Majumdar TD, Shete-Aich A, Basu A, Abraham P. Full-genome sequences of the first two SARS-CoV-2 viruses from India. IJMR. 2020;151:200–209. doi: 10.4103/ijmr.IJMR_663_20. [DOI] [PMC free article] [PubMed] [Google Scholar]
- 27.Sodhi M, Mukesh M, Kishore A, Mishra B, Kataria R, Joshi B. Novel polymorphisms in UTR and coding region of inducible heat shock protein 70.1 gene in tropically adapted Indian zebu cattle (Bos indicus) and riverine buffalo (Bubalus bubalis) Gene. 2013;527:606–615. doi: 10.1016/j.gene.2013.05.078. [DOI] [PubMed] [Google Scholar]
- 28.Cockrell AS, van Praag H, Santistevan N, Ma H, Kafri T. The HIV-1 Rev/RRE system is required for HIV-1 5'UTR cis elements to augment encapsidation of heterologous RNA into HIV-1 viral particles. Retrovirology. 2011;8:51. doi: 10.1186/1742-4690-8-51. [DOI] [PMC free article] [PubMed] [Google Scholar]
- 29.Rhodes D, Klug A. An underlying repeat in some transcriptional control sequences corresponding to half a double helical turn of DNA. Cell. 1986;46:123–132. doi: 10.1016/0092-8674(86)90866-4. [DOI] [PubMed] [Google Scholar]
- 30.Dynan WS, Tjian R (1985) Nature, Control of eukaryotic messenger RNA synthesis by sequence-specific DNA-binding proteins. 316:774–778 [DOI] [PubMed]
- 31.Qi LS, Larson MH, Gilbert LA, Doudna JA, Weissman JS, Arkin AP, Lim WA. Repurposing CRISPR as an RNA-guided platform for sequence-specific control of gene expression. Cell. 2013;152:1173–1183. doi: 10.1016/j.cell.2013.02.022. [DOI] [PMC free article] [PubMed] [Google Scholar]
- 32.Gudmundsdotter L (2009) HIV-1 immune responses induced by natural infection or immunisation. Institutionen för mikrobiologi, tumör-och cellbiologi/Department of …
- 33.Sherrill-Mix S (2015) Latency, expression and splicing during infection with HIV
- 34.Cui J, Li F, Shi Z-L. Origin and evolution of pathogenic coronaviruses. Nat Rev Microbiol. 2019;17:181–192. doi: 10.1038/s41579-018-0118-9. [DOI] [PMC free article] [PubMed] [Google Scholar]


