Abstract
As tools of plant molecular biology, fluorescence microscopy and Nicotiana benthamiana have been used frequently to study the structure and function of plant cells. However, it is difficult to obtain ideal micrographs; for example, the images are typically unclear, the inner cell structure cannot be observed under a high-power lens by fluorescence microscopy, etc. Here, we describe a method for observing the cell structure of N. benthamiana. This method significantly improves imaging by fluorescence microscopy and allows clear images to be obtained under a high-power lens. This method is easy to perform with good stability, and the stomatal structure, nucleus, nucleolus, chloroplast and other organelles in N. benthamiana cells as well as protein localizations and the locations of protein–protein interactions have been observed clearly. Furthermore, compared with traditional methods, fluorescent dye more efficiently dyes cells with this method. The applicability of this method was verified by performing confocal scanning laser microscopy (CSLM), and CSLM imaging was greatly improved. Thus, our results provided a method to visualize the subcellular structures of live cells in the leaves of N. benthamiana by greatly improving imaging under a fluorescence microscope and provided new insights and references for the study of cell structures and functions in other plants.
Supplementary Information
The online version contains supplementary material available at 10.1007/s12298-021-00931-5.
Keywords: Tobacco, Fluorescence microscopy, Staining, Bimolecular fluorescence complementation (BiFC), Method
Introduction
In recent years, great importance has been continuously paid to N. benthamiana as a tool of plant molecular biology. Especially in the research fields of protein localization and protein–protein interactions based on plant systems (Bally et al. 2018; Cavallari et al. 2018; Du et al. 2015; Goodin et al. 2008; Liu et al. 2018; Sade et al. 2018; Wu et al. 2019; Zhang et al. 2019; Zou et al. 2018).
Combined with the application of microscopic techniques, plant research methods have been completely changed, thus providing great convenience for people seeking the mysteries of plant science. The popularity of light microscopy in biological research is increasing as the emergence of labelling specific molecules and cells by the development of various staining methods (Huang et al. 2010). Identically, the fluorescence microscopy is obtained widespread utilization as the molecule-specific contrast and live-cell imaging is combined (Huang et al. 2010).
However, the disadvantage of immunofluorescence is that it is usually requires permeabilized cells or endocytosed or extracellular proteins (Giepmans et al. 2006). This also leads to unclear cell structure imaging of N. benthamiana by fluorescence microscopy. Particularly under a high-power lens, the imaging background is very deep and fuzzy and subcellular structures are difficult to identify. Moreover, unclear images will cause the misjudgment of research results.
It is also important that dyes, such as DAPI (4,6-diamidino-2-phenylindole) and DiOC6 (3,3′-dihexyloxacarbocyanine iodide) are often used in these experiments to mark the location of nuclei or the endoplasmic reticulum (Kapuscinski 1995; Terasaki 1989). However, this approach increases the time and cost to detect each fluorescent signal (Bally et al. 2018).
In most cases, there are some ways to obtain high-quality images, such as the use of CSLM or other expensive equipment, complex experiments including the isolation of protoplasts or separation of the sub-epidermis of the N. benthamiana cell, etc. However, most laboratories are not equipped for CSLM, and complex experiments are time-consuming and laborious, and the result is unsatisfactory.
To overcome the above disadvantages, we report a convenient method for obtaining high-magnification and high-resolution cell images of N. benthamiana by fluorescence microscopy.
Materials and methods
Plant materials
In this study N. benthamiana was grown in the culture room under long-day conditions (16 h light/8 h dark) at 22 °C. When the 6th leaves emerged the experiments including subcellular localization and BiFC analysis were conducted. The 2nd–4th leaves were selected for the experiments. The same leaves were used in both the treatment and control groups in a single experiment.
Subcellular localization and BiFC analysis
The vectors used in this study included 35S:EdFT/EdFD1-GFP, 35S:EdFT-cYFP and 35S:nYFP-EdFD1 (Zhang et al. 2016). The plasmids were localized into Agrobacterium tumefaciens strain GV3101::psoup. Subcellular localization and BiFC analysis were accomplished by observing the Agrobacterium-mediated transient transformation of N. benthamiana leaves (Sparkes et al. 2006). Fluorescence signals were detected using Observer D1 (Zeiss, Germany) and LSM 800 (Zeiss, Germany) fluorescence microscopes.
Data analysis
Statistical analysis of fluorescently stained nuclei numbers was performed using Image Pro-Plus 6.0. Significant differences between data were evaluated by Student’s t-test. Calculations were carried out using GraphPad Prism 6 software.
Procedures and experimental principle
The procedures of this method were as followed:
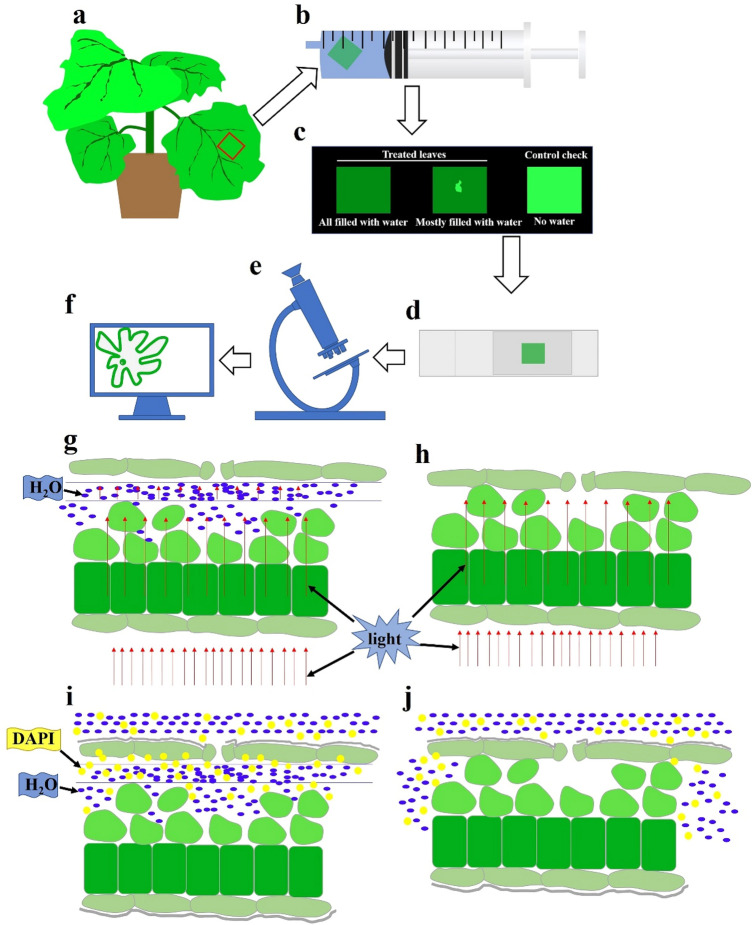
The size of 1 cm × 1 cm of the same leaf was taken (Fig. 1a).
-
The treatment groups:
The leaves were placed in the 20 mL syringe, sucked about 6–7 ml (1/3 volume) DDW (double distilled water) (Fig. 1b). The needle opening of syringe was closed with a finger or other objects, then pulled the syringe piston to create vacuum or ultra-low pressure inside the syringe barrel. This can drain out the air from the space of the lower epidermis cell, and the DDW will fill or almost fill the cell space (Fig. 1b, c) (The partial DDW filling was better to identify the upper epidermis and lower epidermis). The control groups were not neither vacuumed and injected with DDW.
-
Slides preparations:
The leaf with abaxial surface facing up kept on the slide with 10-20 ul DDW and then covered with a cover slide (Fig. 1d). The staining can be done before slides making or after the target signal was observed. The staining effect would be better if the abaxial leaf surface was facing down. Washed the leaf with sterile PBS or saline, for observation.
-
Observed by fluorescence microscope and obtain the images (Fig. 1e, f).
Experimental principle (Fig. 1g):
The water layer was to separate the lower epidermis. This will reduce interference of mesophyll and upper epidermis on imaging, and shows the viewing field of a monolayer cell (Fig. 1g, h), to obtain a high-magnification and high-resolution cell image. In addition, the water layer also helps the fluorescent dye DAPI to reach the lower epidermis cells [staining for 3–5 min, the working concentration of DAPI stain solution was 100 ng/ml, the experiment was in accordance with the manufacturer’s instructions (Sangon Biotech Co., Ltd, China)], avoiding the obstruction of the stratum corneum, so more cells can be stained in a shorter time (Fig. 1i).
Fig. 1.
The flowchart and the principle of this method. a–f The procedures of this method. g The schematic diagram of the leaf structure after treatment, the space between lower epidermis (the upper side of the diagram) and the mesophyll tissue is filled with water. h The schematic diagram of the leaf structure of the control groups. i The schematic diagram of the leaf structure after treatment stained with DAPI. j The schematic diagram of the leaf structure of the control groups stained with DAPI. The red arrows indicate the light direction. Blue-dots represent water, yellow-dots represent DAPI, and gray lines on the epidermis represent the stratum corneum (color figure online)
Results
Obtaining high-magnification and high-resolution cell images
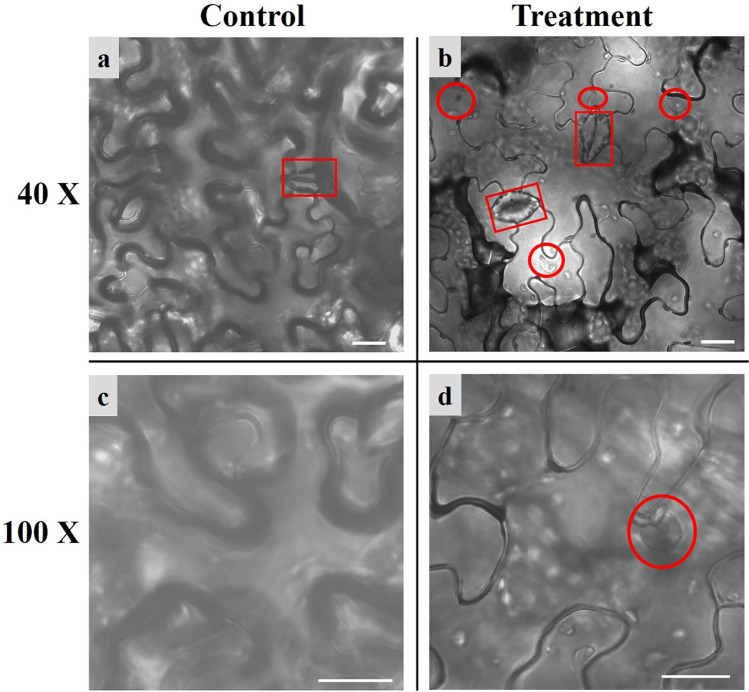
Our goal was to obtain high-magnification and high-resolution cell images of N. benthamiana, the bright-field images of the control and treatment groups were obtained by using fluorescence microscopy with a high-power lens (40× objective lens and 100× oil immersion objective lens) (Fig. 2).
Fig. 2.
Cell structure images of N. benthamiana using fluorescence microscope. a Microscopic bright field of the lower epidermis from control groups under a 40× objective lens. b Microscopic bright field of the lower epidermis from treatment groups under a 40× objective lens. c Microscopic bright field of the lower epidermis from control groups under a 100× oil immersion objective lens. d Microscopic bright field of the lower epidermis from treatment groups under a 100× oil immersion objective lens. The cytoarchitecture in the red frames are stomata; the red circle shows the nucleus, and the nucleolus is dark gray in the center of the nucleus; the white bars indicate the scale (20 µm) (color figure online)
Images of control groups are shown in Fig. 2a, c: the images are blurry, the space between cells is not obvious, the stomata are unclear, and the inner structures of the cells could not be observed under a 40× objective lens (Fig. 2a). Under a 100× oil immersion objective lens, the images are blurrier, and the cell outlines are almost invisible (Fig. 2c).
Images of the treatment groups are shown in Fig. 2b, d: the images are clear, the space between cells is obvious, the stomata are clearly visible, and, more importantly, the nucleus can be observed clearly under a 40× objective lens (Fig. 2b); under a 100× oil immersion objective lens, the nucleolus can be observed clearly, furthermore, the other organelles in the cell (the little white spots in the image) can be observed directly (Fig. 2d). The results show that the treatment can effectively avoid the interference from the mesophyll and upper epidermis on imaging, and greatly improve fluorescence microscopy image quality.
Greatly improved efficiency of DAPI staining
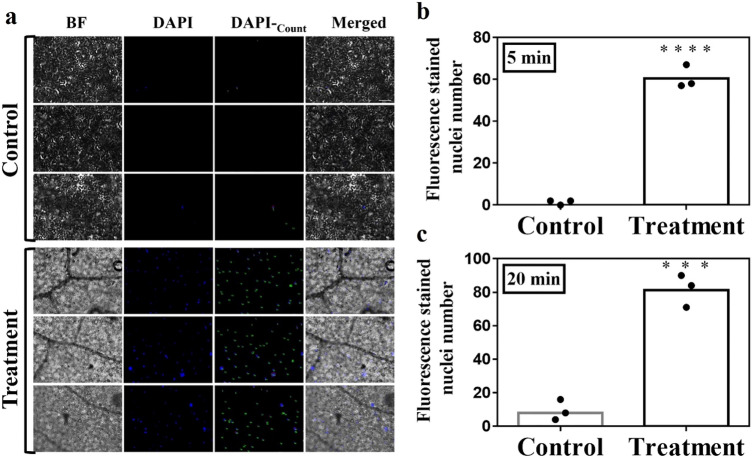
Most of the time, subcellular localization must be verified, so various fluorescent dyes were used in this study to assist with verification. The method described here significantly shortened the staining time. Within 5 min of staining with fluorescent dyes, we found through microscopy that most of the nuclei had been stained in the treatment groups, and the fluorescence signal was very strong, while the fluorescent signal was almost invisible in the control groups (Fig. 3a, b). However weak fluorescence signals were detected from a few nuclei after 20 min in the control group (Fig. 3b, Supplementary Fig. A1). These fluorescence signals were mainly located at the edge (Supplementary Fig. A1). The water layer increased the contact area between the fluorescent dye and the lower epidermis, avoiding obstruction of the stratum corneum, so that the fluorescent dye could stain more cells in a shorter time (Fig. 1i, j).
Fig. 3.
Images and data statistics of DAPI-stained nuclei. a Luminescence image of DAPI staining after 5 min in control groups and treatment groups. b Fluorescence-stained nuclei numbers of control and treatment groups after DAPI staining for 5 min. c Fluorescence-stained nuclei numbers of control and treatment groups after DAPI staining for 20 min. BF, bright-field; DAPI (4,6-diamidino-2-phenylindole) indicates nuclear localization, the working concentration of DAPI stain solution is 100 ng/ml.; DAPI-Count indicates fluorescence stained nuclei numbers as performed using Image Pro-Plus 6.0; Merged, merged image of BF and DAPI; The white bar indicates the scale (100 µm); ****p < 0.0001; ***p = 0.0004, by Student’s t-test
Subcellular localization and BiFC analysis
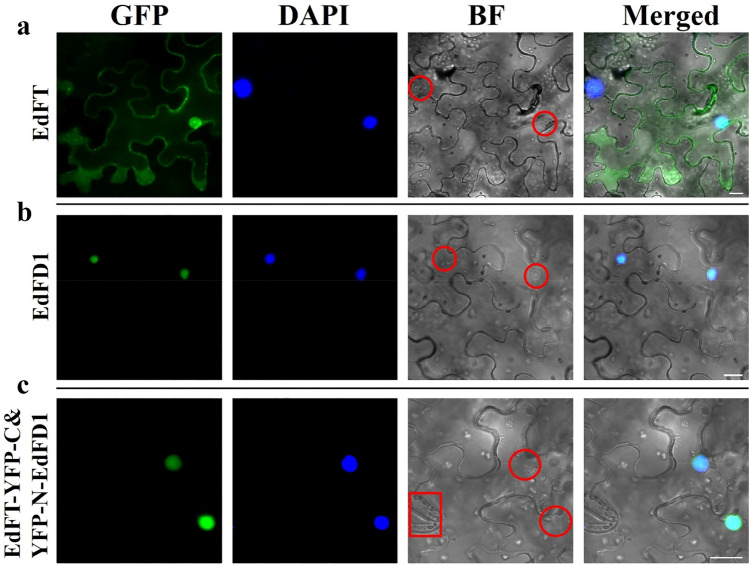
To verify the usefulness of this approach, the vectors 35S:EdFT-GFP, 35S:EdFD1-GFP, 35S:EdFT-cYFP and 35S:nYFP-EdFD1 were constructed (Zhang et al. 2016) and transiently expressed in N. benthamiana leaf epidermal cells. We obtained high-quality images under fluorescence microscopy. The results showed that EdFT was localized in the nucleus and cytoplasm, while EdFD1 was located in the nucleus (Fig. 4a, b). EdFT and EdFD1 interacted in the nucleus (Fig. 4c), which is consistent with the results of Zhang’s study (Zhang et al. 2016). Furthermore, the nuclei and stomata, as well as other subcellular structures (white dots), were clearly visible in bright-field images.
Fig. 4.
Subcellular localization and BiFC analysis of EdFT and EdFD1. a EdFT-GFP localization. b EdFD1-GFP localization. c BiFC system analysis of the protein interaction between EdFT and EdFD1 in N. benthamiana leaf lower epidermal cells. Live-cell imaging was performed by fluorescence microscopy after 2 days of transient transformation. The cytoarchitecture in the red frames are stomata; the red circle shows the nucleus; GFP, GFP fluorescence; BF, bright-field; DAPI (4,6-diamidino-2-phenylindole) indicates nuclear localization; Merged, merged image of GFP, BF and DAPI; The white bar indicates the scale (20 µm) (color figure online)
The improvement of CSLM image quality
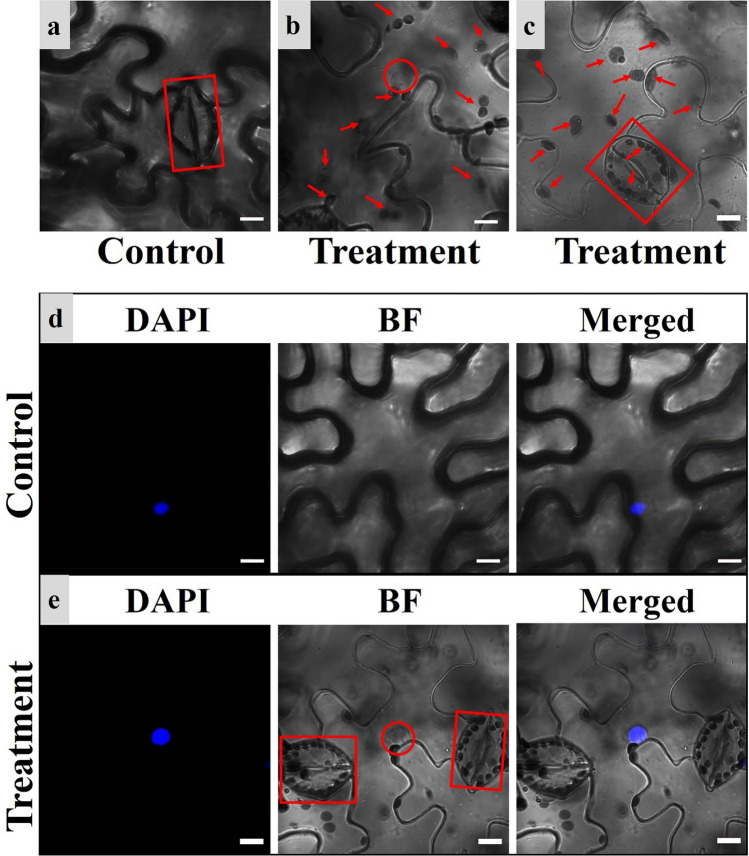
As evident from the fluorescence microscopy results, this approach improved CSLM image quality. The treatment improved the image resolution. Compared with the control groups (Fig. 5a, d), the treatment groups (Fig. 5b, c, e) are more clear and The inner cell structures, including nucleus (red circle in Fig. 5b, DAPI-stained area in Fig. 5e), and stomata (Fig. 5c, e) can be clearly seen, while only the cell outlines were visible in the control groups, and the inner cell structures were also invisible.
Fig. 5.
Images of the treatment groups and control groups under CSLM. a, d Images of the control groups. b, c, e Images of the treatment groups. The cytoarchitecture in the red frames are stomata; the red circle shows the nucleus; the red arrows point to the subcellular structures of other organelles; The cytoarchitecture in the red frames are stomata; the red circle shows the nucleus; BF, bright-field; DAPI (4,6-diamidino-2-phenylindole) indicates nuclear localization; Merged, merged image of BF and DAPI; the white bars indicate the scale (10 µm) (color figure online)
In addition, the cell structures were observed under fluorescence microscope (40× and 100× objective lens) and CSLM (40× and 63×). The organelles were also seen under the bright-field images of the treatment groups (Fig. 2b, d; white or gray blots in Fig. 4; arrows pointing in Fig. 5b, c; black blots in Fig. 5e) but not in the control groups.
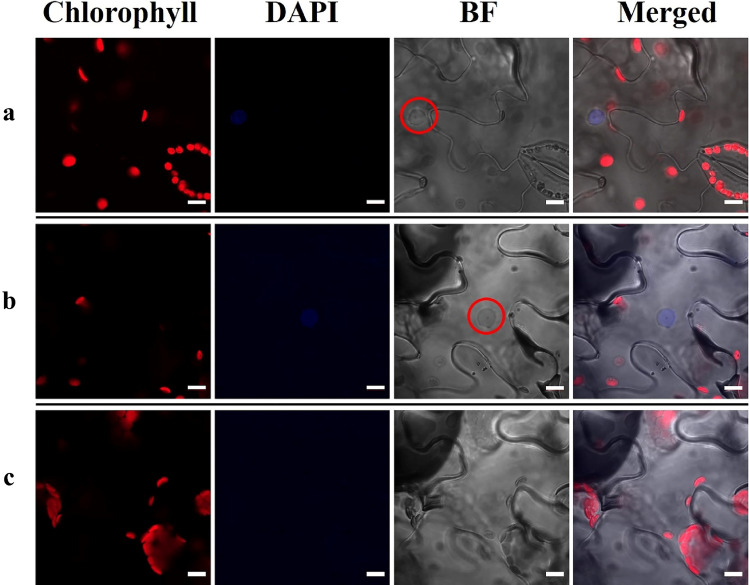
We observed organelles of the treatment groups under the chlorophyll A (red) channel. The subcellular structures that emitted red fluorescence were identified as chloroplasts (Fig. 6a, b, c). Interestingly, as we zoomed in, we could see a large number of chloroplasts attached to the membrane of a vacuole (Fig. 6c). This result indicated that the distribution of chloroplasts in N. benthamiana leaf epidermal cells is not uniform, but they are mainly distributed around the membrane. Additionally, of interest, we found that the nucleus and other organelles were moving inside the cell (Video A1, A2). This discovery may provide another research strategy to study the mode of plant protein transportation or interaction.
Fig. 6.
Images of treatment groups by CSLM. a The structures of stomata, nuclei and chloroplasts. b Images of the treatment groups by CSLM. c Zoomed-in image of b by CSLM. The red circle shows the nucleus; Chlorophyll, chlorophyll A (red) channel; BF, bright-field; DAPI (4,6-diamidino-2-phenylindole) indicates nuclear localization; Merged, merged image of Chlorophyll, BF and DAPI; the white bars indicate the scale (10 µm) (color figure online)
Discussion
Our research shows that this method can greatly improve fluorescence microscopy and CSLM image quality. Additionally, this method can easily identify certain cellular structures or target molecules in living cells, thus allowing the experimenter to verify his or her findings more effectively, which will bring great advantages to the study of plant cell biology.
Most fluorescent dyes are highly toxic and expensive but are widely used to ensure the accuracy of experiments. Moreover, the leaf tissues stained by traditional methods are often water-soaked during imaging, leading to suboptimal micrographs (Bally et al. 2018). However, by using the approach in this study, the nucleus, chloroplasts, and other organelles were observed without staining, which means that the use of dyes will be reduced or avoided in the future.
Only DAPI was applied in our experiment and was mainly used to identify proteins localized in the nucleus. However, some proteins are encoded by cytoplasmic-specific genes, such as those located in chloroplasts, mitochondria, endoplasmic reticulum, etc. Previous research results show that Janus Green B (3-Diethylamino-7-(4-dimethylaminophenylazo)-5-phenylphenazinium chloride) can be used for mitochondrial staining (Lazarow and Cooperstein 1953), DiOC6 (3,3′-Dihexyloxacarbocyanine iodide) and Bodipy PC (1,2-bis-(4,4-difluoro-5,7-dimethyl-4-bora-3a,4a-diaza-sindacene-3-undecanoyl)-sn-glycero-3-phosphocholine) can be used to stain the endoplasmic reticulum (Duckett and Read 1991; Foissner 2009). By fluorescence microscopy, it is not easy to achieve location accuracy in studies of protein localization and protein–protein interaction studies; however, this approach provides the possibility of performing such studies.
We used water as the medium to fill the intercellular space in our experiment, can other mediums also be applied? A new medium may bring a breakthrough in microscopic imaging. In addition, the plant material that we used in the experiment is N. benthamiana; if we use Arabidopsis, Lycopersicum esculentum, Oryza sativa or other plants, can this method be applied, or improved? All these questions need to be identified and addressed in the future.
Conclusions
This method greatly improves the imaging effect of the microscope and can visualize the subcellular structure of living cells in the leaves of N. benthamiana. At the same time, it has been found that the staining efficiency of fluorescent dyes has greatly improved. The traditional method requires nearly 30 min to stain, and the stained-cells are not uniform; however, the method needs only 5 min to stain most epidermis cells uniformly. This method provided a new choice for experiments and plant molecule research, it is time-saving, labor-saving, and easy to operate.
Supplementary Information
Below is the link to the electronic supplementary material.
Fig. A1 Luminescence image of DAPI staining after 20 min in control groups and treatment groups (DOCX 410 KB)
Video. A1 Shows the movement of the nucleus within the cell (AVI 19033 KB)
Video. A2 Shows the movement of the organelle within the cell (AVI 24833 KB)
Acknowledgements
We are grateful to the laser confocal microscope provided by the Key Laboratory of Innovation and Utilization of Horticultural Crop Resources in South China (Ministry of Agriculture), and we thank American Journal Experts for their language editing services for this manuscript and Miss Hanhan Xie for her help in using the laser confocal microscope.
Funding
This study was supported by the National Key Research and Development Program (2019YFD1000200), the Key Areas of Science and Technology Planning Project of Guangdong Province (2018B020202011), China Scholarship Council (201807630019).
Compliance with ethical standards
Conflict of interest
The authors declare that they have no conflict interests.
Footnotes
Publisher's Note
Springer Nature remains neutral with regard to jurisdictional claims in published maps and institutional affiliations.
Yuanyuan Jiang and Jiangrong Peng have contributed equally to this work.
References
- Bally J, et al. The rise and rise of Nicotiana benthamiana: a plant for all reasons. Annu Rev Phytopathol. 2018;56:405–426. doi: 10.1146/annurev-phyto-080417-050141. [DOI] [PubMed] [Google Scholar]
- Cavallari N, Nibau C, Fuchs A, Dadarou D, Barta A, Doonan JH. The cyclin-dependent kinase G group defines a thermo-sensitive alternative splicing circuit modulating the expression of Arabidopsis ATU2AF65A. Plant J. 2018;94:1010–1022. doi: 10.1111/tpj.13914. [DOI] [PMC free article] [PubMed] [Google Scholar]
- Du Y, Berg J, Govers F, Bouwmeester K. Immune activation mediated by the late blight resistance protein R1 requires nuclear localization of R1 and the effector AVR1. New Phytol. 2015;207:735–747. doi: 10.1111/nph.13355. [DOI] [PubMed] [Google Scholar]
- Duckett JG, Read DJ. The use of the fluorescent dye, 3,3'-dihexyloxacarbocyanine iodide, for selective staining of ascomycete fungi associated with liverwort rhizoids and ericoid mycorrhizal roots. New Phytol. 1991;118:259–272. doi: 10.1111/j.1469-8137.1991.tb00976.x. [DOI] [PubMed] [Google Scholar]
- Foissner I. Fluorescent phosphocholine—a specific marker for the endoplasmic reticulum and for lipid droplets in Chara internodal cells. Protoplasma. 2009;238:47–58. doi: 10.1007/s00709-009-0072-5. [DOI] [PubMed] [Google Scholar]
- Giepmans BN, Adams SR, Ellisman MH, Tsien RY. The fluorescent toolbox for assessing protein location and function. Science (80-) 2006;312:217–224. doi: 10.1126/science.1124618. [DOI] [PubMed] [Google Scholar]
- Goodin MM, Zaitlin D, Naidu RA, Lommel SA. Nicotiana benthamiana: its history and future as a model for plant-pathogen interactions. Mol Plant Microbe Interact. 2008;21:1015–1026. doi: 10.1094/Mpmi-21-8-1015. [DOI] [PubMed] [Google Scholar]
- Huang B, Babcock H, Zhuang X. Breaking the diffraction barrier: super-resolution imaging of cells. Cell. 2010;143:1047–1058. doi: 10.1016/j.cell.2010.12.002. [DOI] [PMC free article] [PubMed] [Google Scholar]
- Kapuscinski J. DAPI: a DNA-specific fluorescent probe. Biotech Histochem. 1995;70:220–233. doi: 10.3109/10520299509108199. [DOI] [PubMed] [Google Scholar]
- Lazarow A, Cooperstein SJ. Studies on the mechanism of Janus green B staining of mitochondria. I. Review of the literature. Exp Cell Res. 1953;5:56–69. doi: 10.1016/0014-4827(53)90094-9. [DOI] [PubMed] [Google Scholar]
- Liu J, et al. Suppression of OsMDHAR4 enhances heat tolerance by mediating H2O2-induced stomatal closure in rice plants. Rice (NY) 2018;11:38. doi: 10.1186/s12284-018-0230-5. [DOI] [PMC free article] [PubMed] [Google Scholar]
- Sade N, Umnajkitikorn K, Rubio Wilhelmi MDM, Wright M, Wang S, Blumwald E. Delaying chloroplast turnover increases water-deficit stress tolerance through the enhancement of nitrogen assimilation in rice. J Exp Bot. 2018;69:867–878. doi: 10.1093/jxb/erx247. [DOI] [PMC free article] [PubMed] [Google Scholar]
- Sparkes IA, Runions J, Kearns A, Hawes C. Rapid, transient expression of fluorescent fusion proteins in tobacco plants and generation of stably transformed plants. Nat Protoc. 2006;1:2019–2025. doi: 10.1038/nprot.2006.286. [DOI] [PubMed] [Google Scholar]
- Terasaki M. Fluorescent labeling of endoplasmic reticulum. Methods Cell Biol. 1989;29:125–135. doi: 10.1016/S0091-679X(08)60191-0. [DOI] [PubMed] [Google Scholar]
- Wu B, Cao X, Liu H, Zhu C, Klee H, Zhang B, Chen K. UDP-glucosyltransferase PpUGT85A2 controls volatile glycosylation in peach. J Exp Bot. 2019;70:925–936. doi: 10.1093/jxb/ery419. [DOI] [PMC free article] [PubMed] [Google Scholar]
- Zhang L, Yu H, Lin S, Gao Y. Molecular characterization of FT and FD homologs from Eriobotrya deflexa Nakai forma koshunensis. Front Plant Sci. 2016;7:8. doi: 10.3389/fpls.2016.00008. [DOI] [PMC free article] [PubMed] [Google Scholar]
- Zhang L, et al. Functional characterization of GI and CO homologs from Eriobotrya deflexa Nakai forma koshunensis. Plant Cell Rep. 2019;38:533–543. doi: 10.1007/s00299-019-02384-3. [DOI] [PubMed] [Google Scholar]
- Zou S, Wang H, Li Y, Kong Z, Tang D. The NB-LRR gene Pm60 confers powdery mildew resistance in wheat. New Phytol. 2018;218:298–309. doi: 10.1111/nph.14964. [DOI] [PubMed] [Google Scholar]
Associated Data
This section collects any data citations, data availability statements, or supplementary materials included in this article.
Supplementary Materials
Fig. A1 Luminescence image of DAPI staining after 20 min in control groups and treatment groups (DOCX 410 KB)
Video. A1 Shows the movement of the nucleus within the cell (AVI 19033 KB)
Video. A2 Shows the movement of the organelle within the cell (AVI 24833 KB)


