

Abstract
The glioma-associated family of transcription factors (GLI) have emerged as a promising therapeutic target for a variety of human cancers. In particular, GLI1 plays a central role as a transcriptional regulator for multiple oncogenic signaling pathways, including the hedgehog (Hh) signaling pathway. We undertook a computational screening approach to identify small molecules that directly bind GLI1 for potential development as inhibitors of GLI-mediated transcription. Through these studies, we identified compound 1, which is an 8-hydroxyquinoline, as a high-affinity binder of GLI1. Compound 1 inhibits GLI1-mediated transcriptional activity in several Hh-dependent cellular models, including a primary model of murine medulloblastoma. We also performed a series of computational analyses to define more clearly the mechanism(s) through which 1 inhibits GLI1 function after binding. Our results strongly suggest that binding of 1 to GLI1 does not prevent GLI1/DNA binding nor disrupt the GLI1/DNA complex, but rather, it induces specific conformational changes in the overall complex that prevent proper GLI function. These results highlight the potential of this compound for further development as an anti-cancer agent that targets GLI1.
Keywords: GLI1, cancer structure-based virtual screening, Computational Medicinal Chemistry, Zinc finger, GANT61, Molecular Dynamics, DNA puckering, Principal Component Analysis
Graphical Abstract
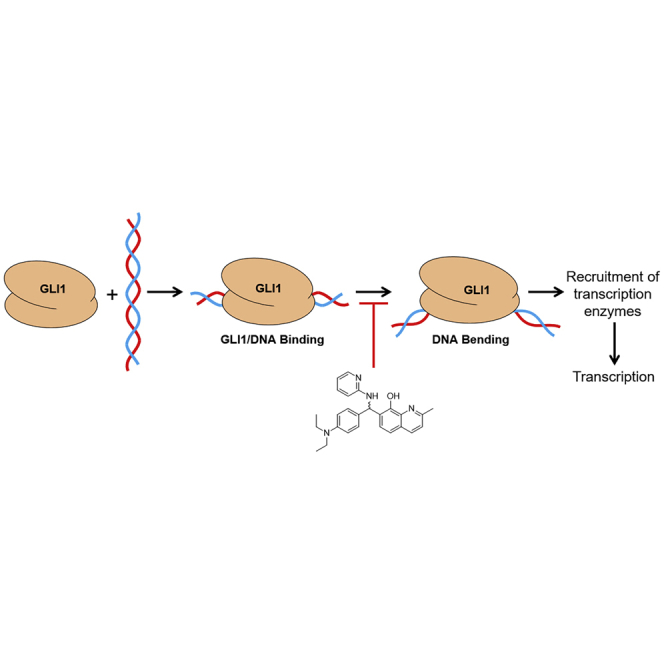
GLI1 is a transcription factor implicated as a therapeutic target for multiple forms of cancer. This work describes the identification and initial evaluation of a small molecule GLI1 inhibitor with promising anti-cancer properties. In addition, these studies probe the mechanism of action through which this compound inhibits GLI-mediated signaling.
Introduction
Glioma-associated oncogene 1 (GLI1) is a zinc-finger transcription factor that has been implicated as a driving force for a variety of human cancers. Canonically, the oncogenic nature of GLI1 is associated with its role as the final effector of the hedgehog (Hh) signaling pathway.1 Hh signaling is essential for proper tissue differentiation during embryonic development and maintenance of stem cell populations in adults; however, aberrant activation of the pathway has been linked to basal cell carcinoma (BCC) and medulloblastoma (MB). More recently, noncanonical activation of GLI1 has been implicated as an oncogenic factor in breast,2 pancreas,3, 4, 5 prostate,6,7 lung,8, 9, 10 and colon11, 12, 13 cancer. This noncanonical GLI1 activation has been linked to multiple well-characterized tumorigenic pathways.14 With its role as a downstream effector of multiple oncogenic signaling pathways, GLI1 represents a unique and promising drug target for a wide range of human malignancies.
Even with GLI1 emerging as a promising molecular target for multiple forms of cancer, the identification and development of small molecules that directly target the protein have progressed slowly. To date, GANT61 and glabrescione B (GlaB) are the best-characterized direct inhibitors of GLI1 (Figure 1).15, 16, 17, 18, 19 All of these compounds directly bind to GLI1 and inhibit canonical and noncanonical GLI1-mediated transcriptional activity; however, their overall activity is modest, with micromolar concentrations required for in vitro inhibition. In addition, GANT61 is rapidly hydrolyzed to the GANT61-diamine (GANT61D) in vitro and in vivo (Figure 1). GANT61D retains the ability to bind GLI1 but is less selective due to the inherent flexibility of the central diamine linker.16,20 GlaB is an isoflavone natural product that inhibits canonical Gli1-mediated transcriptional activity at multiple levels of the Hh pathway, including through direct binding with the key pathway regulators Smoothened (SMO) and GLI1.17,20,21 Although these compounds have demonstrated that GLI proteins are druggable targets, their further clinical development is limited, and the identification of novel GLI1 inhibitors is warranted. With this in mind, we took a hybrid computational and experimental approach to identify a novel chemotype capable of binding to and inhibiting Gli1-mediated transcriptional activity.
Figure 1.

Structures of GANT61, glabrescione B, vismione, and quinoline derivatives
Results
Computational and structural analysis of the GLI1/DNA complex
GLI1 is a C2H2-type transcription factor that contains five zinc finger (ZF) domains (ZF1−ZF5) and is known to specifically bind the consensus DNA sequence 5′-GACCACCCA-3′ (nucleotide base pairs 6−14 [base pairs nt6−nt14]). A previously determined crystal structure of the GLI1/DNA complex (PDB: 2GLI) has provided key information as to the specific intramolecular interactions that govern Gli1/DNA binding.22 As shown in Figure 2, ZF2−ZF5 fit in the major groove of the consensus sequence and wrap around the full helical turn of the DNA, whereas ZF1 (residues 235−260) does not directly interact with the DNA but does interact directly with ZF2 (268−295). The most important regions of GLI1 for recognition of the conserved base pairs of DNA is ZF4 (residues 331−226) and ZF2, with multiple intermolecular interactions between GLI1 and DNA in this region. Within the complex, the DNA can be described relative to three regions that have distinct conformations. The first conserved region, consisting of base pairs nt1−nt5, is recognized by ZF4 and ZF5 (residues 375−381) and adopts a Z-DNA conformation. The second region, which consists of the consensus binding sequence (base pairs nt6−nt14), has characteristics of intermediate B- and A-DNA and binds to ZF3 and ZF4 (283−350), whereas the third region (base pairs nt15−nt21) extends beyond ZF3 and has structural features of B-DNA.
Figure 2.

Structure of the GLI1/DNA complex
As noted above, the best-characterized GLI1-binding small molecules are GANT61 and GlaB; however, these compounds bind to two distinct locations on GLI1. Previous computational and experimental studies localized the binding site of GANT61/GANT61D to the region between ZF2 and ZF3 at a site distinct from the GLI1/DNA binding interface.16 Most notably, hydrogen bonds with residues E250 and E298 were important for GANT61D binding. By contrast, studies focused on elucidating the GlaB binding site on GLI1 suggest the compound binds between ZF4 and ZF5 and forms key interactions with K340 and K350.18 Based on the extensive literature demonstrating the in vitro and in vivo activity of GANT61, coupled with the promising computational and mutational studies localizing its binding site to ZF2/ZF3, we chose the GANT61D binding region on GLI1 for our virtual screening protocol.
Docking-based virtual screening
Our first step toward identifying small molecules that directly bind to GLI1 was to probe more closely the GANT61D-GLI1/DNA complex to help us design our virtual-screening protocol. Based on the previously described putative binding site, a grid file was generated around E250 and E298 of the GLI1/DNA co-crystal structure (PDB: 2GLI), and Glide XP docking was performed with the di-protonated form of GANT61D. The results of our docking study correlated well with the previously reported structure of GLI1-docked GANT61D, with the compound adopting a similar orientation as previously described.16 Interestingly, the two di-protonated amines of GANT61D form two different types of dynamic interactions with the carbonyl side chains of E250 and E298 (Figure 3C). As E298 is present between the two amines, both oxygen atoms of the side-chain carboxylate interact with both amine moieties of GANT61D through a dynamic hydrogen bond and a salt bridge. By contrast, the carbonyl of E250 forms a single hydrogen bond with one of the di-protonated amines. In addition, one of the aromatic rings and the appended dimethyl amine form π-π stacking and hydrogen bonds with H254 and N257, respectively.
Figure 3.

The binding conformations and key interactions for 1 and GANT61D with GLI1
(A) The GLI1/DNA complex with 1 (green) and GANT61D (magenta) docked in their binding site between ZF1 and ZF2. (B and C) Orientations of 1 (B) and GANT61D (C) docked into the putative GANT61D binding site on GLI1.
Following validation of our docking grid and protocol for replicating the previous binding studies, we utilized the same structure and grid file to perform a docking-based virtual screen on a library of approximately 300,000 small molecules in Glide through an iterative process (Figure 4). All compounds were initially docked in the high-throughput virtual screening (HTVS) mode, and the 490 compounds with a Glide score less than −5.5 were advanced into the standard precision (SP) mode for docking. The top compounds from SP docking (69 compounds, Glide score < −6.0) were re-docked and scored in extra precision (XP) mode to provide 21 compounds that were predicted to be high-affinity binders to the GANT61 binding pocket of the Gli1/DNA complex (XP score < −6.0). Of these 21 compounds, only one (1; Figures 3B and 4) demonstrated promising in vitro activity against canonical GLI1-mediated transcriptional activity (see section below). Initially, we docked both the R- and S- enantiomers of 1 into the putative binding site on GLI1. These studies predicted that the R-enantiomer would bind with enhanced affinity compared to the S-enantiomer; therefore, all of our subsequent computational studies were conducted using the R-enantiomer. The docked structure for 1 (Figure 3B) suggests that the nitrogen in the pyridine ring forms a dynamic hydrogen bond with the side chain of E250. The pyridine and the naphthol are stabilized in the binding pocket through π-cation interactions with the side-chain amine of K302. Finally, the hydroxyl moiety in the 8-quinolinol forms a hydrogen bond with the backbone of P300.
Figure 4.

Virtual screening protocol for identification of hit compound 1
Validation of hit compound 1 as a Gli1 Inhibitor
Upregulation of Gli1 mRNA expression in the Hh-dependent mouse embryonic fibroblast (MEF) cell line C3H10T1/2 is a well-characterized marker of Hh/Gli1 signaling. In these cells, Gli1 mRNA is upregulated following Hh pathway activation through the addition of an exogenous Hh ligand or pathway agonist, and this upregulation is abrogated with the concomitant addition of an Hh pathway inhibitor. For our studies, we activated Hh signaling (and upregulated Gli1 mRNA expression) with a mixture of 20(S)-hydroxycholesterol (20-OHC) and 22(S)-hydroxycholesterol (22-OHC; 10 μM each) following our previously described protocol.23,24 To investigate the functional activity of our potential hit molecules, each of the 21 compounds that had a Glide XP score < −6.0 was evaluated at a single concentration (10−100 μM) for their ability to downregulate Gli1 mRNA expression in this model system. Interestingly, only one small molecule (1; Figure 4) significantly downregulated Gli1 mRNA expression in this assay at 10 μM (94%). Several compounds with the same general 8-hydroxyquinoline scaffold as compound 1 were recently disclosed as inhibitors of GLI1-mediated transcription;19 however, detailed descriptions of how these compounds were identified and follow-up studies to fully explore the in vitro anti-GLI1 activity of this scaffold and probe the mechanisms that govern this activity have not been described. Based on the initial promising results of compound 1 and the related analogs, we focused our additional studies on this compound.
Following the promising activity of 1 in the MEF cells, we sought to further validate its potential by re-synthesizing the compound and continuing to evaluate its activity in a variety of cellular models. We utilized well-known protocols to generate a racemic mixture of 1 through a one-pot, three-component Betti reaction (Scheme S1).25, 26, 27 Our newly synthesized batch of 1 significantly downregulated Gli1 mRNA expression in the MEFs and the Hh-dependent murine BCC cell line ASZ001 (Figures 5A and 5B) (half-maximal inhibitory concentration [IC50] = 1.3 ± 0.7 μM). We also evaluated the ability of 1 and GANT61 to downregulate mRNA expression of Patched 1 (Ptch1) and Hhip in the ASZ cells (Table 1; Figure S2). The ability of compound 1 to downregulate mRNA expression of all three of these well-characterized Hh/GLI1 target genes clearly demonstrates its ability to inhibit canonical Gli1-dependent tumorigenic activity. Next, we explored the activity of GANT61 and 1 in Sufu−/− MEFs, a commonly utilized cell line, to study the ability of small molecules to inhibit Hh signaling at the level of Gli1 (Figure 5C). As expected, both compound 1 and GANT61 decreased Gli1 mRNA expression in a concentration-dependent manner in these cells (IC50 values = 1.5 ± 0.5 μM and 4.5 ± 1.2 μM, respectively). Finally, we evaluated 1 for its anti-proliferative activity in primary Hh-dependent MB cells derived from Ptch conditional knockout (Ptch-CKO) mice.28, 29, 30 Compound 1 inhibited proliferation of the primary cells with a GI50 value of 4.4 μM, further highlighting its ability to regulate canonical Hh/Gli1 signaling (Figure 5D).
Figure 5.

Inhibition of Hh/Gli1 signaling by hit compound 1
(A–C) The ability of compound 1 and GANT61 to downregulate Gli1 mRNA expression was evaluated in C3H10T1/2 MEFs (A), ASZ001 cells (B), and Sufu−/− MEFs (C). (D) The anti-proliferative activity of compound 1 in the primary murine Hh-dependent Ptch-CKO cells. (E) Immobilized Gli1 was incubated with the noted concentrations of compound 1. (F) Immobilized DNA was incubated with 1 at the noted concentrations in the presence or absence of Gli1 (50 nM). All graphs are from a single representative experiment performed in triplicate. Error bars represent the SEM. All IC50 and GI50 values are the average ± SEM of at least two separate experiments performed in triplicate.
Table 1.
In vitro inhibition of Hh/GLI1 dependent by compound 1
| Compound |
Downregulation of Hh/GLI1 target genes: ASZ cells, IC50 (μM)a |
Anti-proliferation activity, GI50 (μM)b |
|||
|---|---|---|---|---|---|
| Gli1 | Ptch1 | Hhip | ASZ cells | Ptch-CKO cells | |
| 1 | 1.3 ± 0.7 | 8.7 ± 1.0 | 5.9 ± 1.3 | 14.7 ± 1.2 | 4.4 ± 0.8 |
| GANT61 | 11.1 ± 1.5 | 19.9 ± 3.1 | 5.6 ± 1.8 | 11.3 ± 1.2 | N/Dc |
IC50 values following 48 h compound incubation.
GI50 value following 72 h compound incubation.
N/D, not determined. GANT61 not evaluated in Ptch-CKO cells.
To explore the ability of 1 to interact directly with Gli1, we initially performed an electrophoretic mobility shift assay (EMSA). Both GANT61 and GlaB have previously demonstrated the ability to disrupt the Gli1/DNA binding interaction as measured through EMSA.15,17 Interestingly, compound 1 was unable to disrupt the Gli1/DNA complex, even at concentrations up to 100 μM (Figure S3). Based on this result, we undertook surface plasmon resonance (SPR) studies with compound 1, Gli1, and its consensus DNA sequence to more fully explore binding among these three components. When immobilized Gli1 was incubated with varying concentrations of compound 1, a clear dose-dependent resonance response was seen, demonstrating high-affinity binding of Gli1 and 1 (Figure 5E; Kd = 207 nM). By comparison, GANT61 binds with only moderate affinity to Gli1 (Kd = 7.5 μM),16 highlighting the improved affinity of the 8-hydroxyquinoline scaffold. Kinetic parameters for GLI1/1 binding (kon = 431 M−1s−1 and koff = 8.9 × 10⁻⁵ s−) suggest a slow-on/slow-off rate for compound 1. We conducted additional SPR binding studies in which DNA was immobilized, and compound 1 in the presence or absence of Gli1 was employed as the analyte. These studies clearly demonstrate that compound 1 does not directly bind to DNA nor does 1 affect the ability of Gli1 to bind to its consensus DNA sequence (Figure 5F).
Based on these results, we sought to further explore the in vitro activity of 1 by evaluating its ability to affect protein levels of both Gli1 and Gli2 in the ASZ cells (Figures 6A−6C). Interestingly, 1 decreased Gli1 protein levels with an approximate IC50 value comparable to its ability to decrease Gli1 mRNA expression; however, treatment with GANT61 did not significantly decrease the Gli1 protein. Similar results were seen for protein levels of Gli2 following treatment with either Gli1 inhibitor. There are two possible explanations for these results. First, reduced Gli1 levels may be a direct downstream result of the decrease in Gli1 mRNA induced by compound 1; however, if this were the case, similar results would be expected following treatment with GANT61. A second possibility is that the binding of Gli1 to compound 1 affects Gli1 stability, ultimately resulting in its degradation. This explanation would suggest that 1 binds with comparable affinity for both Gli1 and Gli2, whereas the reduced affinity of GANT61 for Gli1 would prevent it from destabilizing the protein in a cellular model. Finally, to explore whether compound 1 was selective for Gli1 compared to Gli2, we evaluated the mRNA expression of Hh/GLI1 target genes in the ASZ cells following small interfering RNA (siRNA)-mediated depletion of either Gli1 or Gli2. Through our siRNA protocols, we were able to significantly decrease protein levels of both Gli1 and Gli2 (∼75% and ∼85%, respectively; Figure S4). Similar to the results following treatment with compound 1 (Table 1), selective knockdown of either Gli isoform resulted in significant downregulation of Gli1, Gli2, Ptch1, and Hhip mRNA expression (Figures 6D and 6E). These results clearly support cellular inhibition of a GLI protein(s) as a primary mechanism through which compound 1 inhibits GLI-mediated transcription; however, they do not clarify whether the compound also binds to and inhibits GLI2.
Figure 6.

Additional in vitro studies
Compound 1 and GANT61 at various concentrations (μM) were evaluated for their ability to decrease Gli1 and Gli2 protein levels in the Hh/Gli1-dependent ASZ cells. (A–C) Membrane visualization (A) and quantification of protein levels for Gli1 (B) and Gli2 (C). Blots shown in (A) are from a single representative experiment, whereas graphs in (B) and (C) are image quantifications from two separate experiments. Comparisons between protein levels were carried out using the Student’s two-tailed t test; ∗p < 0.05, ∗∗p < 0.01. (D and E) Downregulation of Hh/GLI1 target genes in ASZ cells following 48 h (D) or 72 h (E) treatment with mock, Gli1-specific siRNA (siGli1), Gli2-specific siRNA (siGli2).
Initial molecular dynamics (MD) studies
As noted above, GANT61D does not bind at the DNA-binding site of GLI1 located within ZF4 and ZF5; therefore, it is unlikely that GANT61D or compound 1 directly interferes with GLI1 binding to DNA. This is directly supported by our EMSA and SPR studies in which 1 was unable to disrupt the GLI1/DNA complex. In order to better understand the mechanisms that lead to inhibition of GLI1 signaling for both of these compounds, we performed MD studies followed by principal-component analysis (PCA) on 3 different systems: GLI1/DNA complex (system 1), GANT61D bound to the GLI1/DNA complex (system 2), and 1 bound to the GLI1/DNA complex (system 3).
Initially, we equilibrated each of the 3 systems for 5 ns for our MD simulations. Next, the equilibrated systems were subjected to a production run at 300 K and 1 bar of pressure for 10 ns. In systems 2 and 3, the small molecule ligands (GANT61D and 1, respectively) exited the putative binding site within 2 ns. We observed similar trends in both GROMACS 5.5 and AMBER18 simulation packages using various force fields and solvent systems. In an attempt to validate the molecular simulation trajectories for the studies described below, we calculated the B-factors of each Cα atom of GLI1 from both the equilibration and MD trajectories of system 1 and compared them against the experimental B-factors from the GLI1/DNA co-crystal structure (PDB: 2GLI).
The comparison of these sets of B-factors, which reflect the atomic displacement parameters of each residue of GLI1, demonstrated that our equilibration trajectories more closely correlate to the experimental parameters (Figure S5). It is clear that the majority of B-factors from the equilibration trajectories of system 1 are slightly lower than the crystallographic B-factors, whereas the B-factors derived from the MD trajectories are significantly higher. One notable difference in structure between the crystal structure and our equilibrated trajectories is found in the interloop regions of the ZFs, where the crystallographic B-factors are generally lower than the equilibration B-factors. This result appears primarily due to crystal packing effects as the interloops of the ZFs are packed against another subunit in a single unit cell, reducing the flexibility of the regions involved in the crystal contact.
Because the equilibration trajectories correlated more closely to the experimentally determined GLI1/DNA structure, we used the equilibrated trajectories of the three systems to evaluate the dynamic behavior and stability of each residue in both GLI1 and the DNA. We analyzed the trajectories of the three systems by root mean square deviation (RMSD), root mean square fluctuation (RMSF), and PCA profiling. These methods decrease the complexity of the systems by determining what collective motion of specific atoms in the simulated trajectories is essential for molecular function.
In order to investigate the structural stability of the GLI1/DNA complex and ligand-bound systems, we determined the average RMSD for each complex during the simulations. Within this context, the RMSD values describe the average distance the nonhydrogen atoms move over the course of the simulation from their initial positions at time zero. Figure S6 shows the RMSD of the protein core together with the DNA, for 5,000 frames (5 ns) of the equilibration trajectory. The RMSD values of GLI1 and DNA in system 1 indicate that the overall structures were well maintained and that the protein core was stable throughout the equilibration simulations (Table 2). By contrast, GLI1 and DNA in the ligand-bound systems showed significant fluctuation, strongly suggesting ligand binding to the ZF1/ZF2 region affects the overall structural stability of the complex and may hinder or alter the GLI1/DNA interaction.
Table 2.
RMSD values for the MD simulations on the three systemsa
| System component | GLI1/DNA complex | GANT61D-GLI1/DNA complex | 1-GLI1/DNA complex |
|---|---|---|---|
| Gli1 protein | 2.35 ± 0.3 | 2.43 ± 0.3 | 2.55 ± 0.4 |
| DNA | 1.98 ± 0.3 | 2.01 ± 0.3 | 2.10 ± 0.3 |
| Ligand | N/A | 2.24 ± 0.4 | 1.35 ± 0.1 |
N/A, not applicable.
All values represent average RMSD ± SD.
Conformational analysis
Although these RMSD values provide evidence with regards to the overall stability of the structures, they do not offer clear information about the conformational changes that occur between the unbound GLI1/DNA complex and either of the ligand-bound complexes. To further explore the structure and dynamics of the GLI1/DNA complexes and assess any conformational changes that occur to these two components upon ligand binding, we calculated two key parameters of convergence that can provide insight into conformational dynamics of protein or DNA: the RMSFs of GLI1 and the DNA sugar pucker. RMSF is a measure of the displacement of a particular atom, or group of atoms, relative to the reference structure, averaged over the number of atoms measured. RMSF values may indicate that the entire structure is fluctuating, or they may reflect large displacements of a small structural subset within a generally rigid structure. Our RMSF calculations of the Cα residues of GLI1 did not provide conclusive evidence of any conformational change in the ligand-bound state of GLI1 (systems 2 and 3) in the GLI1/DNA complex (Figure S7). Interestingly, when we calculated and analyzed the pseudo-pucker rotation around C1′−O4′ of each sugar moiety in the DNA, it revealed that ligand binding clearly affects the sugar puckering of the DNA, resulting in a clear effect on the conformational dynamics of the GLI1/DNA complex.
The deoxyribose moiety of DNA adopts a puckered conformation to reduce steric and electrostatic repulsion, and the overall DNA structure can be characterized and distinguished by pseudorotation or puckering parameters. The sugar puckers in DNA structures are predominantly C3′ endo (A-DNA) or C2′ endo (B-DNA), depending on what form the DNA adopts in the structure. In these two distinct sugar conformations, the distance between neighboring phosphorous atoms and the orientation of the phosphorous relative to the rest of the nucleotide is significantly different. We calculated the pseudo-pucker rotation of the entire DNA sequence and normalized to a 360° range with 100 bins for improved visualization of the results (Figures 7 and S8−S10). As previously noted, the conserved domain of the DNA that is specific to GLI1 adopts a mixed A/B conformation (represented here by nt6 to nt14). Similar to the GLI1/DNA crystal structure and equilibration trajectories, our GLI1/DNA complex exhibits an increased population of sugar pucker for nt8, nt11, and nt13 between 0° and 100° (which corresponds to a C3′-endo configuration present in the A form of DNA). By contrast, the sugar pucker of nt14 demonstrates a population cluster between 100° and 200° (which corresponds to a C2′-endo configuration present in the B form of DNA). Incorporation of GANT61D and 1 into the simulation resulted in localized alterations in pucker for the conserved sequences of DNA. Interestingly, in the presence of both GANT61D and 1, the GLI1/DNA complex demonstrated a smooth deformation of the deoxyribose sugar ring (nt8, nt11, and nt13) from the C3′-endo to the C2′-endo conformation (Figure S11).
Figure 7.

Sugar pucker distributions
The populations of values for the sugar pucker distribution of nt8 (top left), nt11 (top right), nt13 (bottom left), and nt14 (bottom right) in the GLI1-DNA (blue), GANT61D-GLI1/DNA (yellow), and 1-GLI1/DNA (red) complexes.
These deformations in the DNA that occur when either GANT61D or 1 binds to GLI1 ultimately results in the breaking of several key hydrogen bonds (Figure 8). In system 1, the side-chain hydroxyl in T355 forms a hydrogen bond with the backbone of nt8; however, in the presence of either GANT61D or 1, this hydrogen bond is broken. Also in the GLI1/DNA complex, S313 forms hydrogen bonds with both nt13 and nt14. By contrast, in systems 2 and 3, S313 only forms a hydrogen bond with nt13. Finally, when there is no ligand present, the side-chain amine of K350 forms two hydrogen bonds: one with nt29 and one with nt30. The addition of either GANT61D or 1 to the simulation changes the sugar pucker of nt13, which impacts the position of its base pair (nt29). The ultimate result of the location shift for nt29 in the complex breaks the K350/nt30 hydrogen bond. Previous studies have demonstrated that site-directed mutagenesis of K350 (K350A) completely abrogated transcriptional activity of GLI1, highlighting the hydrogen bond between K350 and nt30 as an essential intermolecular interaction that governs Gli1-mediated transcription.17
Figure 8.

Changes in DNA sugar pucker disrupt hydrogen bonds
(A–C) Key hydrogen bonds for T355, K350, and S313 in the GLI1/DNA complex (A) are disrupted in the GANT61D-GLI1/DNA (B) and 1-GLI1/DNA (C) complexes. Additional figures demonstrating the overall changes in the complex structures can be found in Figures S12−S14.
PCA
The function of a protein or nucleic acid is primarily governed by the structural fluctuations of its residues; however, it is challenging to determine which fluctuations are the most relevant, as molecular simulations contain multiple amino acid and/or nucleic acid residues that can move in an almost infinite number of individual directions. The reduction of the dimensionality of the data obtained from simulation trajectories can help in identifying configurational space that contains only a few degrees of freedom in which an harmonic motion occurs. With this in mind, we performed PCA on each of our GLI1/DNA systems.31,32 PCA has as its ultimate goal to simplify the complexity of high-dimensional data, which can allow for overall trends and/or patterns to become clearer. Within the context of our simulations, we utilized PCA to simplify the high degree of individual motion associated with all of the heavy atoms in each system by assigning the motion to a different PC. Each PC represents a specific mode of motion of a region of GLI1 or DNA. This analysis can quickly reveal the dominant mode(s) of motion observed during a simulation for each individual component of a system, without the need to calculate the specific molecular mechanism(s) responsible. To measure how well the motions of the DNA converge with respect to GLI1, we used PCA in which each PC is equivalent to a mode of motion of either GLI1 or DNA. In addition, the PCs are determined such that PC1 is the dominant mode of motion in the system, PC2 is associated with the next-highest amount of motion in the system, and additional PCs are calculated in a similar manner. To further simplify this analysis, we have focused on demonstrating how the most-dominant PCs affect the overall conformation of DNA in the simulations.
The results of the PCA performed on all heavy atoms of system 1 identified the most important motion in the complex (PC1) as the interloop regions of GLI1 between ZF1 and ZF2 moving toward the DNA (Figure 9A). This results from movement of the B-DNA region of the consensus sequence (nt15−nt21) toward ZF1 and ZF2 in GLI1. The second PC consists of the interloop region between ZF4 and ZF5 of GLI1 moving toward the DNA. The ultimate result of both of these dominant motions on the DNA is that the terminal nucleotides (Z and B forms) move toward each other, whereas the consensus binding sequence moves in the opposite direction, resulting in significant bending of the DNA (Figure 9A).
Figure 9.

Principal component analysis (PCA) of GLI1/DNA complexes in the presence/absence of GANT61 and 1
(A) In system 1 (GLI1/DNA), the Z and B forms of DNA move toward each other, whereas the Gli1 consensus DNA sequence (blue box) moves away, which results in a bending of the DNA. (B) In the presence of either GANT61D or 1, the Z and B forms of double-stranded DNA move parallel to each other, while the GLI1 consensus DNA sequence (blue box) twists around its axis.
By contrast, the dominant motions in systems 2 and 3 are associated with regions of GLI1 moving away from the DNA. In system 2 (GANT61D-GLI1/DNA complex), PC1 (ZF4 and ZF5 moving away from the DNA) and PC2 (ZF3 moving away from DNA) account for approximately 45% of all the motion in the complex. Interestingly, the dominant motion (PC1) in system 3 (complex with 1) is not movement of GLI1 but rather, motion of the conserved sequence of DNA (nt6−nt14), which is a result of the changes in sugar pucker described above. PC2 in system 3 is motion associated with ZF1 and ZF2 moving downward toward the B-DNA region (nt15−nt21). With respect to GLI1, the result of the combined motions associated with PC1 and PC2 in system 3 is consistent with a slight clockwise movement of ZF1 and ZF2, whereas ZF3, ZF4, and ZF5 move away from the DNA. Although the dominant motions in systems 2 and 3 are different, the overall changes in DNA conformation are very similar and ultimately result in an overall decrease in the amount of DNA bending that occurs (Figure 9B). Video files showing the described motions for each system are available (Videos S1, S2, and S3). Visual examination of pseudo-trajectories in the supplemental videos that were created by projecting the averaged coordinates of each system along PC1 demonstrates that the DNA interacts more tightly with GLI1 in the absence of either GANT61D or 1.
Discussion
Within the context of canonical GLI1-mediated signaling, several inhibitors of the key Hh pathway component SMO have been approved for the treatment of metastatic BCC; however, several shortcomings of SMO antagonists have become readily apparent since their approval. First, SMO is prone to mutation, and resistance to SMO antagonists commonly occurs irrespective of the tumor type.33, 34, 35 Second, these drugs are not effective against canonical Hh/GLI-dependent cancers that arise downstream of SMO through inactivating mutations in SUFU or amplification of GLI1/GLI2. By contrast, small molecules that directly inhibit GLI1 would be effective against Hh-dependent cancers that arise through either upstream or downstream mechanisms. Also, in noncanonical GLI-dependent cancers, GLI1 inhibitors would be promising therapeutics because they target GLI1 activation downstream of multiple well-characterized oncogenic proteins and signaling pathways and function irrespective of the mode of GLI1 activation.
To date, the majority of small molecules that exhibit anti-GLI1 activity function through indirect or unknown mechanisms and those that do directly target GLI1 are only moderately active or nonselective. We utilized a virtual structure-based screening approach to identify a promising lead scaffold that binds directly to GLI1 with high affinity and inhibits GLI1-mediated transcription in multiple cellular models. Our studies also demonstrate that compound 1 does not inhibit GLI1 function by preventing the GLI1/DNA interaction. Interestingly, it was previously reported that GANT61, which shares a putative binding site with 1, does disrupt the GLI1/DNA interaction. As noted above, a series of 8-hydroxyquinolines were recently disclosed as small molecule inhibitors of GLI1-mediated transcription.19 Our findings significantly advance our understanding of the ability of this scaffold to inhibit GLI1 activity across multiple GLI1-dependent systems.
Another virtual screening approach to identify small molecule GLI1 inhibitors was recently reported.18 This protocol utilized the GLI1 inhibitors GlaB and vismione E to generate a pharmacophore that could be applied to a library of small molecules to identify compounds capable of binding to ZFs 4 and 5 of GLI1. Several compounds from this screen reduced GLI1 protein levels in Hh-dependent MEFs and inhibited growth of melanoma and MB cell lines. Taken together, the results of these two approaches clearly highlight the usefulness of virtual screening approaches to identify small molecule binders of proteins of interest.
Our computational studies and subsequent PCA provided key results in regard to how the conformational dynamics of GLI1 and DNA are affected by binding to GANT61 or 1. First, when either small molecule binds to the GLI1/DNA complex, there is a significant change in sugar pucker for several nucleotides, which ultimately results in the disruption of several key intermolecular hydrogen bonds between the DNA and GLI1, most notably, between K350 and nt30. Previous mutation of K350 (K350A) completely abolished GLI1 transcriptional activity, highlighting the essential nature of this residue for proper GLI1 function.17 In addition, our PCA studies strongly suggest that GLI1 actively bends the DNA, whereas binding of either GANT61 or 1 to GLI1 reduces the amount of DNA bending in the complex. Although binding-induced DNA bending has not been previously demonstrated for GLI, the ability of transcription factors to bend DNA is a well-characterized mechanism by which these proteins activate gene expression.36,37 Taken together, these results provide strong evidence that the conformational changes induced in GLI1 by GANT61D and 1 induce a change in sugar pucker that breaks key intermolecular hydrogen bonds between GLI1 and DNA and prevents GLI1-induced DNA bending.
Materials and methods
Computational methods
Docking-based virtual screening
An in-house library of 155,555 small molecules from Chembridge was screened virtually through a docking-based screening strategy. All ligands were prepared for docking in the LigPrep module of Schrödinger (Suite 2019). The Protein Preparation Wizard module of Schrödinger was utilized to prepare the GLI1/DNA crystal complex for docking (PDB: 2GLI).22 All crystallographic water molecules were removed, protonation states were assigned, and partial charges were set with the OPLS2005 force field. The entire complex was minimized by the restrain-minimization procedure, where the whole GLI1-DNA crystal complex (PDB: 2GLI) terminated until the RMSD of the nonhydrogen atoms reached a maximum default value of 0.3 Å. Following in silico optimization of the complex and small molecule library, the ligands were virtually screened in the Glide module of Schrödinger through the standard work flow (HTVS, SP, and XP). The OPLS 2005 force-field parameters were applied while performing docking calculations. The molecules with the best Glide scores were evaluated in vitro in the C3H10T1/2 cell line, as described below.
MD simulations
The monoclinic complex structure of GLI1ZF/DNA (PDB: 2GLI) was downloaded from the protein data bank. Coordinates of the water molecules were removed from the complex, and the cobalt ions utilized for crystallization were manually replaced with zinc ions in the coordination system of each ZF. The AMBER18 and Gromacs 5.5 programs were used for MD studies. The GLI1/DNA complex containing the zinc atoms was parameterized by the tleap module of AmberTools18. The Amber14SB and DNA.OL15 force field were used for parameterization of Gli1 and DNA from the complex, respectively. The 4 coordinated zinc cation centers were parameterized with the zinc AMBER force field (ZAFF). The GLI1/DNA complex was inserted in a cuboid box of explicit TIP3P-typed water molecules, with an appropriate number of ions incorporated based on the system. The solvated macromolecular system was energy minimized in SANDER. First, water molecules and counterions were minimized for 250 steps by using a steepest descent (SD) algorithm and for an additional 750 steps by using a conjugate gradient (CG) algorithm, while keeping GLI1ZF/DNA frozen. Next, the entire solvated system was energy minimized for 1,000 steps with SD and an additional 4,000 steps with CG without positional restraints, followed by heating from 0 to 300 K for 50 ps with the Langevin thermostat. The complex density was equilibrated for 50 ps. In these steps, the GLI1 and DNA backbones were restrained with a harmonic force constant of 5.0 kcal/mol/Å2. Restrained MD trajectories were produced for 3 ns, whereas the force constant was gradually decreased from 5 to 1 kcal/mol/Å2. Finally, unrestrained MD trajectories were generated for 20 ns. During all MD simulations, a time step of 0.001 ps was used.
PCA
In order to assess convergence of the internal motion (i.e., the dynamics) between independent trajectories, we evaluated the overlap of the histograms of PC projections obtained from each simulation trajectory as a function of time. First, to ensure that the eigenvectors obtained from each simulation being compared matched, the coordinate covariance matrix of the heavy atoms was calculated using a combined trajectory from both simulations. Each frame of the trajectory is RMS fit to the overall average coordinates in order to remove global rotational and translational motions. Next, the projection along these eigenvectors of each coordinate frame from the first simulation trajectory is calculated; this is repeated for the second simulation trajectory. The histograms were constructed using a Gaussian kernel density estimator with a bandwidth obtained via the normal distribution approximation of the PC data. This analysis was performed with the CPPTRAJ module in AMBER18.
Synthesis and evaluation of hit compound 1
General information
C3H10T1/2 and H226 cell lines were purchased from American Type Culture Collection (ATCC; Manassas, VA, USA). ASZ cells were a kind gift from Dr. Ervin Epstein (Children’s Hospital of Oakland Research Institute). Sufu−/− MEFs were a kind gift from Dr. Matthew Scott (Stanford). The MEFs and ASZ cells were cultured as described previously.23,24 Cells were grown in Corning cell-treated culture flasks (canted neck, T75 or T150) in an Autoflow IR water-jacket CO2 incubator. Dimethyl sulfoxide (DMSO) was used as a solvent to prepare all compound solutions, and the final DMSO concentration did not exceed 0.5%. 20-OHC, 22-OHC, and GANT61 were purchased from Sigma-Aldrich.
Synthesis of compound 1 (7-((4-(diethylamino)phenyl)(pyridin-2-ylamino)methyl)-2-methylquinolin-8-ol)
Pyridin-2-amine (1.1 mmol) and 4-(diethylamino)benzaldehyde (1.1 mmol) were dissolved in 10 mL of ethanol in a small flask. The solution was stirred for 20 min to promote formation of the Mannich base. The 2-methylquinolin-8-ol (1.1 mmol) was then dissolved in a minimal amount of ethanol (2 mL) with gentle heating, and the resulting solution was added to the reaction flask. The mixture was stirred in an inert atmosphere at room temperature (RT) for 24 h and then allowed to stand until either a solid precipitate formed, or thin-layer chromatography indicated that no additional product was being formed. The reaction mixture was concentrated, and the residue was re-dissolved in acetonitrile and stirred at room temperature for 28 h. Any crystals that precipitated during that period were racemic crystals and were filtered. The mother liquor was concentrated and re-dissolved in 25 mL of isopropanol, stirred at room temperature for 48 h, and the precipitated crystals were collected and washed repeatedly with ethyl acetate. The combined racemic crystals were not purified further: white solid (228 mg, 13% yield); 1H nuclear magnetic resonance (NMR; 500 MHz, DMSO-d6) 9.33 (s, 1H), 8.16 (d, J = 8.4 Hz, 1H), 7.91 (dd, J = 4.9, 1.2 Hz, 1H), 7.57 (d, J = 8.5 Hz, 1H), 7.40 (d, J = 8.4 Hz, 1H), 7.37 (d, J = 1.8 Hz, 1H), 7.36 (s, 1H), 7.34 (s, 1H), 7.32 (s, 1H), 7.19 (d, J = 8.3 Hz, 1H), 7.12 (d, J = 8.7 Hz, 1H), 6.64 (d, J = 8.4 Hz, 2H), 6.57 (d, J = 8.8 Hz, 2H), 6.47−6.43 (m, 1H), 3.28 (q, J = 7.0 Hz, 4H), 2.70 (s, 3H), 1.04 (t, J = 7.0 Hz, 6H), 13C NMR (126 MHz, DMSO) δ 157.17, 148.86, 147.87, 146.62, 137.04, 136.50, 130.13, 128.63, 126.86, 125.92, 125.74, 122.64, 117.37, 111.77, 51.70, 44.10, 25.15, 12.89. Electrospray ionization (ESI)-mass spectrometry (MS) [M + H]+ calcd for C26H28N4O 412.226 found 413.226.
General cell culture protocols
C3H10T1/2 cells were cultured in beta-mercaptoethanol (BME; Gibco), supplemented with 10% fetal bovine serum (FBS; Atlanta Biologicals), 1% L-glutamine (Cellgro; 200 nM solution), and 0.5% penicillin/streptomycin (Cellgro; 10,000 IU/mL penicillin, 10,000 μg/mL). ASZ001 cells were cultured in 154CF medium, supplemented with 2% FBS, 1.0% penicillin/streptomycin, and a final concentration of 0.05 mM CaCl2. Sufu−/− MEFs were cultured in DMEM, supplemented with 10% FBS, 1% L-glutamine, and 1% penicillin/streptomycin. Cells were maintained using the medium described above (denoted “growth” medium). Medium denoted as “low FBS,” which contains 0.5% FBS and the same percentage of other supplements as specified for growth medium, was used for C3H10T1/2 and Sufu−/− MEFs in specified experiments. For ASZ001 cells, no FBS-supplemented medium was used for specified experiments. All cells were grown in canted neck T75 flasks in an Autoflow IR water-jacketed CO2 incubator (37°C, 5% CO2). Cells were split 1:5 every 2–3 days once they reached ∼80% confluency.
General procedure for analysis of Hh target gene regulation
Cells were grown to confluence and plated on 24-well plates (50,000 cells/well, 500 μL). After 24 h, growth media were removed and replaced with corresponding low FBS media (500 μL per well). Cells were treated with DMSO, OHCs, OHCs plus compound, or compound alone, depending on the assay. Cells were incubated (37 °C, 5 % CO2) for the indicated time period, and total RNA was extracted using Ambion by Life Technologies TaqMan Fast Cells-to-CT kit following the manufacturer’s instructions. Synthesis of cDNA was performed using a Bio-Rad MyCycler. Quantitative PCR was performed on an Applied Biosystems (ABI) 7500 Fast system using the following TaqMan Gene Expression Primer/Probe solutions (ABI): mouse ActB (Mm00607939s1), mouse Gli1 (Mm00494645m1), mouse Gli2 (Mm01293117_m1), mouse Ptch1 (Mm00436026_m1), and mouse Hhip (Mm00469580_m1). Relative gene-expression levels were computed by the ΔΔCt method. Values represent mRNA expression relative to OHCs (C3H10T1/2, set to 100%) or DMSO (set to 1.0). Data were analyzed using GraphPad Prism 5, and all values are the mean ± SEM for at least two separate experiments performed in triplicate.
Anti-proliferation studies in ASZ and Ptch-CKO cells
Cell viability was assessed by MTS proliferation assay kit (Promega), according to that manufacturer’s protocol. Briefly, 1–4 × 10⁴ cells were plated in a 96-well plate in 100 μL growth medium to make the cell population at ∼80% confluence. After 24 h, 1 μL drug solution was added to each well. DMSO was used as a control compound. After another 48- to 72-h incubation (37°C, 5% CO2), 20 μL of freshly prepared 3-(4,5-dimethylthiazol-2-yl)-5-(3-carboxymethoxyphenyl)-2-(4-sulfophenyl)-2H-tetrazolium (MTS)/phenazine methosulfate (PMS) solution was added to each well, and the plate was returned to the incubator for 1 h. Absorbance at 490 nm was recorded, and the result was analyzed by GraphPad Prism 5. GI50 values represent mean ± SEM for at least two separate experiments performed in triplicate. Culture conditions and experimental protocols to determine GI50 values for compound 1 in the primary murine Ptch-CKO cells were as previously described.28, 29, 30
Western blot analysis
ASZ cells were incubated with compound 1, GANT61, or DMSO (control) for 48 h. Protein was extracted from ASZ cells by washing them with chilled PBS and lysing with radioimmunoprecipitation assay (RIPA) buffer (Thermo Scientific) containing 1 M PMSF protease inhibitor (Thermo Scientific). Supernatant was collected after a 10-min centrifugation at 12,000 rpm and 4°C. The protein was run on SDS-PAGE and transferred onto nitrocellulose membrane at 100 V for 120 min at 4°C. The membrane was blocked at room temperature for 1 h. After several washes with Tris-buffered saline (TBS) with Tween 20 (TBST), primary antibodies were added to the membrane (GLI1, #MA5-32553, and GLI2, #PA5-79314, 1:1,000 dilution; β-actin, #PA1-16889, 1:2,000 dilution; Invitrogen) and incubated overnight at 4°C. After the primary antibody incubation and several more washes in TBST, the secondary antibody was added to the membrane (goat anti-rabbit, #32460, 1:5,000 dilution; Thermo Scientific) and incubated for 1 h at room temperature. Chemiluminescent detection on film was developed using ECL detection reagents (Bio-Rad), and proteins were quantitated using ImageJ software (https://imagej.nih.gov/).
siRNA knockdown studies
Transfections were performed using Lipofectamine 2000 (Invitrogen), according to the manufacturer’s instructions with minimum modifications. Gli1 (#s66724) and Gli2 (#s66726) siRNA and nontargeting negative control RNA (#4390843) were purchased from Invitrogen and referred to herein as siGli1, siGli2, and mock siRNA. Briefly, 3 × 10⁵ ASZ cells were seeded in a 6-well plate in growth medium. After 24 h (37°C, 5% CO2), growth medium was removed and replaced with low FBS medium. A freshly prepared transfection reagent in low FBS medium containing 20 nM siRNA and 5 μL Lipofectamine 2000 was added to each tube and preincubated for 30 min before addition to each well. Subsequent analyses were done after 48 or 72 h of siRNA treatment.
Gli1 expression and purification
hisSUMO-Gli1 was a gift from Gary Stormo (Addgene; plasmid #87225). Expression and purification of hisSUMO-Gli1 closely followed the procedure described previously,16 with the following minor modification. Purification via on-column cleavage of the His-SUMO tag was performed. Thrombin (60 U/L of expressed bacterial growth) was incubated with the protein and resin overnight at 4°C prior to elution of free Gli1 from the nickel-nitrilotriacetic acid (Ni-NTA) resin. Eluted Gli1 was further purified by fast protein liquid chromatography (FPLC; Superdex 75 gel filtration column) to separate pure Gli1 from the His-SUMO tag. FPLC fractions were evaluated by SDS-PAGE and Coomassie staining for purity. Fractions containing only pure Gli1 were combined and concentrated for use in EMSA and SPR binding studies.
SPR
SPR studies were performed on a Biacore T200 as a contract service by Creative Biolabs (Shirley, NY, USA), utilizing a procedure modified slightly from the one previously reported for evaluating GANT61/GLI1 binding.16 For 1/GLI1 binding studies, Gli1 was immobilized on a Series S CM5 sensor chip (GE Healthcare), and various concentrations of compound 1 were injected (flow rate, 30 μL/min) with a contact time of 180 s and dissociation time of 600 s. Kinetic parameters were determined by the Biacore T200 evaluation software. For 1/GLI1 binding in the presence of DNA, two single-stranded DNA fragments (sense [5′-ACGTGGACCACCCAAGACGAA-3′] and anti-sense [3′-TGCACCTGGTGGGTTCTGCTTT-5′] primers) were synthesized via PCR. The sense primer was biotinylated at the 5′ end, and the two fragments were annealed. The biotinylated double-stranded DNA (dsDNA) was immobilized on a Series S streptavidin sensor chip (GE Healthcare). Various concentrations of compound 1 were incubated with GLI1 (50 nM) prior to injection (flow rate, 30 μL/min) with a contact time of 180 s and a dissociation time of 180 s.
EMSA
500 ng of duplex DNA was incubated for 30 min with varying concentrations of GLI1 (by mole ratio) in the EMSA buffer (50 mM HEPES, 100 mM KCl, 5 mM DTT, 1 mM EDTA, 20% glycerol, 0.05% NP-40, 2 mg/mL BSA, 5 mM MgCl2, 0.05 mg/mL poly(dI-dC), pH 7.5). Compound 1 was added and incubated for an additional 30 min, and then the samples were prepared with loading dye and loaded into a 2% agarose gel (1 g agarose in 50 mL Tris-acetate-EDTA [TAE] buffer) with 0.012% ethidium bromide for visualization. The gel was run for 40 min at 100 V and visualized under black light. GLI1/DNA bands were excised and sequenced by liquid chromatography-tandem MS (LC-MS/MS).
Acknowledgments
The authors gratefully acknowledge support of this work by the Office of the Vice President at the University of Connecticut and the University of Connecticut Research Foundation through an Institutional Research Excellence Program Award. ASZ cells were kindly provided by Dr. Ervin Epstein (Children’s Hospital of Oakland Research Institute). Sufu−/− cells were kindly provided by Dr. Matthew Scott (Standford University).
Author contributions
Conceptualization, R.C.D., M.K.H., and R.J.W.-R.; software, R.C.D.; investigation, R.C.D., J.W., A.M.Z., S.R.M., and L.Q.C.; resources, R.J.W.-R. and M.K.H.; writing – original draft, R.C.D.; writing – review & editing, R.C.D. and M.K.H.; visualization, R.C.D., J.W., and A.M.Z.; supervision, R.J.W.-R. and M.K.H.; funding acquisition, M.K.H.
Declaration of interests
The authors declare no competing interests.
Footnotes
Supplemental Information can be found online at https://doi.org/10.1016/j.omto.2021.01.004.
Supplemental information
References
- 1.Peer E., Tesanovic S., Aberger F. Next-generation hedgehog/GLI pathway inhibitors for cancer therapy. Cancers (Basel) 2019;11:538. doi: 10.3390/cancers11040538. [DOI] [PMC free article] [PubMed] [Google Scholar]
- 2.Neelakantan D., Zhou H., Oliphant M.U.J., Zhang X., Simon L.M., Henke D.M., Shaw C.A., Wu M.-F., Hilsenbeck S.G., White L.D. EMT cells increase breast cancer metastasis via paracrine GLI activation in neighbouring tumour cells. Nat. Commun. 2017;8:15773. doi: 10.1038/ncomms15773. [DOI] [PMC free article] [PubMed] [Google Scholar]
- 3.Wang Y., Jin G., Li Q., Wang Z., Hu W., Li P., Li S., Wu H., Kong X., Gao J., Li Z. Hedgehog signaling non-canonical activated by pro-inflammatory cytokines in pancreatic ductal adenocarcinoma. J. Cancer. 2016;7:2067–2076. doi: 10.7150/jca.15786. [DOI] [PMC free article] [PubMed] [Google Scholar]
- 4.Nolan-Stevaux O., Lau J., Truitt M.L., Chu G.C., Hebrok M., Fernández-Zapico M.E., Hanahan D. GLI1 is regulated through Smoothened-independent mechanisms in neoplastic pancreatic ducts and mediates PDAC cell survival and transformation. Genes Dev. 2009;23:24–36. doi: 10.1101/gad.1753809. [DOI] [PMC free article] [PubMed] [Google Scholar]
- 5.Mills L.D., Zhang Y., Marler R.J., Herreros-Villanueva M., Zhang L., Almada L.L., Couch F., Wetmore C., Pasca di Magliano M., Fernandez-Zapico M.E. Loss of the transcription factor GLI1 identifies a signaling network in the tumor microenvironment mediating KRAS oncogene-induced transformation. J. Biol. Chem. 2013;288:11786–11794. doi: 10.1074/jbc.M112.438846. [DOI] [PMC free article] [PubMed] [Google Scholar]
- 6.Wu M., Ingram L., Tolosa E.J., Vera R.E., Li Q., Kim S., Ma Y., Spyropoulos D.D., Beharry Z., Huang J. Gli transcription factors mediate the oncogenic transformation of prostate basal cells induced by a Kras-androgen receptor axis. J. Biol. Chem. 2016;291:25749–25760. doi: 10.1074/jbc.M116.753129. [DOI] [PMC free article] [PubMed] [Google Scholar]
- 7.Zhu G., Zhou J., Song W., Wu D., Dang Q., Zhang L., Li L., Wang X., He D. Role of GLI-1 in epidermal growth factor-induced invasiveness of ARCaPE prostate cancer cells. Oncol. Rep. 2013;30:904–910. doi: 10.3892/or.2013.2534. [DOI] [PubMed] [Google Scholar]
- 8.Kasiri S., Shao C., Chen B., Wilson A.N., Yenerall P., Timmons B.C., Girard L., Tian H., Behrens C., Wistuba I.I. GLI1 blockade potentiates the antitumor activity of PI3K antagonists in lung squamous cell carcinoma. Cancer Res. 2017;77:4448–4459. doi: 10.1158/0008-5472.CAN-16-3315. [DOI] [PMC free article] [PubMed] [Google Scholar]
- 9.Po A., Silvano M., Miele E., Capalbo C., Eramo A., Salvati V., Todaro M., Besharat Z.M., Catanzaro G., Cucchi D. Noncanonical GLI1 signaling promotes stemness features and in vivo growth in lung adenocarcinoma. Oncogene. 2017;36:4641–4652. doi: 10.1038/onc.2017.91. [DOI] [PMC free article] [PubMed] [Google Scholar]
- 10.Huang L., Walter V., Hayes D.N., Onaitis M. Hedgehog-GLI signaling inhibition suppresses tumor growth in squamous lung cancer. Clin. Cancer Res. 2014;20:1566–1575. doi: 10.1158/1078-0432.CCR-13-2195. [DOI] [PMC free article] [PubMed] [Google Scholar]
- 11.Mazumdar T., DeVecchio J., Shi T., Jones J., Agyeman A., Houghton J.A. Hedgehog signaling drives cellular survival in human colon carcinoma cells. Cancer Res. 2011;71:1092–1102. doi: 10.1158/0008-5472.CAN-10-2315. [DOI] [PMC free article] [PubMed] [Google Scholar]
- 12.Zhang R., Wu J., Ferrandon S., Glowacki K.J., Houghton J.A. Targeting GLI by GANT61 involves mechanisms dependent on inhibition of both transcription and DNA licensing. Oncotarget. 2016;7:80190–80207. doi: 10.18632/oncotarget.13376. [DOI] [PMC free article] [PubMed] [Google Scholar]
- 13.Mazumdar T., DeVecchio J., Agyeman A., Shi T., Houghton J.A. The GLI genes as the molecular switch in disrupting Hedgehog signaling in colon cancer. Oncotarget. 2011;2:638–645. doi: 10.18632/oncotarget.310. [DOI] [PMC free article] [PubMed] [Google Scholar]
- 14.Pietrobono S., Gagliardi S., Stecca B. Non-canonical hedgehog signaling pathway in cancer: Activation of GLI transcription factors beyond smoothened. Front. Genet. 2019;10:556. doi: 10.3389/fgene.2019.00556. [DOI] [PMC free article] [PubMed] [Google Scholar]
- 15.Lauth M., Bergström A., Shimokawa T., Toftgård R. Inhibition of GLI-mediated transcription and tumor cell growth by small-molecule antagonists. Proc. Natl. Acad. Sci. USA. 2007;104:8455–8460. doi: 10.1073/pnas.0609699104. [DOI] [PMC free article] [PubMed] [Google Scholar]
- 16.Agyeman A., Jha B.K., Mazumdar T., Houghton J.A. Mode and specificity of binding of the small molecule GANT61 to GLI determines inhibition of GLI-DNA binding. Oncotarget. 2014;5:4492–4503. doi: 10.18632/oncotarget.2046. [DOI] [PMC free article] [PubMed] [Google Scholar]
- 17.Infante P., Mori M., Alfonsi R., Ghirga F., Aiello F., Toscano S., Ingallina C., Siler M., Cucchi D., Po A. Gli1/DNA interaction is a druggable target for Hedgehog-dependent tumors. EMBO J. 2015;34:200–217. doi: 10.15252/embj.201489213. [DOI] [PMC free article] [PubMed] [Google Scholar]
- 18.Manetti F., Stecca B., Santini R., Maresca L., Giannini G., Taddei M., Petricci E. Pharmacophore-Based Virtual Screening for Identification of Negative Modulators of GLI1 as Potential Anticancer Agents. ACS Med. Chem. Lett. 2020;11:832–838. doi: 10.1021/acsmedchemlett.9b00639. [DOI] [PMC free article] [PubMed] [Google Scholar]
- 19.Giannini G., Taddei M., Manetti F., Petricci E., Stecca B. Gli1 inhibitors and uses thereof. European patent EP3388419A1, filed. 2017 April 12, 2017, and published October 17, 2018. [Google Scholar]
- 20.Calcaterra A., Iovine V., Botta B., Quaglio D., D’Acquarica I., Ciogli A., Iazzetti A., Alfonsi R., Lospinoso Severini L., Infante P. Chemical, computational and functional insights into the chemical stability of the Hedgehog pathway inhibitor GANT61. J. Enzyme Inhib. Med. Chem. 2018;33:349–358. doi: 10.1080/14756366.2017.1419221. [DOI] [PMC free article] [PubMed] [Google Scholar]
- 21.Botta B., Alberto G., Botta M., Mori M., Di Marcotullio L., Infante P., Francesca G., Sara T., Cinzia I., Romina A. 2013. Multitarget Hedgehog pathway inhibitors and uses thereof. (Sapienza Università di Roma)https://web.uniroma1.it/dmm/node/8404 [Google Scholar]
- 22.Pavletich N.P., Pabo C.O. Crystal structure of a five-finger GLI-DNA complex: new perspectives on zinc fingers. Science. 1993;261:1701–1707. doi: 10.1126/science.8378770. [DOI] [PubMed] [Google Scholar]
- 23.Banerjee U., Ghosh M., Kyle Hadden M. Evaluation of vitamin D3 A-ring analogues as Hedgehog pathway inhibitors. Bioorg. Med. Chem. Lett. 2012;22:1330–1334. doi: 10.1016/j.bmcl.2011.12.081. [DOI] [PubMed] [Google Scholar]
- 24.DeBerardinis A.M., Raccuia D.S., Thompson E.N., Maschinot C.A., Kyle Hadden M. Vitamin D3 analogues that contain modified A- and seco-B-rings as hedgehog pathway inhibitors. Eur. J. Med. Chem. 2015;93:156–171. doi: 10.1016/j.ejmech.2015.01.049. [DOI] [PubMed] [Google Scholar]
- 25.Harrell W.A., Jr., Vieira R.C., Ensel S.M., Montgomery V., Guernieri R., Eccard V.S., Campbell Y., Roxas-Duncan V., Cardellina J.H., 2nd, Webb R.P., Smith L.A. A matrix-focused structure-activity and binding site flexibility study of quinolinol inhibitors of botulinum neurotoxin serotype A. Bioorg. Med. Chem. Lett. 2017;27:675–678. doi: 10.1016/j.bmcl.2016.11.019. [DOI] [PubMed] [Google Scholar]
- 26.Puskás L., Kanizsai I., Pillot T., Gyuris M., Szabó A., Takács F. Enantiomers Of 8-hydroxy Quinoline Derivatives And The Synthesis Thereof. WO 2016/162706 A1, 2016/03/07. 2016 [Google Scholar]
- 27.Kanizsai I., Madácsi R., Hackler L., Jr., Gyuris M., Szebeni G.J., Huzián O., Puskás L.G. Synthesis and cytoprotective characterization of 8-hydroxyquinoline Betti products. Molecules. 2018;23:1934. doi: 10.3390/molecules23081934. [DOI] [PMC free article] [PubMed] [Google Scholar]
- 28.Yang Z.-J., Ellis T., Markant S.L., Read T.-A., Kessler J.D., Bourboulas M., Schüller U., Machold R., Fishell G., Rowitch D.H. Medulloblastoma can be initiated by deletion of Patched in lineage-restricted progenitors or stem cells. Cancer Cell. 2008;14:135–145. doi: 10.1016/j.ccr.2008.07.003. [DOI] [PMC free article] [PubMed] [Google Scholar]
- 29.Markant S.L., Esparza L.A., Sun J., Barton K.L., McCoig L.M., Grant G.A., Crawford J.R., Levy M.L., Northcott P.A., Shih D. Targeting sonic hedgehog-associated medulloblastoma through inhibition of Aurora and Polo-like kinases. Cancer Res. 2013;73:6310–6322. doi: 10.1158/0008-5472.CAN-12-4258. [DOI] [PMC free article] [PubMed] [Google Scholar]
- 30.Brun S.N., Markant S.L., Esparza L.A., Garcia G., Terry D., Huang J.-M., Pavlyukov M.S., Li X.-N., Grant G.A., Crawford J.R. Survivin as a therapeutic target in Sonic hedgehog-driven medulloblastoma. Oncogene. 2015;34:3770–3779. doi: 10.1038/onc.2014.304. [DOI] [PMC free article] [PubMed] [Google Scholar]
- 31.Lever J., Krzywinski M., Altman N. Points of Significance: Principal component analysis. Nat. Methods. 2017;14:641–642. [Google Scholar]
- 32.David C.C., Jacobs D.J. Principal component analysis: a method for determining the essential dynamics of proteins. Methods Mol. Biol. 2014;1084:193–226. doi: 10.1007/978-1-62703-658-0_11. [DOI] [PMC free article] [PubMed] [Google Scholar]
- 33.Dijkgraaf G.J.P., Alicke B., Weinmann L., Januario T., West K., Modrusan Z., Burdick D., Goldsmith R., Robarge K., Sutherlin D. Small molecule inhibition of GDC-0449 refractory smoothened mutants and downstream mechanisms of drug resistance. Cancer Res. 2011;71:435–444. doi: 10.1158/0008-5472.CAN-10-2876. [DOI] [PubMed] [Google Scholar]
- 34.Sharpe H.J., Pau G., Dijkgraaf G.J., Basset-Seguin N., Modrusan Z., Januario T., Tsui V., Durham A.B., Dlugosz A.A., Haverty P.M. Genomic analysis of smoothened inhibitor resistance in basal cell carcinoma. Cancer Cell. 2015;27:327–341. doi: 10.1016/j.ccell.2015.02.001. [DOI] [PMC free article] [PubMed] [Google Scholar]
- 35.Atwood S.X., Sarin K.Y., Whitson R.J., Li J.R., Kim G., Rezaee M., Ally M.S., Kim J., Yao C., Chang A.L.S. Smoothened variants explain the majority of drug resistance in basal cell carcinoma. Cancer Cell. 2015;27:342–353. doi: 10.1016/j.ccell.2015.02.002. [DOI] [PMC free article] [PubMed] [Google Scholar]
- 36.Wu H.-M., Crothers D.M. The locus of sequence-directed and protein-induced DNA bending. Nature. 1984;308:509–513. doi: 10.1038/308509a0. [DOI] [PubMed] [Google Scholar]
- 37.van der Vliet P.C., Verrijzer C.P. Bending of DNA by transcription factors. BioEssays. 1993;15:25–32. doi: 10.1002/bies.950150105. [DOI] [PubMed] [Google Scholar]
Associated Data
This section collects any data citations, data availability statements, or supplementary materials included in this article.