Song X, Chen D, Yuan M, Wang H, Wang Z. Cancer Manag. 2018;10:6677–6683
On page 6677, Abstract, Results subheading, the median baseline PLR should be 136.1.
On page 6680, Results section, 2nd paragraph, the median baseline PLR should be 136.1.
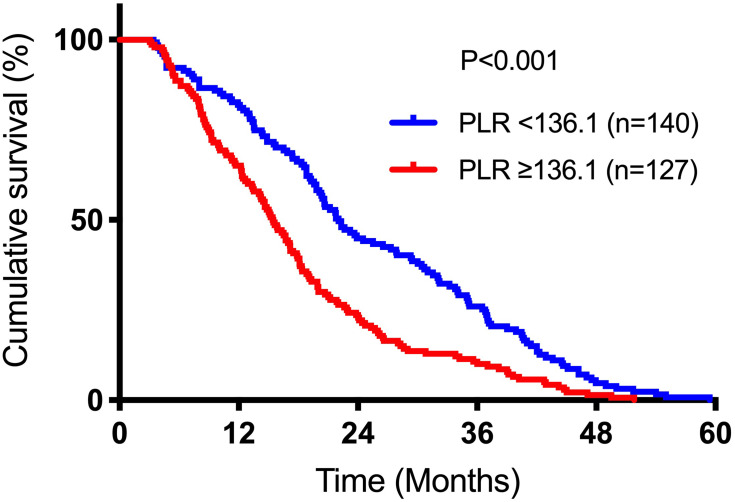
On page 6680, the red curve should be PLR ≥136.1 and the blue cure should be PLR <136.1. The COX analysis was not correct in the previous publication and it has been revised and shown below in the new Tables 1 and table 2. The correct Figure 3 is shown below.
Table 2.
Univariate analysis of factors potentially associated with overall survival
| Characteristics | HR | 95% CI | P Value |
|---|---|---|---|
| Age ≥65 | 0.778 | 0.609–0.994 | 0.045 |
| Male | 0.935 | 0.733–1.193 | 0.588 |
| KPS score ≥70 | 1.100 | 0.762-1.588 | 0.611 |
| TNM stage IIIB | 1.024 | 0.763-1.375 | 0.874 |
| Current smoker | 0.918 | 0.748-1.126 | 0.412 |
| Receipt of induction chemotherapy | 1.127 | 0.881-1.443 | 0.342 |
| Receipt of concurrent chemotherapy | 0.868 | 0.660-1.143 | 0.314 |
| Pretreatment TLC ≥2.4 × 10³/μL | 0.594 | 0.464-0.759 | <0.001 |
| Pretreatment NLR ≥3.4 | 2.280 | 1.776–2.927 | <0.001 |
| Pretreatment PLR ≥136.1 | 1.745 | 1.364-2.232 | <0.001 |
Abbreviations: HR, hazard ratio; CI, confidence interval; ECOG PS, Eastern Cooperative Oncology Group performance status; TNM, tumor-nodes-metastasis; TLC, total lymphocyte count; NLR, neutrophil-to-lymphocyte ratio; PLR, platelet-to-lymphocyte ratio.
Table 3.
Multivariate analysis of factors potentially associated with overall survival Model 1 (TLC included)
| Model 1 (TLC Included) | Model 2 (NLR Included) | Model 3 (PLR Included) | |||||||
|---|---|---|---|---|---|---|---|---|---|
| HR | 95% CI | P Value | HR | 95% CI | P Value | HR | 95% CI | P Value | |
| Characteristics | |||||||||
| Age ≥65 | 0.902 | 0.697-1.167 | 0.431 | 0.858 | 0.67-1.099 | 0.226 | 0.825 | 0.645-1.054 | 0.124 |
| Pretreatment TLC ≥2.4 × 10³/μL | 0.613 | 0.474-0.794 | <0.001 | ||||||
| Pretreatment NLR ≥3.4 | 2.231 | 1.734-2.87 | <0.001 | ||||||
| Pretreatment PLR ≥136.1 | 1.71 | 1.333-2.185 | <0.001 | ||||||
Abbreviations: HR, hazard ratio; CI, confidence interval; ECOG PS, Eastern Cooperative Oncology Group performance status; TNM, tumor-nodes-metastasis; TLC, total lymphocyte count; NLR, neutrophil-to-lymphocyte ratio; PLR, platelet-to-lymphocyte ratio.
Figure 3.
Kaplan–Meier plots of overall survival among patients who receivedchemoradiotherapy for advanced NSCLC stratified by baseline PLR.
Abbreviations: NSCLC, non–small cell lung cancer; PLR, platelet-to-lymphocyteratio.
On page 6680, Table 2, the COX analysis was not correct in the previous publication and it has been revised. The correct Table 2 is shown below.
On page 6681, Table 3, the COX analysis was not correct in the previous publication and it has been revised. The correct Table 3 is shown below.
The authors have advised errors were caused by carelessness and mis-operation in statistics.
The authors apologize for this error and advise it does not affect the results of the paper.


