Fig. 5.
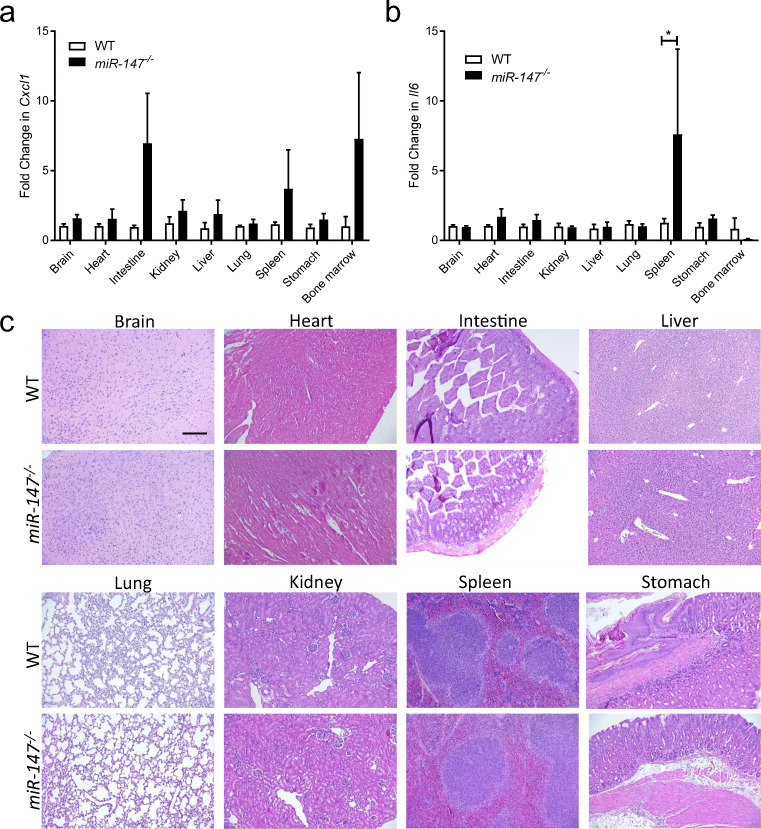
Characterization of miR-147−/− mice. a, b Baseline mRNA expression level of inflammatory genes including Cxcl1 and Il6 in various organs isolated from WT and miR-147−/− mice (KO). c Representative images of H&E staining from mouse tissues including the brain, heart, intestine, liver, lung, kidney, spleen, and stomach to compare histology of WT and miR-147−/− mice (scale bar: 200 μm). All graphs represent mean ± SEM. *P < 0.05 (n = 6 mice/group) relative to WT, by two-way ANOVA with Bonferroni’s multiple comparisons.

