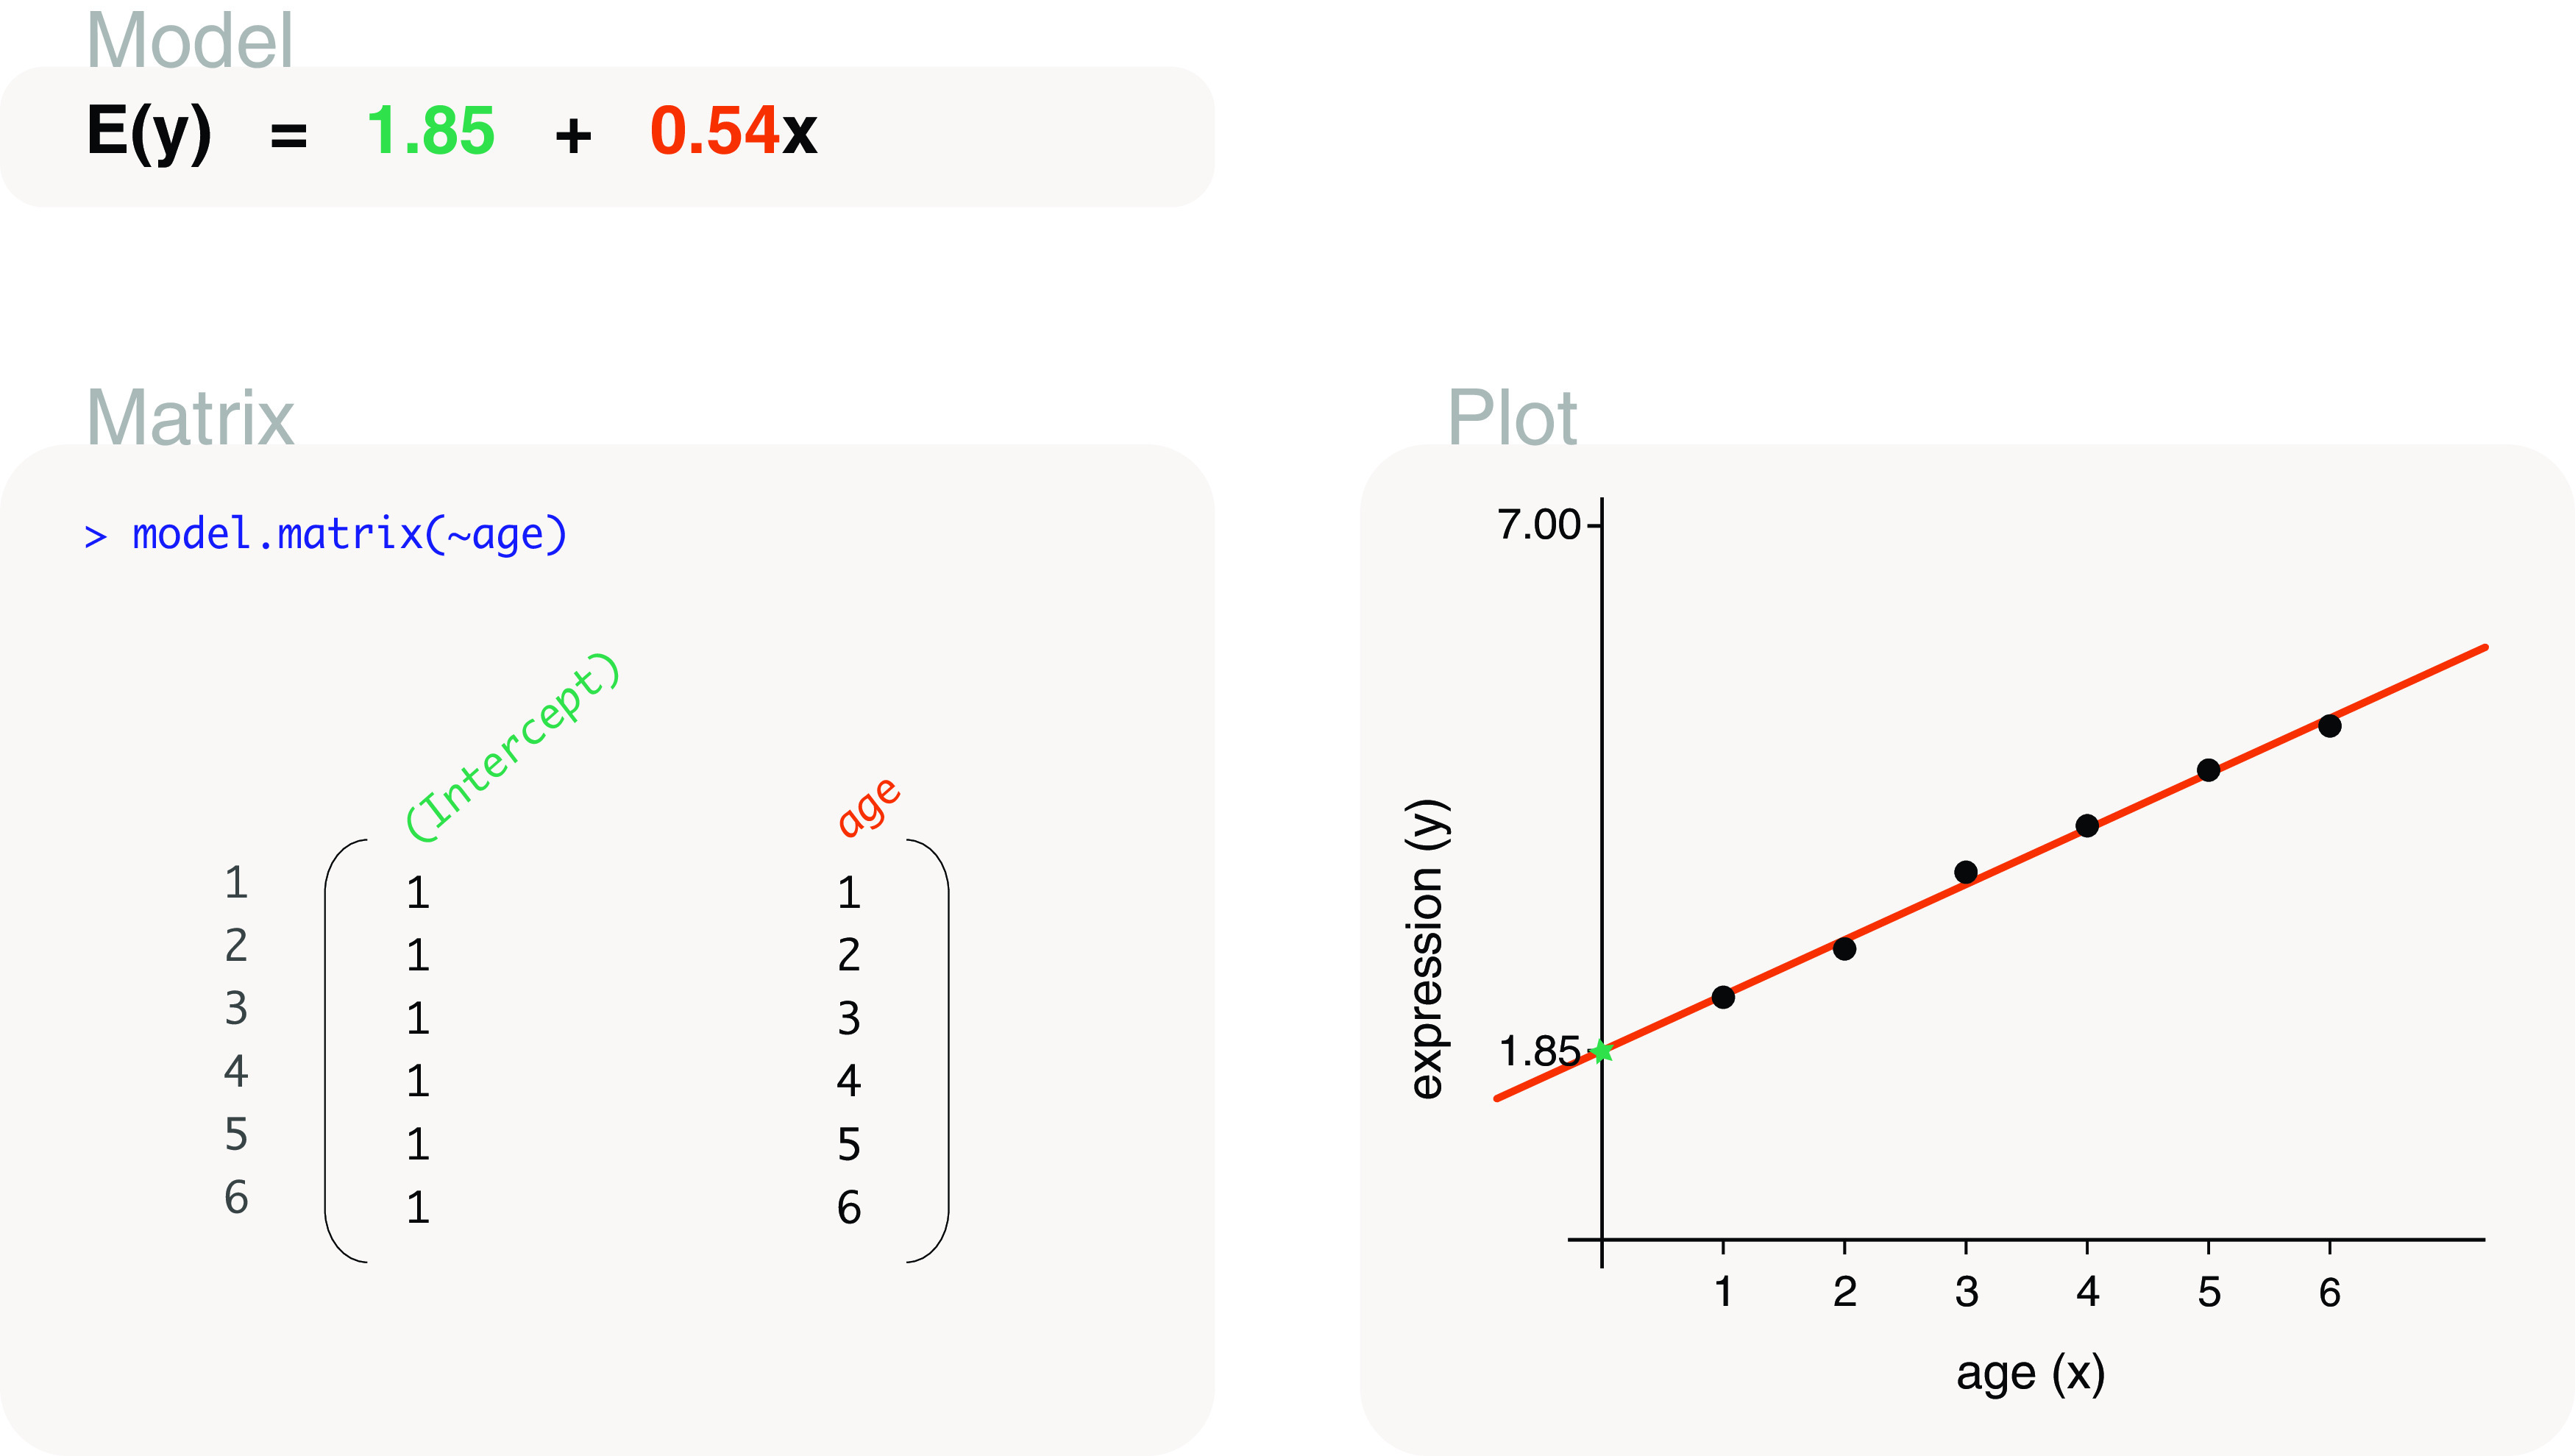
Figure 3. Expected gene expression is modelled by an age covariate, which is denoted as x in the model and plot.

This particular model includes an intercept term so that the model (line) has flexibility in intersecting the y-axis at any point. MODEL: The fitted model in written form, where y represents gene expression and E( y) expected gene expression. Estimated model parameters are highlighted in colour. MATRIX: R input and output for the associated design matrix, with the colour of column names (model parameters) matching that of the estimated parameters above. For simplicity, ”assign” and ”contrasts” attributes of the design matrix are not displayed in our figures (see ‘?stats::model.matrix’ for more). PLOT: Observed data points are drawn together with the fitted model representing expected gene expression. Where appropriate, aspects of the fitted model are drawn in a colour that matches associated parameter estimates.
