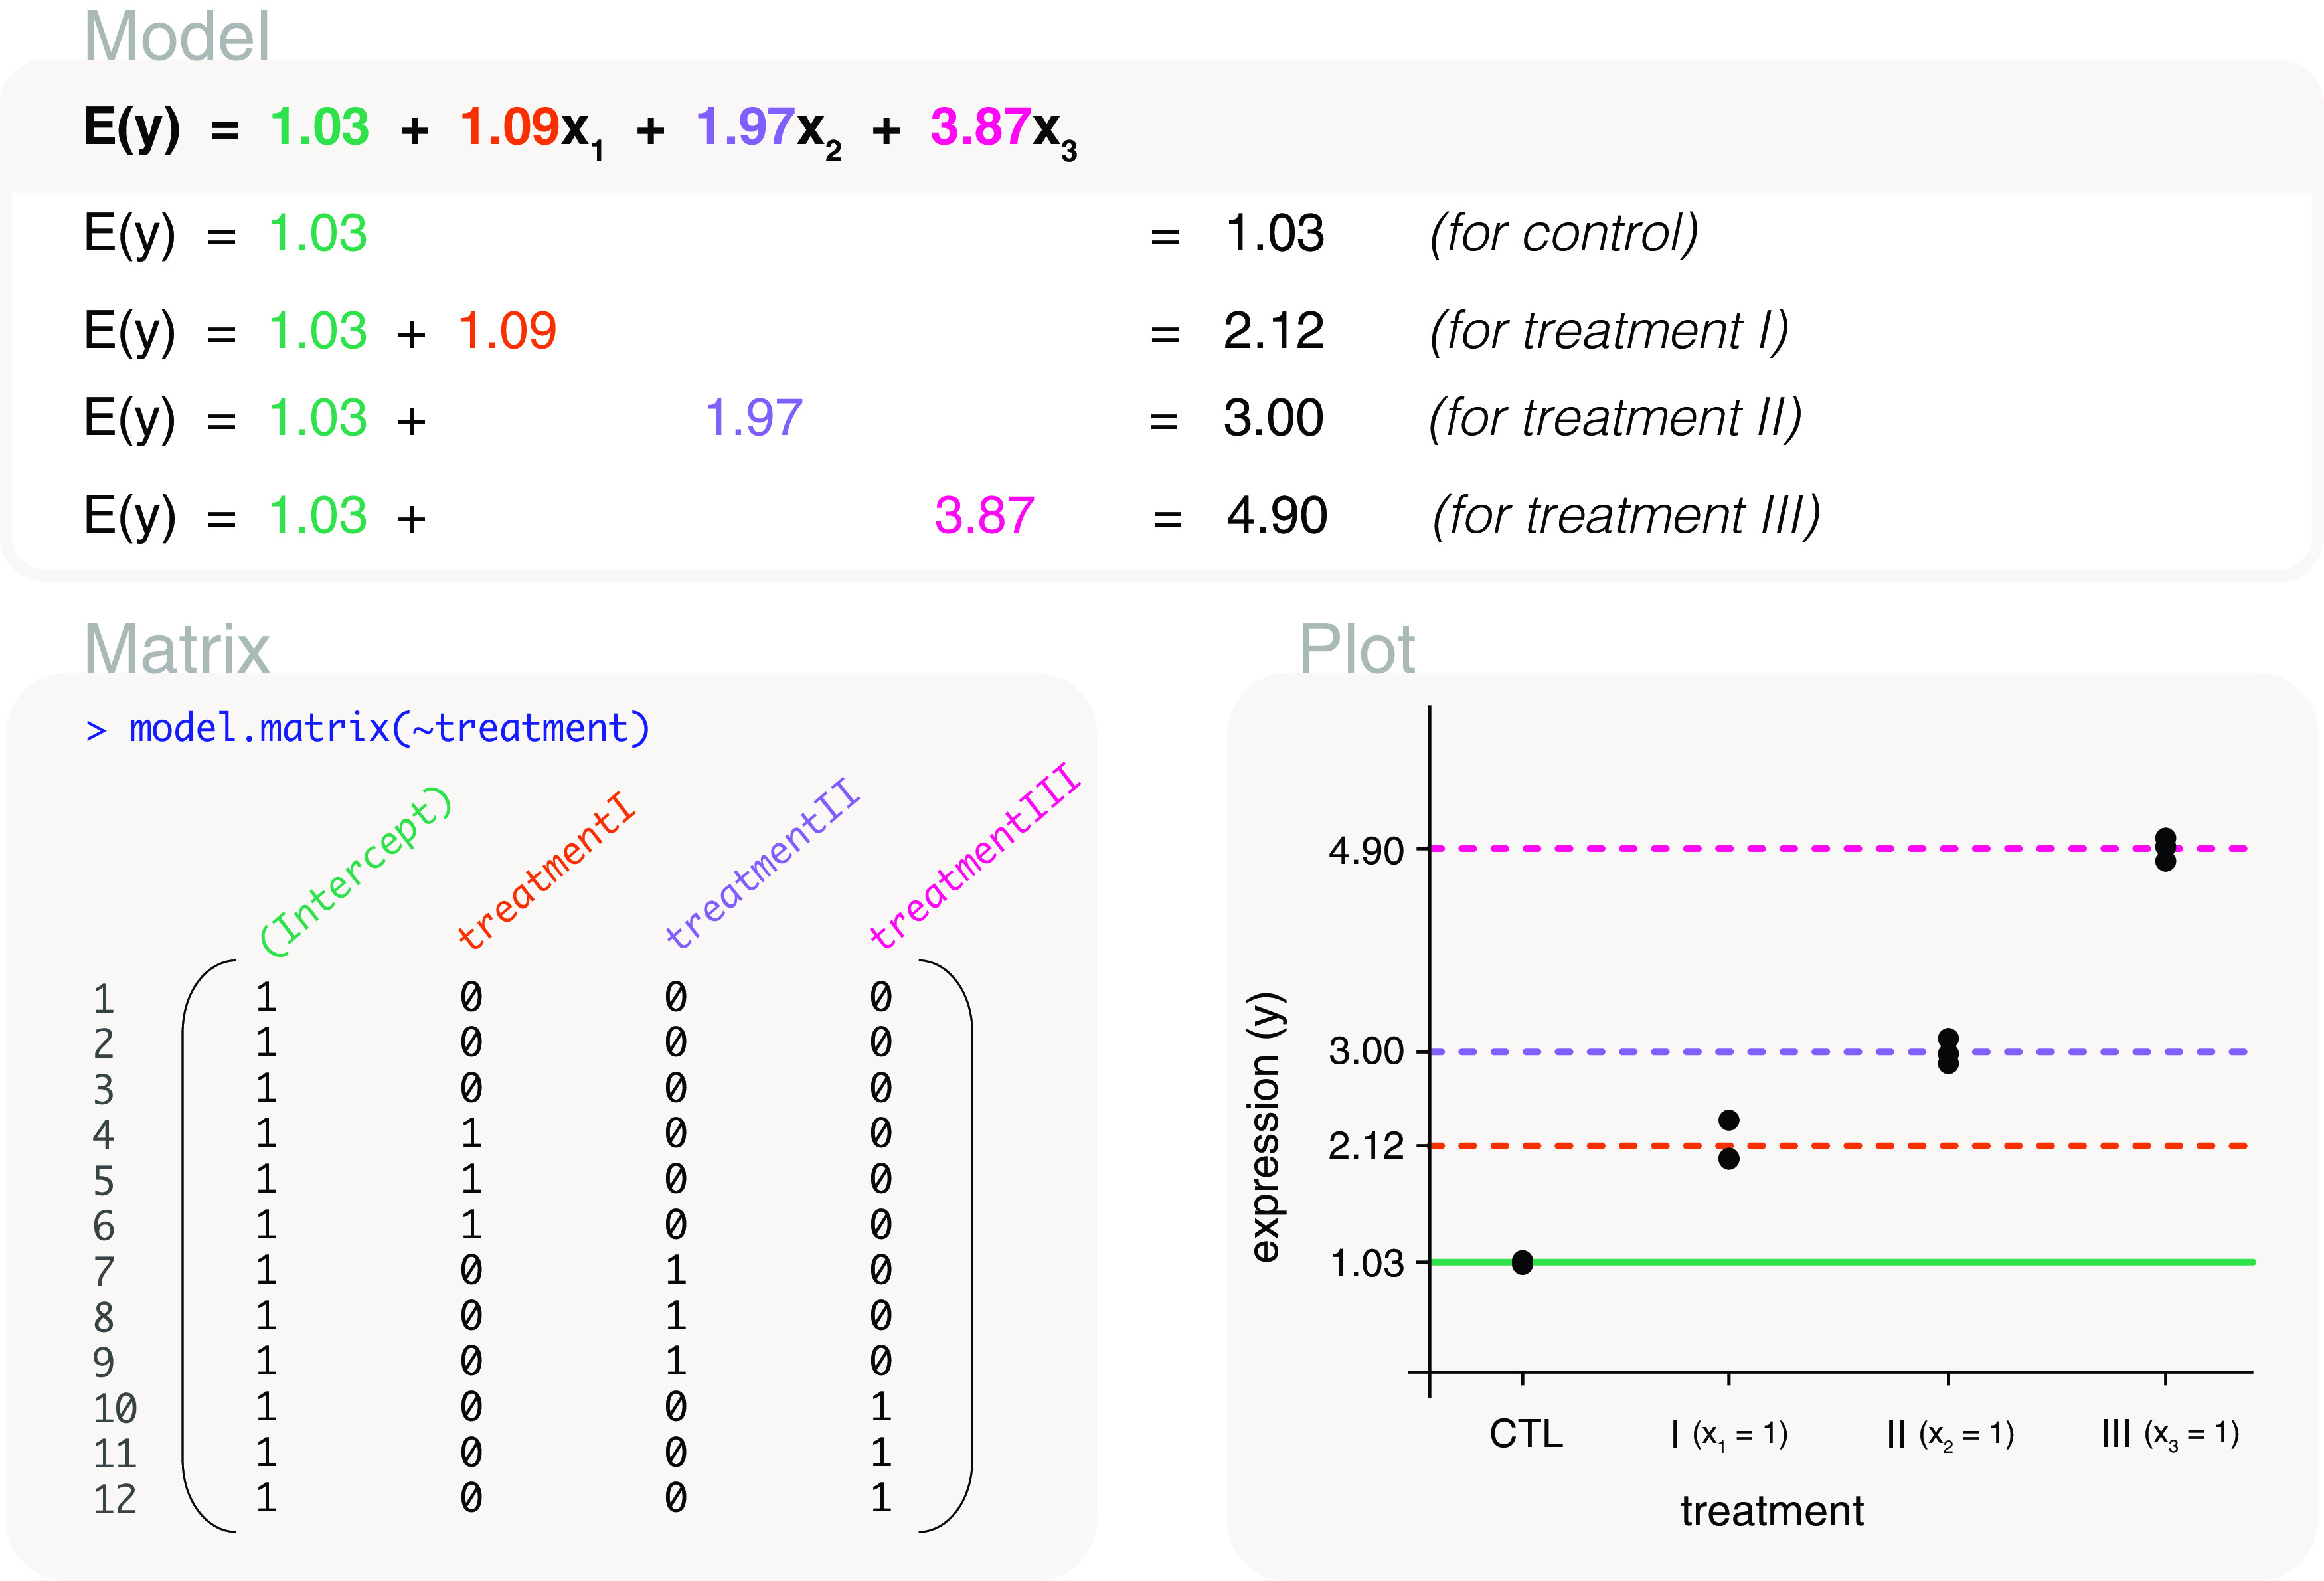
Figure 7. Expected gene expression is modelled by a treatment factor.

The design matrix that is used includes an intercept term which represents the mean gene expression of the control group, or the reference level in the treatment factor. Other levels in the factor have mean gene expression represented relative to the control group. This means that the second to fourth parameters in the mean-reference model represent gene expression differences between treatment groups and the control group. The x’s in the model are indicator variables for treatment groups, with x 1 = 1 for treatment I, x 2 = 1 for treatment II, and x 3 = 1 for treatment III.
