

Abstract
Neuromodulators are important regulators of synaptic transmission throughout the brain. At the presynaptic terminal, neuromodulation of calcium channels (CaVs) can affect transmission not only by changing neurotransmitter release probability, but also by shaping short-term plasticity (STP). Indeed, changes in STP are often considered a requirement for defining a presynaptic site of action. Nevertheless, some synapses exhibit non-canonical forms of neuromodulation, where release probability is altered without a corresponding change in STP. Here, we identify biophysical mechanisms whereby both canonical and non-canonical presynaptic neuromodulation can occur at the same synapse. At a subset of glutamatergic terminals in prefrontal cortex, GABAB and D1/D5 dopamine receptors suppress release probability with and without canonical increases in short-term facilitation by modulating different aspects of presynaptic calcium channel function. These findings establish a framework whereby signaling from multiple neuromodulators can converge on presynaptic CaVs to differentially tune release dynamics at the same synapse.
Keywords: neuromodulation, dopamine, synaptic transmission, short term plasticity, prefrontal cortex
ETOC
Presynaptic neuromodulators like GABAB receptors impose high-pass filters on synaptic transmission, facilitating release when inputs arrive at high frequency. Burke et al., show that unlike GABAB, dopamine suppresses glutamatergic release in prefrontal cortex independent of frequency, thus regulating synaptic gain.
Introduction
Neuromodulators regulate synaptic transmission through a wide array of biophysical mechanisms (Chalifoux and Carter, 2011; Seamans and Yang, 2004; Tritsch and Sabatini, 2012). In presynaptic boutons, neuromodulators can affect the function of voltage-gated calcium channels, which in turn alters the probability of vesicle release (PR) (Branco and Staras, 2009). Due to complex interactions between calcium influx and vesicle release machinery in the presynaptic active zone, changes in PR typically do not result in a simple change in gain (i.e. a linear scaling of synaptic strength). Canonically, presynaptic modulators change the relative strength of subsequent closely-timed synaptic events, a phenomenon termed short-term plasticity (STP) (Kamiya and Zucker, 1994; Zucker and Regehr, 2002; Hennig, 2013; Jackman and Regehr, 2017). However, exceptions to this rule have been observed for a variety of neuromodulators and synapses. In these instances, presynaptic modulation suppresses release probability without canonical changes in STP (Gao et al., 2001; Seamans et al., 2001; Delaney et al., 2007; Li et al., 2012; Holmes et al., 2017; Tejeda et al., 2017). Moreover, modulation with and without parallel changes in STP has been observed at a single synapse in response to two different neuromodulators (Hefft et al., 2002; Delaney et al., 2007; Li et al., 2012; Tejeda et al., 2017). Why this occurs at some synapses, and why different neuromodulators evoke different forms of presynaptic suppression, is unclear.
In prefrontal cortex (PFC), there is evidence that GABA and dopamine may differentially regulate glutamatergic transmission by activating presynaptic GABAB receptors (GABABR) and D1/D5 family dopamine receptors (D1R). At these synapses, GABABR activation acts as a canonical presynaptic neuromodulator, robustly reducing PR for single presynaptic action potentials (APs) but facilitating later events in a high frequency burst of APs (Chalifoux and Carter, 2011). As such, GABABR activation is thought to impose a high-pass filter on these synapses (Abbott and Regehr, 2004). How dopamine regulates the same synapses is less clear. Dopamine modestly suppresses glutamatergic excitatory postsynaptic currents when EPSCs are evoked by local electrical stimulation (Seamans et al., 2001; Urban et al., 2002). By contrast, EPSCs between synaptically-coupled pairs of glutamatergic neurons are more strongly suppressed, suggesting that dopamine may suppress presynaptic release in an input-specific manner (Gao et al., 2001; Gao and Goldman-Rakic, 2002; Gao et al, 2003; but see Urban et al., 2002). Although other lines of evidence suggest a presynaptic site of action, this modulation occurs without a change in STP (Gao et al., 2001; Seamans et al., 2001). Thus, in contrast to GABAB, dopamine may act non-canonically to regulate presynaptic gain. This may be important for the hypothesized role of D1R in suppressing background noise during working memory tasks in vivo (Vijayraghavan et al., 2007).
Using a combination of pharmacology, 2-photon calcium imaging, and computational modeling, we found that activation of either D1R or GABABR suppressed PR, but with differential effects on short-term dynamics. We examined D1R modulation at a variety of glutamatergic inputs to PFC and found that D1R suppressed glutamatergic transmission at only a subset of inputs, but did so with no increase in short-term facilitation. At synapses where D1R-mediated suppression was present, GABABR activation also suppressed vesicular release probability, but with canonical increases in short-term facilitation. At these synapses, we show that release is likely mediated by a very small number of CaVs, and that these CaVs are the targets of both D1R and GABABR signaling. Interestingly, D1R and GABABR regulate different biophysical properties of presynaptic CaVs, which alone were sufficient to account for the differences in STP. Thus, the interplay between CaV function and vesicle release machinery, combined with the precise mechanism by which CaVs are regulated, can bias how neuromodulators regulate synaptic transmission.
Results
Dopaminergic modulation of glutamatergic inputs to PFC
To test the sensitivity of specific PFC excitatory inputs to dopaminergic modulation, we made whole-cell recordings from pyramidal cells in layer 5b of PFC and evoked EPSCs either via local electrical stimulation (eEPSC), which recruits an unknown population of inputs, or via optogenetic recruitment of anatomically-specified inputs (oEPSC, Fig. 1A, B). Stimuli were delivered every 15 seconds and resulting EPSCs were monitored in cells voltage-clamped to −80 mV. EPSCs were almost entirely blocked by the AMPA/kainate antagonist NBQX (10 μM; residual current=1.4±0.8% of baseline, n=11). Following a stable baseline, D1Rs were activated by application of the D1-selective agonist SKF 83822 (20 μM, with 1 μM of the D2-family antagonist sulpiride present throughout recording). Consistent with previous findings (Seamans et al., 2001), eEPSCs evoked by local electrical stimulation were only modestly suppressed (Fig. 1C, E; Norm Amp: 0.88±0.05 of baseline, n=16, p<0.05, rank-sum test). This suggests that dopamine either has minimal effects on all glutamatergic inputs to these neurons, or perhaps selective effects depending on the input source.
Fig 1. D1R Suppresses a Subset of Excitatory Synapses in PFC.
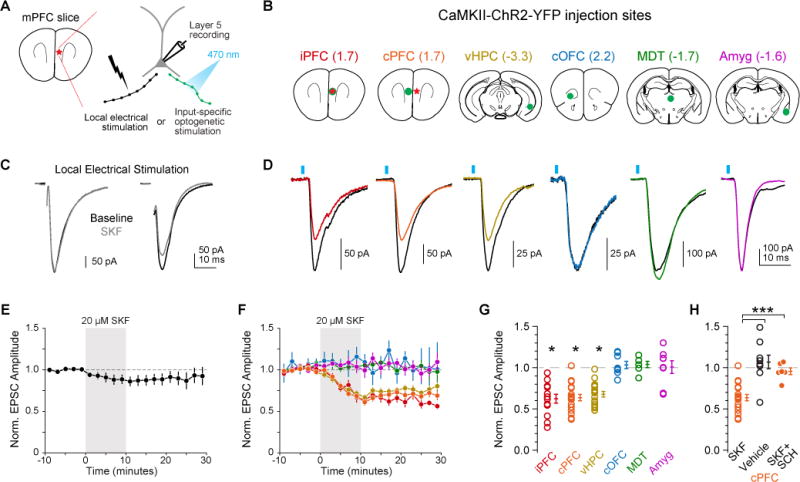
A) Schematics of in vitro recording location in mPFC (left) and stimulation configurations (right). EPSCs currents were evoked via local theta-barrel electrode or by input-specific ChR2 stimulation.
B) ChR2-expressing virus injection locations, with injection sites shown in green and recording site in red where applicable. Numbers in parenthesis are distance from bregma (mm).
C) Representative effects of D1R activation on electrode-evoked eEPSCs. Baseline: black. Post-SKF: grey.
D) Same as C, but for oEPSCs. Baseline: black. Post SKF: other colors.
E, F) Summary of normalized EPSC amplitude over time for both eEPSC and oEPSC conditions (color coding as in B–D).
G) Summary of change in EPSC after D1R activation (same cells as in F).
H) Modulation of cPFC oEPSCs with vehicle or D1R activation in presence of D1R antagonist SCH23390.
To distinguish between these possibilities, we injected a virus encoding channelrhodopsin2 (ChR2) into six major glutamatergic input sources to mPFC (Figs. 1B, S1; either AAV5-CaMKIIα-ChR2-EYFP or AAV5-Ef1α-DIO-ChR2-EYFP, see Methods). Injections were made in PFC, both ipsilateral and contralateral to the recording site (iPFC, cPFC); ipsilateral ventral hippocampus (vHPC); contralateral orbitofrontal cortex (cOFC); ipsilateral mediodorsal thalamus (MDT); or ipsilateral amygdala (Amyg). In contrast to local electrical stimulation, optically-evoked oEPSCs were modulated by SKF in only 3 of 6 inputs (Fig. 1D, F, G): iPFC, cPFC and vHPC (iPFC, Norm Amp: 0.62±0.05, n=13, p<0.01; cPFC: 0.64±0.04, n=18, p<0.01; vHPC: 0.66±0.04, n=18, p<0.01; rank-sum test), and were blocked by the D1 antagonist SCH 23390 (10 μM SCH; Norm Amp: 0.96±0.04, n=6, p<0.01 vs. SKF alone, rank-sum test; Fig. 1H). Inputs from cOFC, MDT, and Amyg were insensitive to D1 agonist application (cOFC, Norm Amp: 1.03±0.04, n=8, p=0.47; MDT:=1.04±0.04, n=6, p=0.37; Amyg: 1.01±0.08, n=8, p=0.93, rank-sum test). Taken together, these data suggest that D1Rs suppress a subset of glutamatergic inputs into PFC that is defined, at least in part, by anatomical source.
The pattern of modulation observed above can be explained most easily by input-specific, presynaptic actions of D1Rs. To identify the locus of dopaminergic modulation, we first examined the paired pulse ratio (PPR) and coefficient of variation (CV) of oEPSCs in modulated pathways. At many synapses, reductions in release probability (PR) are accompanied by an increase in PPR and a decrease in CV−2, whereas changes in postsynaptic charge transfer per vesicle lead to reductions in EPSC amplitude with no change in PPR or CV−2 (Clements, 1990; Kamiya and Zucker, 1994; Quastel, 1997; Sigworth, 1980). We first validated that PPR and CV accurately reflect changes to pre-and postsynaptic aspects of transmission by altering extracellular calcium (Ca) concentration, which changes PR, or by applying subsaturating concentrations of the AMPA/kainate receptor antagonist NBQX, which attenuates EPSC amplitude without altering PR. These manipulations were calibrated to suppress the amplitude of the first oEPSC to a similar extent as observed after D1R activation. Neither PPR nor CV−2 was affected by NBQX application (40 nM), consistent with its postsynaptic actions (Norm Amp: 0.70±0.04, p<0.001, Norm PPR: 0.99±0.04, p=0.86, Norm CV−2: 0.98±0.05, p=0.72; n=8, rank-sum test). In contrast, both PPR and CV−2 co-varied with EPSC amplitude when extracellular calcium concentration was changed (Fig. 2A–C, ΔCa2+; relative to 1.3 mM CaCl2. All data normalized to baseline. 2.0 mM, Amp: 1.43±0.07, PPR: 0.82±0.03, CV−2: 3.00±0.82, n=9; 0.9 mM, Amp: 0.77±0.06, PPR=1.11±0.05, CV−2=0.43±0.09, n=10; 0.75 mM, Amp: 0.49±0.06, PPR=1.30±0.07, CV−2=0.53±0.07, n=9; PPR vs Ca2+, chi-square statistic=18.19, p<0.001, Kruskal-Wallis; CV−2 vs Ca2+, chi-square statistic=18.22, p<0.001, Kruskal-Wallis). Furthermore, baseline paired-pulse facilitation was comparable between the electrical and optical stimulation methods (for oEPSC, PPR=1.38, 1.08 – 1.70 for median, 25th – 75th percentile, n=98 cells; for eEPSC, PPR=1.57, 1.27 – 1.83 for median, 25th – 75th percentile, n=16; p=0.12, rank-sum test). Taken together, this indicates that PPR and CV−2 can distinguish between canonical pre- and postsynaptic manipulations at these synapses.
Fig 2. D1R Modulates oEPSC Amplitude, Coefficient of Variation and Release Probability, but not Paired-Pulse Ratio.
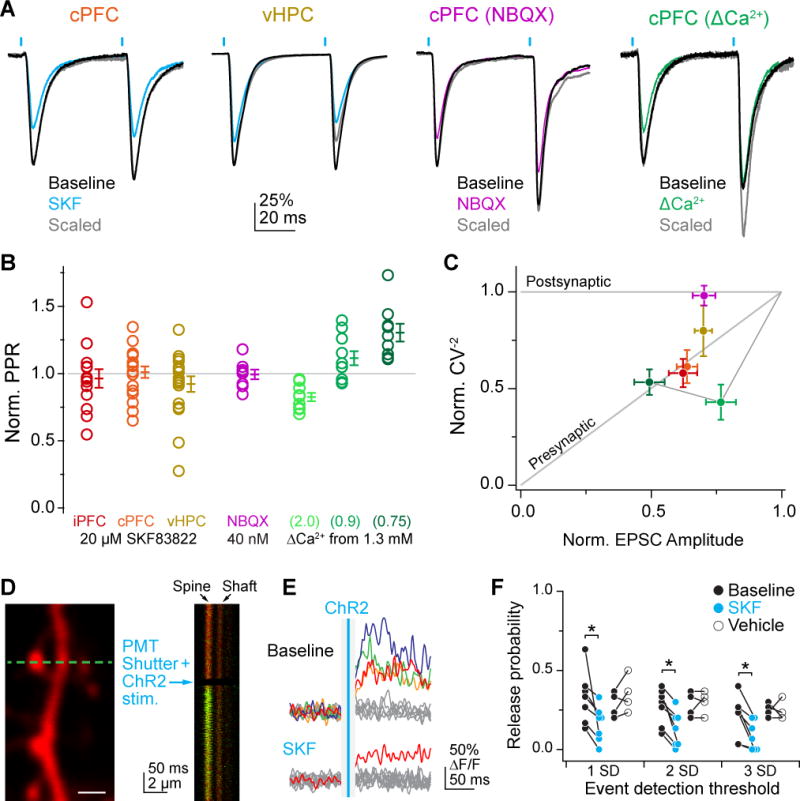
A) Examples of D1R modulation of paired pulses. Baseline: black. Post-SKF: cyan. Post-SKF scaled: grey. From left to right: D1R activation of oEPSCs from cPFC and vHPC, subsaturating NBQX on cPFC oEPSCs (40 nM) and reduced extracellular calcium on cPFC oEPSCs. All traces scaled to baseline amplitude of first oEPSC for comparison.
B) Summary of PPR change. Colors as in A, with D1R activation of iPFC oEPSCs in red. All values normalized to pre-drug baseline, except ΔCa conditions are normalized to PPR at 1.3 mM.
C) Normalized CV plotted against change in oEPSC amplitude. Colors as in B. Line connects green ΔCa conditions in order of decreasing extracellular Ca concentration.
D) Spine imaging configuration for OQA. Left: Example of Alexa 594 fluorescence in dendritic shaft and spines, with linescan location indicated by dashed blue line. Right: Example single trial linescan of dendritic spine and shaft on left. PMTs were shuttered during LED stimulation. Note that shutter reopening resulted in a small amount of vibration, which is largely cancelled out when averaging fluorescence over the spine head area of the linescan.
E) Trials before and after bath application of SKF. Data analyzed from Fluo-5F fluorescence only (ΔF/F). Grey and non-grey lines indicate failure and success trials, respectively. Blue vertical line is ChR2 timing.
F) Changes in PR with D1R stimulation or vehicle. All PR measures are calculated as the ratio of successful trials to total trials. Different thresholds for defining a success trial are shown along the x-axis.
To examine how PPR is affected by D1Rs, oEPSCs were evoked in each dopamine-sensitive pathway. Comparable levels of paired pulse facilitation were observed at baseline for iPFC, cPFC, and vHPC inputs (1.31±0.09, 1.31±0.08, 1.10±0.08, respectively; 50 ms interstimulus interval). Interestingly, PPR was not increased after D1-dependent modulation of iPFC, cPFC, or vHPC inputs (Fig. 2A–C, SKF, for iPFC, cPFC and vHPC, respectively: Norm PPR: 0.96±0.07, 1.01±0.04, 0.93±0.07; n=13, 18, 18; p=0.60, 0.83, 0.20, rank-sum test with Holm-Sidak correction vs PPR=1.00; chi-square statistic=1.57, p=0.67, Kruskal-Wallis), a result consistent with previous studies in PFC (Gao et al., 2001; Seamans et al., 2001). In contrast, CV−2 was reduced at both prefrontal inputs, and trended towards a decrease for ventral hippocampal inputs (iPFC, cPFC and vHPC, respectively: Norm CV−2=0.58±0.07, 0.61±0.09, 0.82±0.10; p=0.0001, =0.0003, =0.107).
Given the disagreement between PPR and CV results, we next sought to isolate pre- and postsynaptic components of synaptic transmission. To examine presynaptic release probability, we used optical quantal analysis (OQA), where transmission success and failures can be monitored at single synapses via NMDA receptor-mediated spine Ca influx (Mainen et al., 1999; Oertner et al., 2002; Higley et al., 2009; Little and Carter, 2012). Pyramidal cells were voltage-clamped to 0 mV to inactivate calcium channels, and spines responsive to ChR2 stimuli were identified using Fluo-5F (Figure 2D–F). Release probability across all tested spines was 0.28±0.03 at baseline (range=0.10–0.40, n=11 spines, 30 trials each). After pharmacological activation of D1Rs, release probability was significantly reduced (Figure 2E–F, success threshold=2 S.D. of noise; baseline PR=0.27±0.04, post-SKF PR=0.13±0.04, n=7, p<0.05, signed-rank test). Release probability was unaltered in time-locked controls (baseline PR=0.28±0.04, post-vehicle PR=0.30±0.04, n=4, p>0.99, signed-rank test). Data were consistent when using different noise thresholds to define success and failure trials (see Methods; success threshold=1 S.D. of noise; SKF - baseline PR=0.33±0.06, post-SKF PR=0.16±0.04, n=7, p<0.05, Vehicle - baseline PR=0.28±0.04, post-vehicle PR=0.35±0.06, n=4, p=0.375; success threshold=3 S.D. of noise; SKF - baseline PR=0.21±0.05, post-SKF PR=0.09±0.03, n=7, p<0.05, Vehicle - baseline PR=0.25±0.02, post-vehicle PR=0.24±0.03, n=4, p>0.99). These data indicate that D1Rs suppress release probability at individual PFC synapses.
To isolate potential postsynaptic modulation by D1Rs, we bypassed transmitter release and instead uncaged glutamate on single spines. Uncaging pulses were delivered in a pair, with increased intensity on the second pulse to mimic paired pulse facilitation observed using ChR2 stimulation. No change in uEPSC amplitude or PPR was noted (Fig. S4. Norm. uEPSC amplitude=1.01±0.11, 0.97±0.06, n=8, 11 for SKF and vehicle, respectively; p=0.62, Mann-Whitney U test, SKF vs. vehicle; Unnormalized PPR=1.45±0.21, 1.41±0.16, 1.41±0.10, 1.40±0.07, n=8, 8, 11,11 for SKF baseline, post-SKF, vehicle baseline and post-vehicle, respectively; p=0.87, Mann-Whitney U test for SKF baseline vs vehicle baseline; p>0.99,=0.86, Wilcoxon signed rank test for baseline PPR vs post condition for SKF and vehicle, respectively).
D1 receptors are more commonly expressed in thin-tufted layer 5 pyramidal cells in PFC, which have intrinsic cell properties that can be distinguished from neighboring cell classes (Gee et al., 2012; Seong and Carter, 2012; Clarkson et al., 2017). To determine whether postsynaptic cell type contributes to D1-dependent modulation of oEPSCs, we divided the dataset from Fig. 1 not by projection source, but by postsynaptic cell class and found that D1R-dependent modulation was present in putative D1-expressing and D1-lacking cell classes (Fig. S2C, D). Taken together with OQA and uncaging experiments, these data indicate that D1R suppression of long-range EPSCs is due to presynaptic suppression of release probability, despite the fact that this modulation does not increase PPR.
How might D1Rs suppress release probability without increasing paired-pulse facilitation? D1Rs have been observed to regulate the high voltage-activated CaVs that underlie transmitter release (Surmeier et al., 1995; Zhang et al., 2002; Seamans and Yang, 2004). To test whether D1Rs regulate presynaptic calcium influx, we imaged calcium in axonal boutons that originated from different long-range inputs using 2-photon laser scanning microscopy. We used a similar viral strategy as with ChR2, injecting both AAV5-hSyn-DIO-gCaMP6f and AAV5-Ef1α-Cre into the same brain regions as studied above in animals from a Cre-dependent tdTomato reporter line (Ai14; Fig. 3A). In a subset of experiments, we confirmed that gCaMP6f responses were AP-mediated by visually ensuring that responses to a prolonged train of stimuli (50x 50Hz, Fig. 3A) were blocked by 1 μM tetrodotoxin (n=6 boutons, 3 slices). When assessing D1R modulation, stimuli were limited to 3x 50Hz, as this produced reliable gCaMP signals that were restricted to individual boutons (Fig. S5, gCaMP full-width half-max 1.70±0.16 μm before stimulus vs. 1.68±0.16 μm after stimulus, n=8, p=0.88, rank-sum test). Consistent with oEPSC results, D1R activation strongly suppressed action-potential evoked calcium influx in axonal boutons from cPFC and vHPC, but not cOFC, MDT or Amyg (Fig. 3B, C; Norm Peak ΔF/F=0.57±0.07, 0.71±0.08, 1.04±0.09, 1.01±0.11, 0.99±0.07; n=13, 12, 14, 13, 10; p<0.001, =0.003, =0.64, =0.96, =0.72, respectively; rank-sum test with Holm-Sidak correction), and modulation was blocked by SCH 23390 (10 μM; Fig. 3D; for SKF, Vehicle, and SKF+SCH, respectively: Norm Peak ΔF/F=0.57±0.07, 1.04±0.05, 1.03±0.08; n=13, 7, 14; chi-square statistic=14.80, p<0.001, Kruskal-Wallis; SKF vs. Vehicle p<0.001, SKF vs. SKF+SCH p<0.001, rank-sum test with Holm-Sidak correction). Note that iPFC boutons were not measured with this approach, as boutons could not be resolved within the dense fluorescence of the injection site. Instead, modulation at iPFC boutons was assessed by imaging axon calcium influx with synthetic indicators during whole-cell recordings (see Fig. 4). Overall, these data suggest that D1Rs suppress specific PFC glutamatergic inputs by a non-canonical presynaptic mechanism that reduces vesicle release probability without increasing paired-pulse facilitation.
Fig 3. D1R Suppresses Evoked Axonal Calcium Influx in PFC.

A) Long-range axon imaging configuration. Left: Schematic of recording. Injection site in green, stimulation and imaging location in red box. Middle: Example fluorescence response of axonal boutons. Red fluorescence was used to locate boutons, green fluorescence was monitored in response to electrical stimulation. Arrows highlight two boutons quantified in right panel. Right: Normalized change in fluorescence for example boutons from middle panels.
B) Evoked gCaMP6f signals in PFC boutons. SKF-mediated suppression was blocked by SCH23390.
C) Summary of change in peak ΔF/F in response to D1R activation for different long-range iputs to PFC (colors as in Figs. 1–2).
D) Summary of modulation of peak ΔF/F responses from cPFC axonal boutons with vehicle application or D1R activation in presence of D1R antagonist SCH23390.
Figure 4. GABABR Suppresses Presynaptic Calcium Influx with Canonical Increase in PPR.
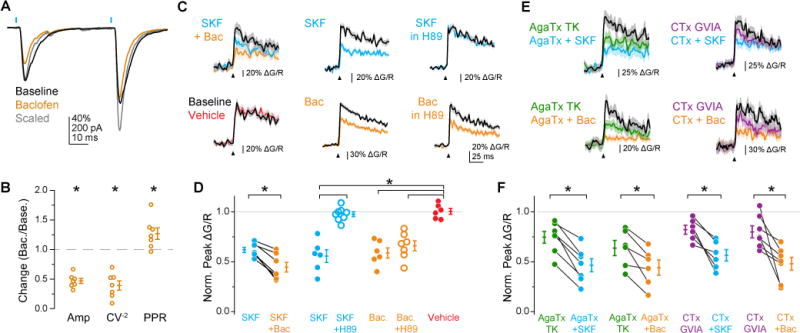
A) Example of GABABR modulation of cPFC oEPSCs and PPR (as in Fig. 2A).
B) Summary of GABABR modulation of oEPSC amplitude, CV−2 and PPR.
C) Examples of AP-evoked bouton calcium transients for D1R followed by GABABR activation, D1R activation alone, D1R activation with 10 μM H89, vehicle application, GABABR activation alone, or GABABR activation with H89. Data plotted as mean ΔG/R with shaded error bars indicating within-condition SEM.
D) Summary of change in peak ΔG/R for conditions in C.
E) Example responses, as in C, for effects of D1R or GABABR activation with concurrent CaV2.1 or CaV2.2 block.
F) Summary of change in peak ΔG/R for conditions in E.
Canonical and non-canonical presynaptic modulation at PFC glutamatergic inputs
Is dopamine unique in its ability to regulate release probability without altering short-term plasticity, or do other presynaptic neuromodulators have similar effects at these synapses? To address this question, we compared the effects of D1R to GABABR activation, which is known to suppress release though Gβγ-dependent modulation of presynaptic CaVs (Chalifoux and Carter, 2011; Otis and Trussell, 1996; Park and Dunlap, 1998; Takahashi et al., 1998). The GABABR agonist baclofen (350 nM) suppressed oEPSCs from cPFC inputs to a slightly larger extent than SKF (Fig. 4A, B; Norm oEPSC Amp: 0.46±0.05, n=7, p<0.001, rank-sum test with Holm-Sidak correction; compare to Fig. 1G, H); however, CV−2 and PPR decreased and increased, respectively, to an extent that mimicked the reduced extracellular calcium condition (Fig. 4B; Norm CV−2: 0.39±0.08, p<0.001; Norm PPR: 1.27±0.10, p=0.03, rank-sum test with Holm-Sidak correction; see also Fig. S3). These data indicate that GABABR-mediated suppression of presynaptic release leads to canonical increases in PPR, suggesting that neuromodulation by GABABR and D1R may occur through different signaling mechanisms.
Previous work has shown that D1Rs, as opposed to Gβγ-dependent GABABRs, regulate CaV2.1 and CaV2.2 calcium channels through a protein kinase A-dependent (PKA) pathway (Surmeier et al., 1995; Zhang et al., 2002). To test this, as well as to measure neuromodulatory effects in iPFC axons, we made whole-cell recordings from layer 5 pyramidal cells and imaged AP-evoked bouton calcium transients with Fluo-5F. Calcium transients were suppressed by SKF and baclofen to similar degrees (Figure 4C–D; Norm Peak ΔF/F=1.00±0.03, 0.56±0.06, 0.59±0.05; n=6 each for vehicle, SKF, and baclofen, respectively) and calcium transients were suppressed by both D1R and GABABR at individual boutons with serial application of both agonists (Norm Peak ΔF/F=0.62±0.03, 0.44±0.05 for SKF and SKF+baclofen, respectively; n=7, p<0.05, signed-rank test). D1-dependent modulation was blocked by the PKA inhibitor H89 (Figure 4C–D; Norm ΔF/F=0.98±0.02, n=8), whereas GABABR-dependent modulation was not (Norm ΔF/F=0.66±0.05, n=7; chi-square statistic=24.1, p<0.001, Kruskal-Wallis; SKF vs. SKF+H89 p<0.001, SKF vs. Vehicle p=0.002, Baclofen vs. Baclofen+H89 p=0.366, Baclofen vs. Vehicle p=0.002, Baclofen+H89 vs Vehicle p=0.001, rank-sum test with Holm-Sidak correction).
We next tested whether the distinct signaling pathways of D1R and GABABR result in regulation of different presynaptic CaV subtypes. Application of ω-conotoxin-MVIIC (1 μM) blocked oEPSCs by 98.3±0.6% (n=5, data not shown), indicating that release is mediated by CaV2.1 and CaV2.2 channels at this synapse. To determine whether D1R and GABABR selectively regulate one of these channel types, we applied CaV2.1 and CaV2.2-specific antagonists ω-agatoxin-TK (AgaTx, 150 nM) or ω-conotoxin-GVIA (CTx, 3 μM, Bender and Trussell, 2009), followed by either SKF or baclofen. Though both AgaTx and CTx suppressed calcium transients, neither occluded modulatory effects of D1R or GABABR. (Figure 4E–F; Norm ΔF/F=0.75±0.06, 0.47±0.06 for AgaTx and AgaTx+SKF, respectively, n=7, p<0.05; Norm ΔF/F=0.64±0.08, 0.44±0.08 for AgaTx and AgaTx+Bac, respectively, n=6, p<0.05; Norm ΔF/F=0.82±0.04, 0.57±0.06 for CTx and CTx+SKF, respectively, n=6, p<0.05; Norm ΔF/F=0.80±0.06, 0.48±0.07 for CTx and CTx+Bac, respectively, n=7, p<0.05, signed-rank test for all comparisons). Thus, these data indicate that D1Rs and GABABRs both suppress excitatory transmission through reduction of presynaptic AP-evoked calcium influx through CaV2.1 and CaV2.2 channels, although they act via different signaling cascades.
Given that D1R suppression can occur in conjunction with GABABR suppression within the same bouton, it is possible that they regulate different biophysical properties of presynaptic CaVs. We reasoned that differential CaV modulation could account for differences in how D1Rs and GABABRs regulate vesicle release. Interestingly, a similar dissociation between regulation of PR and short-term dynamics has been observed at hippocampal Schaffer collateral synapses. At this synapse, it has been proposed that vesicle release is mediated by a small number of CaVs (i.e. nanodomain release configuration, Scimemi and Diamond, 2012). In such a configuration, reductions in the amount of calcium fluxed by single CaVs during an AP (iCaV) can suppress calcium influx, reduce initial PR, and increase PPR through an accumulation of calcium bound to vesicular release machinery (Jackman and Regehr, 2017; Zucker and Regehr, 2002). By contrast, reductions in the probability a CaV opens in response to an AP (popen) could have multiple effects. If many CaVs contribute to vesicle release (i.e. microdomain release configuration), then a reduction in popen should simply reduce the total calcium current (ICaV) and have similar effects on PR and PPR as reductions in calcium current per channel (e.g. single-channel current, iCaV). However, if very few CaVs contribute to vesicle release, then the likelihood of local calcium influx failures on individual trials (ICaV = 0) becomes non-negligible, and on these trials a reduction in PR may be followed by a lack of facilitation due to the absence of calcium accumulation at calcium sensors that mediate release.
Due to differences in dissociation rate, the divalent channel antagonists manganese (Mn) and cadmium (Cd) can differentially suppress iCaV or popen, respectively. Mn, which can bind and dissociate from a CaV many times within the timecourse of an AP, functionally reduces iCaV, similar to lowering extracellular Ca. In contrast, Cd dissociation rates are an order of magnitude slower than an AP (0.02 ms−1, Thévenod and Jones, 1992). At subsaturating concentrations, individual CaVs will likely be completely blocked or not blocked by Cd during the timecourse of a single AP. As such, Cd reduces popen. At Schaffer collateral synapses, Mn and Cd both reduced EPSC amplitude, but PPR increased only with Mn (Scimemi and Diamond, 2012), suggesting that these synapses operate in the nanodomain configuration. To test whether long-range inputs into PFC also show different responses to reductions in iCaV or popen, we suppressed CaVs using Mn or Cd at cPFC inputs (Fig. 5). As with Schaffer collaterals, we observed a dose-dependent effect of Mn on both reducing oEPSC amplitude and increasing PPR (Fig. 5A, B; n=8; [Mn2+]=50, 100, 200 μM, Norm Amp.=0.87±0.03, 0.71±0.05, 0.47±0.05, Norm PPR=1.09±0.03, 1.13±0.06, 1.28±0.07). By contrast, we observed a dose dependent effect of Cd on decreasing oEPSC amplitude, but no corresponding increase in PPR (Fig. 5C, D; n=7; [Cd2+]=2, 5, 7.5, 10 μM, Norm Amp.=0.94±0.03, 0.69±0.04, 0.41±0.03, 0.30±0.03, Norm PPR=0.98±0.04, 0.94±0.06, 0.94±0.06, 0.88±0.07). The relationship between PPR and oEPSC amplitude was remarkably similar for Mn and GABABR activation, and for Cd and D1R activation (Fig. 5E). Further, both Mn and Cd reduced CV−2, consistent with D1R and GABABR activation (Fig. 5F; Mn Norm CV−2=0.70±0.16, 0.53±0.19, 0.41±0.14; Cd Norm CV−2=0.84±0.19, 0.58±0.09, 0.42±0.15, 0.33±0.12).
Figure 5. CaV Antagonists with Different Binding Kinetics Mimic D1R and GABABR.

A) Example cell with increasing manganese concentrations. Left: raw oEPSCs. Right: scaled to initial oEPSC amplitude.
B) Summary for manganese effects on oEPSC amplitude and PPR.
C–D) Same as A–B, but for cadmium.
E–F) Normalized PPR and CV−2 for manganese and cadmium conditions vs. normalized oEPSC amplitude. D1R and GABABR modulation shown in cyan and orange, respectively, for reference.
Differential modulation of CaVs by D1Rs and GABABRs account for differences in short-term plasticity
Based on these results, we hypothesized that D1Rs and GABABRs could have distinct effects on short-term facilitation if D1Rs mimics Cd and GABABRs mimics Mn. This could occur through several biophysical mechanisms. For example, GABABR-induced changes in channel gating, perhaps by depolarizing the voltage dependence of activation or increasing the reluctance of channel opening, could reduce the channel open duration during an AP (Huynh et al., 2015; Mintz and Bean, 1993; Patil et al., 1996). This would be functionally equivalent to Mn application, as it would produce a partial suppression of calcium influx per channel. By contrast, D1R-dependent modulation that reduces the likelihood that a CaV opens at all in response to an AP would mimic Cd, as it would produce all-or-none suppression of calcium influx per channel.
To test the hypothesis that D1Rs and GABABRs differentially regulate the way CaVs respond to AP stimuli, we applied optical fluctuation analysis (OFA) to PFC bouton calcium signals (Carter and Jahr, 2016; Svoboda and Sabatini, 2000). We made whole-cell recordings and visualized AP-evoked calcium signals in axonal boutons (Fig. 6A, B). Boutons were always imaged in serial pairs to ensure that trial-to-trial variability was uncorrelated and thus unlikely to be the result of AP conduction failures (Fig. S6A, B). Both the mean amplitude, Δ〈F〉, and variance, , were measured immediately following the AP to limit signal contamination from sources other than the bouton CaVs (Fig. 6C). The variance predicted by dark noise and shot noise alone was subtracted from the measured variance to obtain variance related to CaV activity (Fig. 6D).
Figure 6. D1R and GABABR Modulate Different Biophysical Properties of Presynaptic CaVs.

A) OFA recording configuration. Left: Schematic for local axonal bouton imaging. Center: Z-projection image of dendritic and axonal processes containing Alexa 594. Right: magnification of center panel highlighting two boutons in series along axon branch.
B) Bouton calcium response. Top: Mean membrane voltage (Vm) in response to short-duration somatic current injection (2–2.5 nA × 2 ms). Middle: Example mean fluorescence response of axonal bouton over 20 trials (note: 2-photon excitation begins with 50 ms delay to measure dark noise). Bottom: Mean ΔG/R response as a function of time for data in middle panel (dashed line indicates baseline fluorescence; timepoints before laser excitation excluded for clarity).
C) Top: mean response, green channel only. Numbers and black bars indicate time range for calculating 1) dark noise, 2) baseline and 3) peak mean and variance. Bottom: variance, Var(F), compared to variance predicted by dark and shot noise alone (black trace). Arrowhead: AP timing.
D) Variance-Mean plot before and after vehicle application. Variance and mean fluorescence were measured at baseline (empty squares, “Pre-AP”) and peak response (empty circles, “Peak AP”) time ranges (ranges 2 and 3 from Fig. 6C, respectively). All values corrected for dark noise. Shot noise measurements shown for reference (filled squares and linear fit). Error bars are 1 S.D. from estimates obtained from multiple timepoints per range.
E) Peak ΔG/R response of a single bouton over time. Grey points represent individual trials, open circles are average of 20 trials.
F, G) Peak ΔG/R responses of boutons before and after D1R or GABABR activation.
H) Mean ΔG/R with individual trials for baseline (top) and post-drug (bottom) conditions with D1R activation.
I) Variance-mean plot for one cell before (black) and after (cyan) D1R activation (same cell as in Fig. 6H).
J, K) Example cell with GABABR activation, as in H, I.
L) Normalized CaV-associated Variance versus Normalized Peak Amplitude. (Vehicle, peak ΔG/R=1.01±0.03, CV−2=1.02±0.10, n=6)
Analysis of the resulting calcium transients is mathematically similar to EPSC nonstationary fluctuation analysis, but applied to imaging data instead of electrophysiological data (Quastel, 1997; Sigworth, 1980; Svoboda and Sabatini, 2000). Calcium influx in a bouton can be modeled as a binomial process arising from N CaVs, each with single-channel current i and open probability p, and quantitative predictions can be made for how trial-to-trial variability is affected given changes to N, i, or p. Within this framework, the mean-normalized variance should not change when reducing the single-channel current i, but it should increase with reductions in N and p. Importantly, the variance should increase more for reductions in p than for similar reductions in N, especially in boutons where CaV open probability per AP is high (Fig. S6C; Yasuda et al., 2003). Lastly, because we used propagating APs as our stimulus, i and p reflect the single-channel calcium charge transfer and overall channel open probability per AP, respectively.
In time-locked control conditions, AP-evoked bouton calcium transients were stable for >100 trials (Fig. 6E). All subsequent pharmacological experiments were therefore limited to a maximum of 100 trials. Baseline and post-drug measurements of 40–50 trials were separated by ~10 minutes to allow for drug equilibration. Both D1R and GABABR activation suppressed presynaptic calcium influx (Fig. 6F, G), but decreases in were observed primarily with D1R, not GABABR, activation (Fig. 6H–K; for D1R and GABABR, respectively: n=6, 6; Norm. , 0.94±0.05; Norm. Peak ΔG/R=0.56±0.06, 0.59±0.05; chi-square statistic=23.88, p<0.001, Kruskal-Wallis; SKF vs. Baclofen p<0.001, rank-sum test with Holm-Sidak correction). Like GABABRs, reducing extracellular calcium suppressed calcium signals with little change in (Fig. 6L; n=6; ; Norm. 〈ΔF〉=0.39±0.05; ΔCa2+ vs. Baclofen p=0.92, rank-sum test with Holm-Sidak correction). Thus, these data indicate that GABABRs limit calcium influx from individual CaVs per AP, whereas D1Rs decrease the average number of CaVs that open in response to an AP, which could be due to a change in N or p.
To determine whether D1Rs reduce CaV number or open probability, we compared D1R effects to application of a subsaturating dose of ω-conotoxin MVIIC (35 nM). Because the dissociation rate of ω-conotoxin MVIIC is substantially slower than the timecourse of these experiments (McDonough et al., 1996), it should act as an irreversible CaV antagonist and effectively reduce N. Indeed, decreased linearly with calcium response amplitude after conotoxin application (Fig. 6L; n=7; Norm. ; Norm. 〈ΔF〉=0.60±0.05). This contrasts with D1R results where reduced more quickly than 〈ΔF〉 (conotoxin vs. SKF p<0.001, rank-sum test with Holm-Sidak correction), suggesting that D1Rs do not reduce the number of channels at the bouton.
Because D1Rs suppressed more strongly than predicted by reductions in N, we next asked whether D1R suppression was consistent with a reduction in p. In cases where p is modulated, the steepness of the change in depends strongly on the baseline open probability; thus, one can fit observed changes in and 〈ΔF〉 to a nonlinear function parameterized by different estimates of baseline CaV open probability (Fig. S6C). The observed changes in and 〈ΔF〉 after D1R activation agreed well with a baseline open probability of 0.83 (95% confidence interval=0.73–0.93), consistent with more direct measures of p at other terminals (Borst and Sakmann, 1998; Li et al., 2007). Taken together, these data indicate that D1Rs and GABABRs suppress presynaptic CaV popen and iCaV, respectively (Fig. 6L).
To determine whether the different biophysical mechanisms of CaV modulation predicted by OFA are sufficient to explain the differing effects of D1Rs and GABABRs on short-term plasticity, we developed a reduced synaptic model (Fig. 7A; Table S1). We simulated 50 synapses onto a single postsynaptic neuron, where each presynaptic terminal contained a constant number of CaVs. Channel activity was simulated as a simple binomial process to adapt OFA data directly into the model, and vesicle release probability was calculated as a Hill function of the calcium concentration per bouton (Stanley, 2016; Zucker and Regehr, 2002). Note that the resulting total number of vesicles was convolved with an AMPA-like sum of exponential waveforms for visualization, but analysis of EPSC amplitude and PPR was based solely on mean quantal content (see Methods).
Figure 7. Model of Synapse Reproduces Non-Canonical Presynaptic Modulation.

A) Reduced Model of Presynaptic Release. Rows are possible trial outcomes for different CaV popen values for a single bouton given release mediated by one presynaptic CaV. Columns, from left to right: presynaptic calcium concentration (purple/green tick marks indicate first and second AP), fraction of trials where this occurred, PR as a function of calcium concentration (calcium concentrations for two APs indicated by purple/green lines), total average EPSC across synapses and trials.
B, C) As in A, but with CaV single-channel current iCaV or open probability popen reduced to 60% of baseline to mimic OFA results for GABABR and D1R, respectively.
D) Suppression of EPSC by graded reduction in iCaV with release mediated by one presynaptic CaV. Left: Colors indicate fraction reduction in iCaV. Right: scaled to first EPSC amplitude.
E) Suppression of EPSC by graded reduction in popen, as in D.
F) Suppression of EPSC by graded reduction in popen, with release mediated by 20 CaVs.
G) Normalized PPR vs. normalized EPSC amplitude for reductions in iCaV, qvesicle or popen under different numbers of presynaptic CaVs mediating release.
H) Normalized PPR with reduction in popen to 60% of baseline, as a function of number of presynaptic CaVs mediating release. Grey line indicates no change in PPR. Inset: Expanded view of first few channel numbers.
I) Normalized CV−2 plotted against normalized EPSC amplitude for reductions in iCaV, qvesicle or popen under different numbers of presynaptic CaVs mediating release.
We began by assuming that vesicle release was driven by only one CaV per synapse with an open probability of 0.83 per AP (derived from OFA analysis, Fig. 6L; Bucurenciu et al., 2008; Scimemi and Diamond, 2012; Stanley, 2016). Given this open probability, four different calcium transients were observed with differing probabilities in response to paired-pulse stimulation (Fig. 7A, four rows). In most cases, both APs resulted in a CaV opening (69% of trials), but in some cases the CaV opened in response to only the first or second AP (14% each), or to neither (3%). This is a direct result of the CaV openings being independent across channels and trials. These probabilities, when translated into release via the Hill function (S=0.25, cooperativity=3.72, Scimemi and Diamond, 2012) and aggregated across all 50 simulated synapses, resulted in modest paired-pulse facilitation of quantal content (model PPR=1.14, compared to measured oEPSC PPR of 1.31±0.09, 1.31±0.08, 1.10±0.08 for iPFC, cPFC and vHPC, respectively).
Given these baseline conditions, we next altered either the CaV single-channel current (i) or open probability (p) per AP to an extent that matched the D1R and GABABR OFA data (0.6 of baseline for either model parameter, Fig. 7B, C; compared to peak ΔG/R amplitude reduction to 0.56±0.06 and 0.59±0.05 of baseline for D1R and GABABR, Fig. 6L). Modulation of i strongly reduced PR due to the Hill function nonlinearity described above. As such, differences in residual calcium levels after the first AP nonlinearly enhanced PR on the second AP, and PPR was increased. By contrast, when only one CaV contributed to release per synapse, modulation of p did not change calcium transient amplitude ratios or residual calcium; instead, modulation of p decreased the likelihood of two APs both eliciting successful calcium influx and increased the likelihood that calcium influx would occur on only the first AP, only the second AP, or not at all. Thus, when aggregated across all synapses and trials, the net EPSC amplitude was reduced without increasing PPR. In fact, more dramatic reductions in p led to a small decrease in PPR. This is because our simulations were tuned to evoke modest PPF at baseline, matching empirical observations (Fig. 2), and as p decreased, the likelihood of successful calcium influx for both APs (and thus, facilitation) approached zero. As a result, the net EPSC will be weighted more heavily towards calcium influx failures and PPR will trend towards 1, which would appear as a decrease when normalized to facilitation at baseline (Fig. 5C–E). This result did not depend on the exact values chosen for the calcium concentration decay time constant or interval between APs and was also observed when synapses had a distribution of channel numbers and calcium decay time constants (Fig. S7A–C).
Synaptic facilitation can occur through multiple mechanisms, including slow clearance of calcium from the presynaptic terminal (i.e. the residual calcium hypothesis, Jackman and Regehr, 2017), saturation of endogenous calcium buffers (i.e., the buffer hypothesis, Blatow et al., 2003; Rozov et al., 2001), or interactions with a high affinity calcium sensor that has calcium dissociation kinetics that are slower than the paired-pulse interval (e.g., synaptotagmin7, bound calcium hypothesis, Jackman et al., 2016). While the simulations described above use residual calcium as a mechanism for facilitation in a highly-reduced manner, similar results were obtained with a model that incorporates three additional, more realistic features (Fig. S7D–I). First, rather than simulating the bouton as a point, the linearized buffer approximation (“LBA”, Naraghi and Neher, 1997; Neher, 1998) was used to approximate calcium concentration as a function of distance from the CaV. Then, calcium-dependent short-term facilitation was generated by scaling release probability by a second, higher-affinity Hill function with calcium affinity and cooperativity derived from synaptotagmin7 (see Methods and Table S1). Last, a simple model of vesicle depletion and replenishment was added, which is critical to generate calcium-dependent short-term facilitation in this form of model (Scimemi and Diamond, 2012). Paralleling results from our simpler model, the same basic pattern of canonical and noncanonical modulation with changes in i and p was observed when only a few CaVs were responsible for release, especially for CaV-vesicle distances that reflect tight diffusional coupling (<25 nm, Bucurenciu et al., 2010; Nakamura et al., 2018; Scimemi and Diamond, 2012; Fig. S7D–H). This is likely because noncanonical short-term plasticity due to suppression of p occurs upstream of release machinery and calcium diffusion dynamics, and because the “paired-pulse facilitation” of intracellular calcium also trends towards 1 in these conditions. To further illustrate this point, we built a linear phenomenological model of short-term facilitation (Fig. S7J–L; Betz, 1970; Varela et al., 1997; Markram et al., 1998). This model makes no assumptions about the cellular mechanisms that support facilitation; its only requirement is that facilitation is calcium-dependent. Even here, we observed the same differences in PPR modulation by changes in i and p. Thus, these models can account for different mechanisms by which facilitation could occur, including buffer saturation or a high affinity calcium sensor with slow kinetics, provided that facilitation depends on residual calcium in some way.
This PPR dependence on i but not p was consistent across a range of parameter reductions (Fig. 7D–E). As expected, reductions in quantal size qvesicle did not alter PPR, and the insensitivity of PPR to reductions in p was diminished as the number of CaVs driving release per synapse increased (Fig. 7F–H). PPR invariance was observed only when few channels (1–3), either uniformly or randomly distributed across boutons, contributed to release (Fig. 7D, F–H, Fig. S7C,F,I,L). Importantly, this model also reproduced our finding that CV analysis indicated a presynaptic site of action for all tested presynaptic configurations but not the postsynaptic modulation of qvesicle (Fig. 7I). Taken together with OFA results, these data indicate that the different effects of D1Rs and GABABRs on short-term facilitation can, in principle, be explained by differential modulation of presynaptic CaVs.
Non-canonical presynaptic modulation strongly suppresses ongoing activity
Given these differences in short-term plasticity, we next sought to determine how ongoing activity was shaped by these two neuromodulators. We stimulated cPFC inputs expressing ChR2 with trains of 10 light pulses at either a regular frequency of 20, 10, or 5 Hz, or at a combination of these three frequencies (Fig. 8A–F). We found that stimulation of D1Rs consistently suppressed the entire sequence of all ten oEPSCs (Fig. 8A), and often suppressed oEPSCs that occurred at the end of the train to the greatest extent (Fig. 8B,E). But due to increased PPR, GABABR suppression of oEPSCs was clearer at the beginning of trains, with little difference in oEPSC amplitude towards the end (Fig. 8C–E). This pattern was observed across multiple frequencies as well as with stimulation of variable intervals (Fig. S8A). We quantified the “charge ratio”, ΔRQ, which measures the suppression of trains of oEPSCs normalized to the suppression of the first oEPSC. When ΔRQ < 1 or ΔRQ > 1, the entire sequence of stimuli was suppressed more or less than the initial stimulus, respectively. Indeed, D1Rs and GABABRs showed significantly different values of ΔRQ across multiple frequencies (Fig. 8F, ΔRQ : SKF, n=7, 20 Hz=0.73±0.08, 10 Hz=0.71±0.05, 5 Hz=0.70±0.08, Mixed Int.=0.71±0.05; ΔRQ : Baclofen, n=7, 20 Hz=1.38±0.06, 10 Hz=1.33±0.12, 5 Hz=1.14±0.08, Mixed Int.=1.34±0.08; chi-square statistic=40.48, p<0.001, Kruskal-Wallis; SKF vs Baclofen, 20 Hz p<0.001, 10 Hz p<0.001, 5 Hz p=0.002, Mixed Intervals p<0.001, rank-sum test with Holm-Sidak correction). These data suggest that GABABRs act as a high-pass filter on synaptic transmission whereas D1Rs act to suppress synaptic transmission independent of event timing.
Figure 8. D1R and GABABR Differentially Filter Ongoing Synaptic Activity.

A) Train of ten oEPSCs at 20 Hz before and after D1R stimulation.
B) Expanded view of first and tenth oEPSC.
C–D) As in A–B but with GABABR stimulation.
E) Modulation of ongoing activity at 20 Hz. Left: oEPSC amplitudes before and after D1R stimulation. Right: As on left, but with GABABR activation.
F) Suppression of ongoing activity relative to first amplitude. The charge ratio was consistently larger for GABABR activation than for D1R activation across multiple frequencies. “Mixed Intervals” was a predetermined combination of 3 inter-stimulus intervals at 5, 10 and 20 Hz, shuffled.
G) Recording configuration for current-clamp experiments. Top: Train of LED pulses to activate ChR2-positive long-range inputs from cPFC (color-coded by preceding interval being equal to or faster than 1 Hz for pink and green tic marks, respectively). Middle: Simulated PSC waveform injected into the soma through the recording electrode. Bottom: Recorded membrane voltage.
H) Modulation of spike timing. Top: Example raster plot (same cell as in G) of spike times over trials with different injected PSC waveforms before (above, “Baseline”) and after (below, “SKF”) D1R activation. Bottom: As above, but with GABABR activation. Black tic marks indicate spike times, pink and green bars indicate timing of 1Hz and >1Hz LED pulses, respectively.
I) Modulation of LED-evoked spiking. Top: Instantaneous frequency of spiking aligned to 1Hz LED stimuli, averaged across cells, before and after D1R and GABABR activation for left and right plots, respectively (n=6 and 8 for D1R and GABABR). Bottom: As above, but aligned to 20Hz LED stimuli.
J) Summary data of neuromodulation of LED-evoked spiking. Bars are mean ± SEM. Circles are single cells.
We next sought to test whether these differences in short-term plasticity translate to differences in AP generation in more realistic, in-vivo-like conditions. We performed current-clamp experiments where we injected a noisy current waveform stimulus that was comprised of randomly-generated simulated EPSCs and IPSCs in order to depolarize the postsynaptic cell and generate APs. We also stimulated the cell with a train of LED pulses with shuffled intervals, ranging from 1 Hz to 20 Hz in frequency, to activate long-range ChR2-expressing cPFC inputs (Figure 8G). Stimulation of these inputs by the LED generated short-latency APs (Figure 8H–I). Importantly, due in part to the injected noisy current waveform, LED stimulation did not generate APs on every trial. This allowed us to apply D1R or GABABR agonists and test whether these neuromodulators suppress ChR2-mediated spiking in different ways depending on ChR2 stimulation frequency. At the slowest frequency of 1Hz, LED-evoked spiking was suppressed significantly by both D1R and GABABR agonists (norm. spike frequency within 12 ms of LED=0.43±0.07, 0.38±0.05 for SKF and baclofen, respectively). However, as the input LED frequency increased, GABABR-mediated suppression weakened significantly, whereas D1R-mediated suppression remained similar across all frequencies (Figs. 8I–J, S8B; norm. frequency after SKF=0.43±0.07, 0.55±0.07, 0.49±0.09, 0.50±0.20, for 1, 5, 10 and 20Hz, respectively, n=6, chi-square statistic=1.25, p=0.74, Kruskal-Wallis; norm. frequency after baclofen=0.38±0.05, 0.82±0.06, 0.74±0.06, 0.82±0.04, for 1, 5, 10 and 20Hz, respectively, n=8, chi-square statistic=16.08, p<0.05, Kruskal-Wallis; p<0.05 for baclofen 1 Hz vs all other frequencies, rank-sum test with Holm-Sidak correction). Thus, these data indicate that GABA and dopamine have differential effects on synaptic integration, with GABA facilitating the transmission of inputs that occur in high-frequency bursts and dopamine suppressing transmission in a frequency-independent manner.
Discussion
We demonstrate here that activation of the D1 dopamine receptor suppresses a subset of excitatory long-range and local inputs in prefrontal cortex. By reducing presynaptic CaV open probability, D1R can suppress vesicle release probability without a parallel increase in short-term facilitation. This non-canonical presynaptic neuromodulation suppresses AP generation across multiple stimulation frequencies and is well-explained by a simple synapse model where vesicle release is mediated by a small number of CaVs.
These results provide mechanistic insight into how modulation of specific biophysical properties of presynaptic CaVs can result in surprisingly large differences in synaptic transmission and short-term plasticity. These data address a longstanding puzzle related to prefrontal dopaminergic modulation by explaining how a neuromodulator can have little effect on paired-pulse facilitation despite a presynaptic site of action (Gao et al., 2001; Seamans et al., 2001; Gao and Goldman-Rakic, 2002; Seamans and Yang, 2004). In addition to prefrontal cortical synapses, the mechanisms identified here may account for similar observations made in a diverse set of synapses and neuromodulatory systems (Behr et al., 2000; Delaney et al., 2007; Holmes et al., 2017; Li et al., 2012; Tejeda et al., 2017). In future work, it will be critical to understand the role that distinct canonical and non-canonical presynaptic modulatory pathways play in information transfer in neuronal networks.
CaV-Vesicle Coupling and Presynaptic Neuromodulation
The facilitation-independent form of presynaptic modulation described here requires that release is mediated by nanodomain coupling between only a few CaVs per vesicle (Fig. 7; Scimemi and Diamond, 2012). This configuration is similar to other synapses, including the mature calyx of Held (Fedchyshyn and Wang, 2005), auditory ribbon synapses (Goutman and Glowatzki, 2007), hippocampal basket cell boutons, (Bucurenciu et al., 2010) and Schaffer collaterals (Scimemi and Diamond, 2012). In the nanodomain configuration, the overall calcium concentration that triggers release is strongly influenced by the stochastic opening of individual CaVs and as such, slow CaV antagonists like cadmium suppress release without increasing PPR (Fig. 5; Hefft et al., 2002; Hjelmstad, 2004; Scimemi and Diamond, 2012). By contrast, when release is mediated by calcium microdomains, the overall calcium concentration is less influenced by single-channel stochasticity. At microdomain synapses, including the immature calyx of Held (Fedchyshyn and Wang, 2005), cadmium suppresses release while also increasing PPR (Otis and Trussell, 1996). We explored this difference between nanodomains and microdomains in our reduced model by examining how changing the number of functional CaVs per synapse affects the response of the model synapse to modulation of iCaV or popen (Fig. 7). Indeed, we observed that reductions in CaV popen preserved paired-pulse facilitation in the nanodomain-like configuration, but increased facilitation in the microdomain-like configuration. These differences have been proposed previously (Eggermann et al., 2012) and may account for why D1Rs suppress release with and without changes in PPR at different synapses (e.g., Wang et al., 2012).
Presynaptic gain modulation has been observed with several synapses and neuromodulators. At hippocampal Schaffer collaterals, where release is driven by few CaVs, reducing CaV popen with cadmium does not increase PPR (Scimemi and Diamond, 2012). At the perforant pathway synapse in subiculum, D1R also suppresses presynaptic gain (Behr et al., 2000). In the nucleus accumbens, excitatory inputs from amygdala, but not ventral hippocampus, display PPR-independent suppression (Tejeda et al., 2017). At this synapse, both kappa-opioid receptors (KORs) and GABABR suppress PR; however, KORs do not change PPR whereas GABABRs increase PPR. Presynaptic gain modulation at other synapses, including KOR suppression in the bed nucleus of the stria terminalis and noradrenergic suppression in central amygdala, has been attributed to a reduction in the number of presynaptic release sites (Delaney et al., 2007; Li et al., 2012; but see Saviane and Silver, 2006). Taken together, the prevalence of neuromodulators that suppress release without increasing PPR throughout the brain suggests that presynaptic gain modulation may be a more common phenomenon than previously appreciated.
Possible mechanisms of CaV modulation
Both D1Rs and GABABRs are known to modulate high voltage activated (HVA) CaVs (Surmeier et al., 1995; Zhang et al., 2002; Kisilevsky et al., 2008; Chalifoux and Carter, 2011). Our imaging and pharmacological experiments suggest that GABABRs and D1Rs modulate AP-evoked calcium influx in a graded or all-or-none manner, respectively, at individual presynaptic CaVs. Multiple biophysical mechanisms could underlie these observations. GABABRs could modify AP waveform by recruiting inward rectifying potassium channels or modulating other potassium channels, though the former has not been observed in PFC pyramidal cell axons (Xia et al., 2014). Alternatively, partial reductions in the current fluxed by single CaVs per AP could result from a GABABR-induced reduction in channel conductance, delayed time to first opening, or depolarized shift in voltage-dependent activation. The latter two possibilities seem most likely, as GABABRs have been shown to interact directly with CaVs via Gβγ subunits to either induce a rightward shift in activation or delay the time of first opening via the induction of a “reluctant state” (Huynh et al., 2015; Mintz and Bean, 1993; Patil et al., 1996), whereas GABABR-mediated changes in channel conductance have not been reported. The PKA-independence of CaV modulation by GABABRs observed in the current study suggests that a similar Gβγ mechanism may be present at prefrontal synapses.
D1R modulation was PKA dependent, similar to previous reports in basal ganglia (Surmeier et al., 1995; Zhang et al., 2002), and produced all-or-none reductions in AP-evoked CaV opening. This could be instantiated biophysically through alterations in gating modes, perhaps through modulation of beta subunits that increase channel opening latency to an extent that exceeds the duration of the AP (Luvisetto et al., 2004). Alternatively, hyperpolarized shifts in steady-state inactivation could reduce the number of channels available for activation by an AP. Such modulatory effects have been observed with D3 dopamine receptor-dependent regulation of CaV3.2 channels at the axon initial segment (Bender et al., 2010; Yang et al., 2016; Clarkson et al., 2017). CaV2 channels could be modified by similar mechanisms, especially during AP trains (Patil et al., 1998). Overall, these data suggest that further investigation into the signaling pathways and biophysics of CaV channel modulation by dopamine and other metabotropic receptors will yield greater insight into the diversity of synaptic neuromodulation in the axon.
Functional implications
Regulating synaptic gain is an important mechanism for shaping information transfer throughout the brain. Traditionally, gain modulation has been thought to occur at the postsynaptic site, either through changes in neurotransmitter receptor number, modulation of cable properties, or recruitment of inhibition (Silver, 2010). Because these mechanisms target the postsynaptic membrane, they often modulate overall neuronal excitability and are not input-specific. By contrast, neuromodulation of release probability is intrinsically input-specific. Canonically, neuromodulation of release probability has nonlinear and frequency-dependent effects on synaptic transmission (e.g. parallel changes in facilitation and/or depression, see GABABR in Fig. 8). Thus, the ability of D1R to non-canonically suppress PR at the presynaptic axon without increasing paired-pulse facilitation represents a novel mechanism for input-specific synaptic gain modulation.
Why do D1Rs suppress synaptic gain, rather than impose a canonical high-pass filter? Cortical neuronal activity is often characterized by sparse and irregular firing patterns (Barth and Poulet, 2012; Boudewijns et al., 2013), with high-frequency bursts encoding behaviorally-relevant events (Burgos-Robles et al., 2007; Holmes et al., 2012; Laviolette et al., 2005). Canonical presynaptic neuromodulators like GABABRs that suppress only low-frequency input are thought to be capable of enhancing the signal-to-noise ratio of these bursts. Conversely, D1R modulation may serve to suppress specific inputs into PFC, independent of input frequency. One major function of dopamine during working memory is to improve the saliency of task-related signals, largely by suppressing activity unrelated to the task at hand in a PKA-dependent manner (Arnsten et al., 1994; Brozoski et al., 1979; Vijayraghavan et al., 2007). Dopamine, by suppressing glutamatergic activity without altering short-term dynamics, may contribute to this noise suppression. Moreover, we now know that interactions between MDT and PFC are critical for working memory and attentional control (Bolkan et al., 2017; Schmitt et al., 2017). One interesting possibility, highlighted by the input-specific modulation shown here, is that D1Rs functionally enhance the signal-to-noise ratio on MDT inputs by suppressing many other inputs. Thus, the gain modulation employed by dopamine may confer advantages to information processing in PFC, especially during working memory.
STAR Methods
CONTACT FOR REAGENT AND RESOURCE SHARING
Further information and requests for resources and reagents should be directed to and will be fulfilled by the Lead Contact, Dr. Kevin Bender (kevin.bender@ucsf.edu).
EXPERIMENTAL MODEL AND SUBJECT DETAILS
All procedures were performed in accordance with UCSF IACUC guidelines. C57B6 wild type mice or Ai14 reporter mice (Jackson Laboratory, stock no. 007914) aged postnatal day (P) 50–80 were used for all experiments, with the exception of optical fluctuation experiments (Fig. 7) where animals from the age range P35–45 were used. No significant differences based on sex were observed, and data were pooled between sexes.
METHOD DETAILS
Viral Injections
Subjects were injected with virus at P26–35. Prior to viral injection, mice were anesthetized by isofluorane and head-fixed in a stereotaxic frame. For channelrhodopsin stimulation experiments, subjects were then unilaterally injected with 300–500 nL of AAV5-CamKIIα-hChR2(H134R)-eYFP (“CaMKII-ChR2”) virus into prefrontal cortex (cPFC, from bregma: A/P +1.70, M/L +0.35, D/V −2.60 mm), mediodorsal thalamus (MD-Thal, from bregma: A/P −1.70, M/L −0.30, D/V −3.45), ventral hippocampus (vHPC, from bregma: A/P −3.30, M/L −3.20, D/V −4.00), orbitofrontal cortex (cOFC, from bregma: A/P +2.2, M/L +1.0, D/V −2.75) and amygdala (Amyg, from bregma: A/P −1.6, M/L −2.75, D/V −5.00). For sparse transfection of local recurrent PFC connections (iPFC), the same coordinates as cPFC were used but instead a virus cocktail was injected including AAV5-EF1α-Cre-IRES-mCherry and AAV5-EF1α-DIO-hChR2(H134R)-eYFP (“Cre-mCherry” and “DIO-ChR2”, ratios between 1:10 – 1:20). For gCaMP experiments, the same injection coordinates and volumes were used in Ai14 heterozygous animals with a viral cocktail that contained a 1:1 ratio of AAV5-hSyn-Flex-gCaMP6f-WPRE-SV40 and Cre-mCherry. Experiments were then performed approximately 4–8 weeks after injection (4–5 weeks cPFC/iPFC/cOFC, 5–6 MD-Thal/Amyg, 6–8 vHPC) to allow sufficient expression and trafficking. Acute slices were prepared from the majority of subjects. Additional subjects were perfused transcardially with 4% paraformaldehyde in phosphate buffered saline (PBS) and coronal sections were prepared (40 μm thickness). Tissue was rinsed with PBS 3 times over the course of 10 min, and then blocked in a solution of PBS with 10% normal goat serum (NGS, Jackson ImmunoResearch) and 0.2% Triton-X in PBS (PBS-T) for one hour. Tissue was then incubated in a solution of 2% NGS and 0.1% PBS-T containing an antibody conjugated to a 488 fluorophore (Invitrogen) to amplify the signal from stereotaxic injections of YFP-expressing viruses. This solution was incubated overnight at 4°C, rinsed with PBS 5 t imes over the course of 20 minutes, and mounted on slides with ProLong Gold Antifade with DAPI (Life Technologies). Images were obtained using a high speed wide-field microscope (Nikon Ti, with Andor Zyla 5.5 sCMOS) with a 10x/0.45 or 20x/0.75 Plan Apo objectives. Data were post-processed to stitch images and for brightness and contrast in FIJI.
Slice Preparation and Whole-Cell Recordings
Acute coronal slices of prefrontal cortex (225–300 μm) as well as the injection site if a virus was used (for post-hoc confirmation) were cut in high-sucrose solution, bubbled with 5% CO2/95% O2 and maintained at 4°C. Cutting solution contained (in mM): 87 mM NaCl, 25 mM NaHCO3, 25 mM glucose, 75 mM sucrose, 2.5 mM KCl, 1.25 mM NaH2PO4, 0.5 mM CaCl2 and 7 mM MgCl2. Following cutting, slices were incubated in artificial cerebrospinal fluid (aCSF, see below) for 30 min at 33°C, then at room temperature until recording. Pyramidal cells were visualized with Dodt contrast and two-photon microscopy. Single neurons were identified for electrical recording based on laminar position and teardrop somatic morphology. External aCSF recording solution contained (in mM): 125 NaCl, 2.5 KCl, 1 MgCl2, 25 NaHCO3, 1.25 NaH2PO4, 25 glucose; bubbled with 5% CO2/95% O2; 30–33°C. The day of the experiment, 1.3 mM CaCl2 and 1 μM sulpiride (D2/3/4 antagonist, Tocris) were added to the aCSF from stock solutions. Recordings were performed in voltage-clamp with glass patch electrodes (2–4 MΩ tip resistance) and internal solution containing (in mM): 113 K-Gluconate, 9 HEPES, 4.5 MgCl2, 0.1 EGTA, 14 Tris2-phosphocreatine, 4 Na2-ATP, 0.3 tris-GTP; ~290 mOsm, pH: 7.2–7.25. Cells were compensated for whole-cell capacitance and series resistance (50%) and voltage-clamped at −80 mV (corrected for 12 mV junction potential) unless otherwise stated. For cesium-based imaging experiments (Figure 2D–F, OQA), internal solution contained (in mM): 110 CsMeSO3, 40 HEPES, 1 KCl, 4 NaCl, 4 Mg-ATP, 10 Na-phosphocreatine, 0.4 Na2-GTP, 0.25 Fluo-5F, 0.02 Alexa-594; ~290 mOsm, pH: 7.2–7.25, data corrected for 11 mV junction. Electrophysiological data were acquired at 20 kHz and filtered at 3 kHz using a Multiclamp 700A or 700B amplifier (Molecular Devices) and a custom data acquisition program in Igor Pro (Wavemetrics).
Synaptic Stimulation Experiments and Pharmacology
For channelrhodopsin stimulation experiments (Figs. 1, 2, 4, 5, 8, S1, S2), pairs of blue light stimulation (472 nm LED through 40x objective, 2 × 1ms at 20 Hz, or more complex patterns in Fig. 8) or stimulation via theta stimulating electrode (2 × 200 μs at 20 Hz, Fig. 1C, E) occurred at regular 15s intervals to avoid induction of plasticity. Theta simulating electrodes were placed ~100–150 μm lateral to the recording electrode, within layer 5. Light power or electrode amperage were adjusted for each cell to minimize polysynaptic responses, but generally ranged from 0.5 to 2 mW/mm2 and 0.01–0.2 mA, respectively. Pyramidal cell subtype was identified based on intrinsic excitability during the first two minutes of recording, as described previously (Fig. S2, Clarkson et al. 2017). The following criteria were used to exclude cells from data analysis: 1) total temperature range of >1.0°C within one experiment, 2) series resistance (Rs) of > 20 M or change in Rs of > 20%, 3) holding current (Ihold) < −100 pA, or change in Ihold > ±50pA, 4) change in input resistance (Rin) > 25%, 5) violation of any of these criteria sooner than 5 minutes after the last measurement timepoint.
Baseline data began 10 minutes post-break in (about 7–8 minutes after start of light stimulation) and lasted for at least 10 minutes. If a stable baseline EPSC trace was observed, SKF-83822 (D1/D5 agonist, Tocris) was dissolved to 10 mM in ethanol vehicle then immediately (<1 minute) diluted in aCSF (20 μM) and applied to the slice for 10 minutes, followed by washout into baseline aCSF. Similar approaches were applied for other pharmacological manipulations, including (R)-Baclofen, NBQX, manganese and cadmium, as well as changing extracellular calcium concentration, (distilled H2O was used as vehicle for all drugs besides SKF, see Results for concentrations). For PKA blockade experiments (Fig. 4), the PKA antagonist H89 was present in all recording solutions (10 μM) as well as the incubation chamber for at least 30 minutes prior to recording. The D1R antagonist SCH was similarly present in all recording solutions for D1R blockade experiments (Figs. 1, 3). For agatoxin TK, ω-conotoxin GVIA and ω-conotoxin MVIIC (Figs. 4, 6), aCSF was recirculated with the addition of 0.1 mg/ml bovine serum albumin. All drugs were obtained from Tocris Bioscience, with the exception of calcium channel peptide antagonists (agatoxin and ω-conotoxin GVIA and MVIIC) and bovine serum albumin, which were obtained from Peptides International and Sigma-Aldrich, respectively.
Imaging Experiments
For gCaMP experiments, external aCSF also included 50 μM picrotoxin, 10 μM NBQX or DNQX and 10 μM (R)-CPP to block GABA-A, AMPA, and NMDA receptors, respectively. AP-evoked bouton gCaMP transients were evoked by a theta-barrel electrode positioned >100 μm from imaged boutons. Boutons were identified via two-photon microscopy (910 nm) based on the string-of-pearls morphology in the red channel (tdTomato/mCherry expression) and sensitivity of green channel fluorescence to extracellular stimulation (gCaMP expression). A train of three extracellular stimulations (200 μs at 20 ms interval) was delivered to evoke bouton-restricted, tetrodotoxin-sensitive gCaMP signals. Approximately 20–30 trials were obtained, followed by application of drug (as with ChR2 stimulation experiments) and another 20–30 trials. Data are displayed as ΔF/F, or as peak ΔF/F normalized to the baseline mean peak ΔF/F.
For imaging of local PFC boutons, K-Gluconate internal solution was used as in ChR2 stimulation experiments, except EGTA was replaced with 250 μM Fluo-5F and 20 μM Alexa 594. Axons were traced to find an offshoot that contained the string-of-pearls morphology, and calcium influx was elicited via precisely-timed single action potentials generated by short current injections at the soma (2–2.5 nA × 2ms). The same inclusion criteria applied to ChR2 stimulation experiments were applied here, except the holding-current criterion was modified for current-clamp (exclude if membrane voltage (Vm) > −63 mV or changed by > ±5 mV). Data were always obtained simultaneously from two neighboring boutons to determine whether variability correlated across boutons (see “Optical Fluctuation Analysis”).
For imaging of postsynaptic spines during uncaging experiments (Fig. S4) slices were perfused with 3 mM MNI-caged-L-glutamate, and 20 μM Alexa 488 was added to the internal solution. Neurons were imaged at 810 nm and MNI-glutamate was uncaged at 720 nm (1 ms pulses, 5–8 mW at focal point). Spines on the basal dendrites within 15 μm of the slice surface were chosen for uncaging. EPSC amplitudes were calculated from the average of 5–10 trials before and 10 minutes after SKF or vehicle application. Paired pulses with modest facilitation were obtained by increasing the laser intensity by 40% on the second pulse.
For imaging of postsynaptic spines during Optical Quantal Analysis experiments (Fig. 2D–F), cells were filled with Cs internal solution containing 250 μM Fluo-5F and 20 μM Alexa 594. Experiments were done in the presence of 10 μM NBQX and 10 μM D-Serine. Neurons were voltage-clamped at 0 mV and trains of 5x LED pulses were delivered to the slice in frame-scan mode at 0.06 Hz to locate spines with detectable Ca transients. Due to changes in microscope configuration to allow for simultaneous LED stimulation and imaging, fluorescence was collected on substage detectors only. To avoid damage to our GaAsP PMTs from the LED, a fast physical shutter was inserted in the detection path between the substage periscope and PMT beamsplitter cube housing (Sutter IQ35). Success trials (Fig. 2E–F) were defined when peak ΔF/F exceeded 1, 2 or 3 standard deviations of baseline ΔF/F noise within 10 ms of shutter reopening.
Optical Fluctuation Analysis
Optical fluctuation analysis models calcium influx as a binomial process arising from N CaVs, each with single-channel current i and open probability p. This process is similar to nonstationary fluctuation analysis of electrophysiological recordings, but modified to account for added sources of variability in imaging data that do not reflect variance in channel opening, including dark noise and shot noise. Because variances add linearly, the variance predicted by dark noise and shot noise alone can be subtracted from the measured variance to obtain variance related to CaV activity (Fig. 6D):
| (1a) |
where dark noise, , is the product of the width of the bouton in pixels, Np, and the estimated dark noise per pixel, :
| (1b) |
and shot noise, , is the product of the mean change in peak fluorescence, 〈ΔF〉, and the intensity per photon (in arbitrary units), q:
| (1c) |
The dark-noise parameter, , was measured in every experiment during the initial 50 ms of each trial (see Fig. 6B) by measuring the variance at each pixel over multiple trials and averaging this variance across pixels. The shot-noise parameter q was estimated by imaging a pipette filled with fluorescein with varying laser intensities and fitting the observed variance to the line:
| (1d) |
Once q and are measured, the inverse-square of the CaV-related coefficient of variation can then be estimated as:
| (2) |
One can make quantitative predictions as to how this variance should vary with 〈F〉 under different conditions. Specifically, should either reduce linearly, not change, or reduce quickly (nonlinearly, as a “linear rational function”) with reductions in N, i or p, respectively:
| (3) |
| (4) |
| (5) |
where R = 〈FPost〉/〈Fbaseline〉 and k = pbaseline.
To ensure that variance was related to fluctuations in CaV activity, care was taken to minimize other sources of variance, including optical drift. Data were excluded if: 1) the timing of the action potential peak changed by>0.1 ms), 2) trial-by-trial variability in peak ΔG/R after the AP was correlated when monitored between two simultaneously-imaged boutons in series, or 3) failures were observed in both boutons within the same trial, as these effects could result from AP conduction failures rather than independent CaV opening failures. Furthermore, time-locked vehicle controls showed no rundown of more than 5% up to 100 trials, after which spontaneous rundown of peak ΔG/R was occasionally observed; therefore, all OFA experiments were limited to a maximum of 100 trials, and variance was estimated with trial-to-trial correction for drift:
| (6) |
where n is the number of trials. This is equivalent to the standard measurement of variance as the sum of squared difference from the mean for an experiment without systematic drift, but has the advantage of minimizing unwanted increases in variance due to runup or rundown.
Computational Modeling
All modeling was performed in Python 3.5 (Numpy version 1.11). Images in Figure 7 were generated using Matplotlib version 2.0. See Supplemental Table 1 for a comprehensive list of model parameters in all models. Models were subjected to continuous integration testing using pytest via Travis CI (https://travis-ci.org/kenburke/synapseModel) to ensure successful execution across a wide range of combinations of parameter values, including rejection of invalid parameters (e.g. negative channel open probabilities or trial numbers).
We first designed a reduced computational model of synaptic transmission in order to directly incorporate the binomial parameters obtained from optical fluctuation analysis. We simulated 50 presynaptic axons, where calcium influx in response to each simulated action potential was modeled as the result of a binomial process resulting from N CaVs, each with independent probability p of increasing the calcium concentration instantaneously by amount i (in arbitrary units). Calcium concentration decayed with a single-exponential timecourse (time constant=50 ms, fit alongside Hill function to produce modest paired-pulse facilitation, Brenowitz and Regehr, 2007). We simulated the stochastic opening of single CaVs using a Monte Carlo method by generating an array of random uniformly distributed numbers in the range [0, 1) and testing whether the generated numbers were less than the open probability p on any given trial. Total calcium concentration was then calculated as the sum of all successful CaV openings (i current each) and residual calcium present from previous APs.
Vesicle release probability PR was then calculated per synapse as a Hill function of the calcium concentration (when zero CaVs opened in response to a stimulus, PR was set to zero to prevent release purely due to residual calcium). The maximum release probability per vesicle was a parameter that we hand-tuned in order to obtain realistic values of release probability (see Table S1, “vesicle_prox”). Individual release events were then modeled using a Monte Carlo method akin to CaV channel openings. Total quantal content was calculated as the total number of successful vesicle release events across synapses for a single trial. Quantal content was convolved with an AMPA-like waveform (kinetics adapted from Jonas et al., 1993) for visualization purposes only, as we wanted to avoid the contribution of postsynaptic filtering in our estimation of neurotransmitter release statistics.
This process was repeated 10,000 times for each parameter set tested. Modulation of individual model parameters (e.g. iCaV or popen) repeated this array of 10,000 simulations for a range of parameter values, scaling the parameter from 20% to 100% of its baseline value in 5% increments. In order to make fair comparisons between presynaptic configurations with differing numbers of CaVs driving release, we held constant the expected average calcium influx (the product NCaV · iCaV ·popen). This was achieved by multiplying the number of CaVs and dividing the single-channel current by the same parameter, “num_cav_ratio” (see Supplemental Table 1). PPR and CV−2 were calculated using the quantal content rather than the peak AMPA current for computational efficiency because they were mathematically equivalent. Simulation runs were then saved in a.pkl format for subsequent reference and replication.
In a second simulation, we modeled the diffusion of calcium from CaVs to vesicles explicitly using the “linearized buffer approximation” (Naraghi and Neher, 1997; Neher, 1998):
| (7a) |
where iCaV = 0.13 pA (Li et al., 2007; Scimemi and Diamond, 2012), F is the Faraday constant, DCa is the diffusion coefficient of free calcium (220 μm2/s, Allbritton et al., 1992), r is the distance between the vesicle and the calcium influx, and λ is the characteristic length constant:
| (7b) |
where Kon is the rate of calcium binding to free buffer (Klingauf and Neher, 1997) and [B]free is the concentration of free buffer:
| (7c) |
where [B]total is the total concentration of endogenous buffer, `L is the buffer dissociation constant and [Ca2+]basal is the basal free calcium concentration. Taken together, these three equations allowed us to calculate the initial calcium concentration as a function of distance from the point of calcium influx (assuming rapid equilibration at short distances). The calcium concentration then decayed exponentially, independent of distance, with a time constant of 40 ms to mimic slower timescale extrusion mechanisms (Brenowitz and Regehr, 2007).
The second feature we added to this model was two Hill functions with realistic parameters for calcium affinity and cooperativity to mediate vesicle release and facilitation. The Hill parameters for both functions were adapted from electrophysiological as well as biochemical measurements of affinity and cooperativity for synaptotagmin1 and synaptotagmin7 (Brandt et al., 2012; Scimemi and Diamond, 2012; Sugita et al., 2002). The initial release probability prelease was calculated by the first, lower affinity Hill function using instantaneous initial calcium concentration immediately following the AP, which was then facilitated based on the residual calcium concentration preceding the AP via the second Hill function:
| (8a) |
where
| (8b) |
and S, N, and EC50 are parameters for maximum value, cooperativity and half-maximal effective concentration, respectively. The values for cooperativity and half-maximal effective concentration were obtained from the literature (see Table S1), and the maximum value parameter S for the release and facilitation Hill functions was tuned to reproduce a realistic baseline release probability (based on OQA data, Fig. 2) and modest baseline paired-pulse facilitation, respectively.
In the initial reduced model, the increase in PPR with reductions in 3 was the result of both release events being calculated with a single Hill function. With the addition of a second, higher affinity Hill function to mediate facilitation, it was necessary to incorporate vesicle depletion and replenishment parameters to account for the increases in paired-pulse facilitation observed with reductions in 3 (Abbott et al., 1997; Scimemi and Diamond, 2012; Tsodyks and Markram, 1997). Each “synapse” was paired with one vesicle (because synapses are independent in this model, one could equivalently conceptualize them as independent pairs of release sites and CaV clusters). At the beginning of each trial, it was assumed that all vesicles were replenished and available for release by defining a binary variable pool_size. After calculating calcium influx and stochastic release for the first AP, the variable pool_size was set to zero at synapses where release was successful. On the second AP, all synapses where pool_size = 0 were randomly “replenished” (i.e. pool_size set to 1) with a time-dependent probability:
| (9a) |
where t is the time elapsed since the previous AP (i.e. the inter-stimulus interval), and τrecov is the replenishment time constant. After determining if each empty release site was replenished, the release probability for the second AP was calculated as
| (9b) |
where prelease is the output of Eq. 8a.
In the reduced model of Figure 7, when increasing the number of CaVs per synapse we reduced the single channel current in order to maintain constant the expected calcium concentration per synapse. Because we used realistic values for CaV single-channel current in the diffusion model, when increasing the number of channels per synapse we instead kept single-channel current constant and simply increased the CaV-vesicle distance to keep the expected value of the calcium concentration constant at each synapse (Fig. S7F,I). Without this adjustment, release probability would quickly saturate due to the Hill Function nonlinearity with the addition of even one CaV (data not shown, but see Fig. S7G). The following values for CaV-vesicle distance were used for synapses with the corresponding number of CaVs:
| Number CaVs | CaV-Vesicle Distance (nanometers) |
|---|---|
| 1 | 15 |
| 2 | 23.3 |
| 3 | 29.2 |
| 5 | 37.6 |
| 10 | 50.7 |
| 50 | 86.2 |
In some simulations, facilitation was modelled phenomenologically (Figure S6). In these simulations, we began with the reduced model from Figure 7, but rather than modeling exponential decay of calcium concentration, the vesicle release probability was calculated directly from the calcium influx per AP. The release probability for the second AP was then scaled according to the following formula:
| (10a) |
where pinitial is the initial release probability calculated from the Hill function of the calcium concentration, k is the facilitation parameter (“phenom_param”, Table S1) and:
| (10b) |
Short-Term Dynamics in Voltage- and Current-clamp
Evaluation of short-term plasticity for longer trains of stimuli and across different frequencies was achieved using the same preparation as earlier ChR2 stimulation experiments but with custom stimulation patterns (Fig. 8). In order to quantify the relative suppression of ongoing activity relative to single EPSCs, we quantified the charge ratio:
| (11a) |
where
| (11b) |
| (11c) |
For current-clamp experiments (Fig 8), EPSP amplitude was monitored by stimulating once 250 ms before the onset of injected noisy current waveforms. In each cell, rheobase was estimated by injecting one-second long square pulses of current in 25 pA increments until at least one AP was evoked. The noise stimulus was generated by simulating EPSCs at 1,000 Hz as the product of two exponentials, with amplitude +25 pA and rise/decay time constants of 0.303/2.0 ms (Sohal et al., 2009). IPSCs were similarly generated, but with amplitude −25 pA at 250 Hz. The noisy current stimulus was then added to a square pulse of amplitude (rheobase – 50 pA), as the mean of the noisy current stimulus was ~50 pA. Following an initial LED pulse 500 ms after the onset of the noisy-current waveform, intervals corresponding to 1, 5, 10 and 20 Hz were shuffled, generating a train of LED stimuli of varying frequency. Pairs of trials with the same noisy current waveform were interleaved with and without LED stimulation (data not shown). After collecting baseline data, D1R and GABABR agonists were bath-applied for 10 minutes before collecting the “post-drug” data. Offline, spikes were detected reliably by crossing 0 mV and LED-triggered averages of instantaneous frequency were calculated using 3 ms bins. The change in evoked spiking quantified in Fig. 8J measured average instantaneous frequency in the 12 ms following an LED pulse. The same inclusion criteria were used for these experiments as outlined for ChR2 oEPSC experiments.
QUANTIFICATION AND STATISTICAL ANALYSIS
All data are shown as mean ± SEM, where “n” refers to the number of cells (for electrophysiological recording experiments) or boutons or spines (for Ca imaging experiments). Summary data and the name and results of statistical tests are interspersed with text in parentheticals in the Results section. Preliminary analysis and data visualization was performed in Igor Pro and MATLAB (MathWorks). Statistical tests used Kruskal-Wallis with Wilcoxon’s rank-sum test and the Holm-Sidak correction for multiple comparisons. Significance was set to p < 0.05 unless otherwise stated.
DATA AND SOFTWARE AVAILABILITY
All code for computational models of vesicle release, and tutorials for simple simulations or replication, is available at https://github.com/kenburke/synapseModel
Supplementary Material
Highlights.
Dopamine suppresses specific glutamatergic inputs to prefrontal cortex
This presynaptic suppression occurs without increasing short-term facilitation
GABAB receptors increase facilitation at the same synapse
Biased regulation of presynaptic calcium channels underlies these differences
Acknowledgments
We are grateful to Drs. D Ron, G Bouvier, H Fields, and S Robinson-Schwartz as well as members of the Bender laboratory for discussions and comments on this work, to Drs. B Carter and C Jahr for their support and expertise in designing the optical fluctuation analysis experiments, and Drs. A Scimemi and J Diamond for helpful discussions and sharing simulation code for release models. This research was supported by a scholarship from the ARCS Foundation (Burke) and the NIH (DA035913, Bender).
Footnotes
Publisher's Disclaimer: This is a PDF file of an unedited manuscript that has been accepted for publication. As a service to our customers we are providing this early version of the manuscript. The manuscript will undergo copyediting, typesetting, and review of the resulting proof before it is published in its final citable form. Please note that during the production process errors may be discovered which could affect the content, and all legal disclaimers that apply to the journal pertain.
Author Contributions
Experimental design: Burke and Bender; Experimental execution: Burke, Keeshen and Bender; Data analysis: Burke, Keeshen and Bender; Funding acquisition: Bender; Project administration: Burke and Bender; Supervision: Bender; Visualization: Burke, Keeshen and Bender; Writing: Burke and Bender.
Declaration of interests:
The authors declare no competing interests.
References
- Abbott LF, Regehr WG. Synaptic computation. Nature. 2004;431:796–803. doi: 10.1038/nature03010. [DOI] [PubMed] [Google Scholar]
- Abbott LF, Varela JA, Sen K, Nelson SB. Synaptic depression and cortical gain control. Science. 1997;275:220–224. doi: 10.1126/science.275.5297.221. [DOI] [PubMed] [Google Scholar]
- Allbritton NL, Meyer T, Stryer L. Range of messenger action of calcium ion and inositol 1,4,5-trisphosphate. Science. 1992;258:1812–1815. doi: 10.1126/science.1465619. [DOI] [PubMed] [Google Scholar]
- Arnsten AF, Cai JX, Murphy BL, Goldman-Rakic PS. Dopamine D1 receptor mechanisms in the cognitive performance of young adult and aged monkeys. Psychopharmacology (Berl) 1994;116:143–151. doi: 10.1007/BF02245056. [DOI] [PubMed] [Google Scholar]
- Barth AL, Poulet JFA. Experimental evidence for sparse firing in the neocortex. Trends Neurosci. 2012;35:345–355. doi: 10.1016/j.tins.2012.03.008. [DOI] [PubMed] [Google Scholar]
- Behr J, Gloveli T, Schmitz D, Heinemann U. Dopamine depresses excitatory synaptic transmission onto rat subicular neurons via presynaptic D1-like dopamine receptors. J Neurophysiol. 2000;84:112–119. doi: 10.1152/jn.2000.84.1.112. [DOI] [PubMed] [Google Scholar]
- Bender KJ, Trussell LO. Axon Initial Segment Ca2+ Channels Influence Action Potential Generation and Timing. Neuron. 2009;61:259–271. doi: 10.1016/j.neuron.2008.12.004. [DOI] [PMC free article] [PubMed] [Google Scholar]
- Bender KJ, Ford CP, Trussell LO. Dopaminergic modulation of axon initial segment calcium channels regulates action potential initiation. Neuron. 2010;68:500–511. doi: 10.1016/j.neuron.2010.09.026. [DOI] [PMC free article] [PubMed] [Google Scholar]
- Betz WJ. Depression of transmitter release at the neuromuscular junction of the frog. J Physiol. 1970;206:629–644. doi: 10.1113/jphysiol.1970.sp009034. [DOI] [PMC free article] [PubMed] [Google Scholar]
- Blatow M, Caputi A, Burnashev N, Monyer H, Rozov A. Ca2+ buffer saturation underlies paired pulse facilitation in calbindin-D28k-containing terminals. Neuron. 2003;38:79–88. doi: 10.1016/s0896-6273(03)00196-x. [DOI] [PubMed] [Google Scholar]
- Bolkan SS, Stujenske JM, Parnaudeau S, Spellman TJ, Rauffenbart C, Abbas AI, Harris AZ, Gordon JA, Kellendonk C. Thalamic projections sustain prefrontal activity during working memory maintenance. Nat Neurosci. 2017;20:987–996. doi: 10.1038/nn.4568. [DOI] [PMC free article] [PubMed] [Google Scholar]
- Borst JGG, Sakmann B. Calcium current during a single action potential in a large presynaptic terminal of the rat brainstem. J Physiol. 1998;506:143–157. doi: 10.1111/j.1469-7793.1998.143bx.x. [DOI] [PMC free article] [PubMed] [Google Scholar]
- Boudewijns ZSRM, Groen MR, Lodder B, McMaster MTB, Kalogreades L, de Haan R, Narayanan RT, Meredith RM, Mansvelder HD, de Kock CPJ. Layer-specific high-frequency action potential spiking in the prefrontal cortex of awake rats. Front Cell Neurosci. 2013;7:99. doi: 10.3389/fncel.2013.00099. [DOI] [PMC free article] [PubMed] [Google Scholar]
- Branco T, Staras K. The probability of neurotransmitter release: variability and feedback control at single synapses. Nat Rev Neurosci. 2009;10:373–383. doi: 10.1038/nrn2634. [DOI] [PubMed] [Google Scholar]
- Brandt DS, Coffman MD, Falke JJ, Knight JD. Hydrophobic contributions to the membrane docking of synaptotagmin 7 C2A domain: mechanistic contrast between isoforms 1 and 7. Biochemistry. 2012;51:7654–7664. doi: 10.1021/bi3007115. [DOI] [PMC free article] [PubMed] [Google Scholar]
- Brenowitz SD, Regehr WG. Reliability and Heterogeneity of Calcium Signaling at Single Presynaptic Boutons of Cerebellar Granule Cells. J Neurosci. 2007;27:7888–7898. doi: 10.1523/JNEUROSCI.1064-07.2007. [DOI] [PMC free article] [PubMed] [Google Scholar]
- Brozoski TJ, Brown RM, Rosvold HE, Goldman PS. Cognitive deficit caused by regional depletion of dopamine in prefrontal cortex of rhesus monkey. Science. 1979;205:929–932. doi: 10.1126/science.112679. [DOI] [PubMed] [Google Scholar]
- Bucurenciu I, Kulik A, Schwaller B, Frotscher M, Jonas P. Nanodomain Coupling between Ca2+ Channels and Ca2+ Sensors Promotes Fast and Efficient Transmitter Release at a Cortical GABAergic Synapse. Neuron. 2008;57:536–545. doi: 10.1016/j.neuron.2007.12.026. [DOI] [PubMed] [Google Scholar]
- Bucurenciu I, Bischofberger J, Jonas P. A small number of open Ca2+ channels trigger transmitter release at a central GABAergic synapse. Nat Neurosci. 2010;13:19–21. doi: 10.1038/nn.2461. [DOI] [PubMed] [Google Scholar]
- Burgos-Robles A, Vidal-Gonzalez I, Santini E, Quirk GJ. Consolidation of Fear Extinction Requires NMDA Receptor-Dependent Bursting in the Ventromedial Prefrontal Cortex. Neuron. 2007;53:871–880. doi: 10.1016/j.neuron.2007.02.021. [DOI] [PubMed] [Google Scholar]
- Carter BC, Jahr CE. Postsynaptic, not presynaptic NMDA receptors are required for spike-timing-dependent LTD induction. Nat Neurosci. 2016;19:1218–1224. doi: 10.1038/nn.4343. [DOI] [PMC free article] [PubMed] [Google Scholar]
- Chalifoux JR, Carter AG. GABAB receptor modulation of synaptic function. Curr Opin Neurobiol. 2011;21:339–344. doi: 10.1016/j.conb.2011.02.004. [DOI] [PMC free article] [PubMed] [Google Scholar]
- Clarkson RL, Liptak AT, Gee SM, Sohal VS, Bender KJ. D3 Receptors Regulate Excitability in a Unique Class of Prefrontal Pyramidal Cells. J Neurosci. 2017;37:5846–5860. doi: 10.1523/JNEUROSCI.0310-17.2017. [DOI] [PMC free article] [PubMed] [Google Scholar]
- Clements JD. A statistical test for demonstrating a presynaptic site of action for a modulator of synaptic amplitude. J Neurosci Methods. 1990;31:75–88. doi: 10.1016/0165-0270(90)90012-5. [DOI] [PubMed] [Google Scholar]
- Delaney AJ, Crane JW, Sah P. Noradrenaline Modulates Transmission at a Central Synapse by a Presynaptic Mechanism. Neuron. 2007;56:880–892. doi: 10.1016/j.neuron.2007.10.022. [DOI] [PubMed] [Google Scholar]
- Eggermann E, Bucurenciu I, Goswami SP, Jonas P. Nanodomain coupling between Ca2+ channels and sensors of exocytosis at fast mammalian synapses. Nat Rev Neurosci. 2012;13:7–21. doi: 10.1038/nrn3125. [DOI] [PMC free article] [PubMed] [Google Scholar]
- Fedchyshyn MJ, Wang LY. Developmental Transformation of the Release Modality at the Calyx of Held Synapse. J Neurosci. 2005;25:4131–4140. doi: 10.1523/JNEUROSCI.0350-05.2005. [DOI] [PMC free article] [PubMed] [Google Scholar]
- Gao WJ, Goldman-Rakic PS. Selective modulation of excitatory and inhibitory microcircuits by dopamine. 2002 doi: 10.1073/pnas.262796399. [DOI] [PMC free article] [PubMed] [Google Scholar]
- Gao WJ, Krimer LS, Goldman-Rakic PS. Presynaptic regulation of recurrent excitation by D1 receptors in prefrontal circuits. Proc Natl Acad Sci. 2001;98:295–300. doi: 10.1073/pnas.011524298. [DOI] [PMC free article] [PubMed] [Google Scholar]
- Gao WJ, Wang Y, Goldman-Rakic PS. Dopamine modulation of perisomatic and peridendritic inhibition in prefrontal cortex. J Neurosci. 2003;23:1622–1630. doi: 10.1523/JNEUROSCI.23-05-01622.2003. [DOI] [PMC free article] [PubMed] [Google Scholar]
- Gee S, Ellwood I, Patel T, Luongo F, Deisseroth K, Sohal VS. Synaptic Activity Unmasks Dopamine D2 Receptor Modulation of a Specific Class of Layer V Pyramidal Neurons in Prefrontal Cortex. J Neurosci. 2012;32:4959–4971. doi: 10.1523/JNEUROSCI.5835-11.2012. [DOI] [PMC free article] [PubMed] [Google Scholar]
- Goutman JD, Glowatzki E. Time course and calcium dependence of transmitter release at a single ribbon synapse. Proc Natl Acad Sci. 2007;104:16341–16346. doi: 10.1073/pnas.0705756104. [DOI] [PMC free article] [PubMed] [Google Scholar]
- Hefft S, Kraushaar U, Geiger JR, Jonas P. Presynaptic short-term depression is maintained during regulation of transmitter release at a GABAergic synapse in rat hippocampus. J Physiol. 2002;539:201–208. doi: 10.1113/jphysiol.2001.013455. [DOI] [PMC free article] [PubMed] [Google Scholar]
- Hennig MH. Theoretical models of synaptic short term plasticity. Front Comput Neurosci. 2013;7:45. doi: 10.3389/fncom.2013.00045. [DOI] [PMC free article] [PubMed] [Google Scholar]
- Higley MJ, Soler-Llavina GJ, Sabatini BL. Cholinergic modulation of multivesicular release regulates striatal synaptic potency and integration. Nat Neurosci. 2009;12:1121–1128. doi: 10.1038/nn.2368. [DOI] [PMC free article] [PubMed] [Google Scholar]
- Hjelmstad GO. Dopamine excites nucleus accumbens neurons through the differential modulation of glutamate and GABA release. J Neurosci. 2004;24:8621–8628. doi: 10.1523/JNEUROSCI.3280-04.2004. [DOI] [PMC free article] [PubMed] [Google Scholar]
- Holmes A, Fitzgerald PJ, MacPherson KP, DeBrouse L, Colacicco G, Flynn SM, Masneuf S, Pleil KE, Li C, Marcinkiewcz CA, et al. Chronic alcohol remodels prefrontal neurons and disrupts NMDAR-mediated fear extinction encoding. Nat Neurosci. 2012;15:1359–1361. doi: 10.1038/nn.3204. [DOI] [PMC free article] [PubMed] [Google Scholar]
- Holmes NM, Crane JW, Tang M, Fam J, Westbrook RF, Delaney AJ. α2-adrenoceptor-mediated inhibition in the central amygdala blocks fear-conditioning. Sci Rep. 2017;7:11712. doi: 10.1038/s41598-017-12115-x. [DOI] [PMC free article] [PubMed] [Google Scholar]
- Huynh TG, Cuny H, Slesinger PA, Adams DJ. Novel mechanism of voltage-gated N-type (Cav2.2) calcium channel inhibition revealed through α-conotoxin Vc1.1 activation of the GABA(B) receptor. Mol Pharmacol. 2015;87:240–250. doi: 10.1124/mol.114.096156. [DOI] [PubMed] [Google Scholar]
- Jackman SL, Regehr WG. The Mechanisms and Functions of Synaptic Facilitation. Neuron. 2017;94:447–464. doi: 10.1016/j.neuron.2017.02.047. [DOI] [PMC free article] [PubMed] [Google Scholar]
- Jackman SL, Turecek J, Belinsky JE, Regehr WG. The calcium sensor synaptotagmin 7 is required for synaptic facilitation. Nature. 2016;529:88–91. doi: 10.1038/nature16507. [DOI] [PMC free article] [PubMed] [Google Scholar]
- Jonas P, Major G, Sakmann B. Quantal components of unitary EPSCs at the mossy fibre synapse on CA3 pyramidal cells of rat hippocampus. J Physiol. 1993;472:615–663. doi: 10.1113/jphysiol.1993.sp019965. [DOI] [PMC free article] [PubMed] [Google Scholar]
- Kamiya H, Zucker RS. Residual Ca2 + and short-term synaptic plasticity. Nature. 1994;371:603–606. doi: 10.1038/371603a0. [DOI] [PubMed] [Google Scholar]
- Kisilevsky AE, Mulligan SJ, Altier C, Iftinca MC, Varela D, Tai C, Chen L, Hameed S, Hamid J, MacVicar BA, et al. D1 Receptors Physically Interact with N-Type Calcium Channels to Regulate Channel Distribution and Dendritic Calcium Entry. Neuron. 2008;58:557–570. doi: 10.1016/j.neuron.2008.03.002. [DOI] [PubMed] [Google Scholar]
- Klingauf J, Neher E. Modeling buffered Ca2+ diffusion near the membrane: implications for secretion in neuroendocrine cells. Biophys J. 1997;72:674–690. doi: 10.1016/s0006-3495(97)78704-6. [DOI] [PMC free article] [PubMed] [Google Scholar]
- Laviolette SR, Lipski WJ, Grace AA. A Subpopulation of Neurons in the Medial Prefrontal Cortex Encodes Emotional Learning with Burst and Frequency Codes through a Dopamine D4 Receptor-Dependent Basolateral Amygdala Input. J Neurosci. 2005;25:6066–6075. doi: 10.1523/JNEUROSCI.1168-05.2005. [DOI] [PMC free article] [PubMed] [Google Scholar]
- Li C, Pleil KE, Stamatakis AM, Busan S, Vong L, Lowell BB, Stuber GD, Kash TL. Presynaptic Inhibition of Gamma-Aminobutyric Acid Release in the Bed Nucleus of the Stria Terminalis by Kappa Opioid Receptor Signaling. Biol Psychiatry. 2012;71:725–732. doi: 10.1016/j.biopsych.2011.11.015. [DOI] [PMC free article] [PubMed] [Google Scholar]
- Li L, Bischofberger J, Jonas P. Differential Gating and Recruitment of P/Q-, N-, and R-Type Ca2+ Channels in Hippocampal Mossy Fiber Boutons. J Neurosci. 2007;27:13420–13429. doi: 10.1523/JNEUROSCI.1709-07.2007. [DOI] [PMC free article] [PubMed] [Google Scholar]
- Little JP, Carter AG. Subcellular Synaptic Connectivity of Layer 2 Pyramidal Neurons in the Medial Prefrontal Cortex. J Neurosci. 2012;32:12808–12819. doi: 10.1523/JNEUROSCI.1616-12.2012. [DOI] [PMC free article] [PubMed] [Google Scholar]
- Luvisetto S, Fellin T, Spagnolo M, Hivert B, Brust PF, Harpold MM, Stauderman KA, Williams ME, Pietrobon D. Modal gating of human CaV2.1 (P/Q-type) calcium channels: I. The slow and the fast gating modes and their modulation by beta subunits. J Gen Physiol. 2004;124:445–461. doi: 10.1085/jgp.200409034. [DOI] [PMC free article] [PubMed] [Google Scholar]
- Mainen ZF, Malinow R, Svoboda K. Synaptic calcium transients in single spines indicate that NMDA receptors are not saturated. Nature. 1999;399:151–155. doi: 10.1038/20187. [DOI] [PubMed] [Google Scholar]
- Markram H, Wang Y, Tsodyks M. Differential signaling via the same axon of neocortical pyramidal neurons. Proc Natl Acad Sci U S A. 1998;95:5323–5328. doi: 10.1073/pnas.95.9.5323. [DOI] [PMC free article] [PubMed] [Google Scholar]
- McDonough SI, Swartz KJ, Mintz IM, Boland LM, Bean BP. Inhibition of calcium channels in rat central and peripheral neurons by omega-conotoxin MVIIC. J Neurosci. 1996;16:2612–2623. doi: 10.1523/JNEUROSCI.16-08-02612.1996. [DOI] [PMC free article] [PubMed] [Google Scholar]
- Mintz IM, Bean BP. GABAB receptor inhibition of P-type Ca2+ channels in central neurons. Neuron. 1993;10:889–898. doi: 10.1016/0896-6273(93)90204-5. [DOI] [PubMed] [Google Scholar]
- Nakamura Y, Reva M, DiGregorio DA. Variations in Ca 2+ Influx Can Alter Chelator-Based Estimates of Ca 2+ Channel–Synaptic Vesicle Coupling Distance. J Neurosci. 2018;38:3971–3987. doi: 10.1523/JNEUROSCI.2061-17.2018. [DOI] [PMC free article] [PubMed] [Google Scholar]
- Naraghi M, Neher E. Linearized buffered Ca2+ diffusion in microdomains and its implications for calculation of [Ca2+] at the mouth of a calcium channel. J Neurosci. 1997;17:6961–6973. doi: 10.1523/JNEUROSCI.17-18-06961.1997. [DOI] [PMC free article] [PubMed] [Google Scholar]
- Neher E. Usefulness and limitations of linear approximations to the understanding of Ca++signals. Cell Calcium. 1998;24:345–357. doi: 10.1016/s0143-4160(98)90058-6. [DOI] [PubMed] [Google Scholar]
- Oertner TG, Sabatini BL, Nimchinsky EA, Svoboda K. Facilitation at single synapses probed with optical quantal analysis. Nat Neurosci. 2002;5:657–664. doi: 10.1038/nn867. [DOI] [PubMed] [Google Scholar]
- Otis TS, Trussell LO. Inhibition of transmitter release shortens the duration of the excitatory synaptic current at a calyceal synapse. J Neurophysiol. 1996;76:3584–3588. doi: 10.1152/jn.1996.76.5.3584. [DOI] [PubMed] [Google Scholar]
- Park D, Dunlap K. Dynamic regulation of calcium influx by G-proteins, action potential waveform, and neuronal firing frequency. J Neurosci. 1998;18:6757–6766. doi: 10.1523/JNEUROSCI.18-17-06757.1998. [DOI] [PMC free article] [PubMed] [Google Scholar]
- Patil PG, de Leon M, Reed RR, Dubel S, Snutch TP, Yue DT. Elementary events underlying voltage-dependent G-protein inhibition of N-type calcium channels. Biophys J. 1996;71:2509–2521. doi: 10.1016/S0006-3495(96)79444-4. [DOI] [PMC free article] [PubMed] [Google Scholar]
- Patil PG, Brody DL, Yue DT. Preferential closed-state inactivation of neuronal calcium channels. Neuron. 1998;20:1027–1038. doi: 10.1016/s0896-6273(00)80483-3. [DOI] [PubMed] [Google Scholar]
- Quastel DM. The binomial model in fluctuation analysis of quantal neurotransmitter release. Biophys J. 1997;72:728–753. doi: 10.1016/s0006-3495(97)78709-5. [DOI] [PMC free article] [PubMed] [Google Scholar]
- Rozov A, Burnashev N, Sakmann B, Neher E. Transmitter release modulation by intracellular Ca2+ buffers in facilitating and depressing nerve terminals of pyramidal cells in layer 2/3 of the rat neocortex indicates a target cell-specific difference in presynaptic calcium dynamics. J Physiol. 2001;531:807–826. doi: 10.1111/j.1469-7793.2001.0807h.x. [DOI] [PMC free article] [PubMed] [Google Scholar]
- Saviane C, Silver RA. Errors in the estimation of the variance: implications for multiple-probability fluctuation analysis. J Neurosci Methods. 2006;153:250–260. doi: 10.1016/j.jneumeth.2005.11.003. [DOI] [PubMed] [Google Scholar]
- Schmitt LI, Wimmer RD, Nakajima M, Happ M, Mofakham S, Halassa MM. Thalamic amplification of cortical connectivity sustains attentional control. Nature. 2017;545:219–223. doi: 10.1038/nature22073. [DOI] [PMC free article] [PubMed] [Google Scholar]
- Scimemi A, Diamond JS. The Number and Organization of Ca2+ Channels in the Active Zone Shapes Neurotransmitter Release from Schaffer Collateral Synapses. J Neurosci. 2012;32:18157–18176. doi: 10.1523/JNEUROSCI.3827-12.2012. [DOI] [PMC free article] [PubMed] [Google Scholar]
- Seamans JK, Yang CR. The principal features and mechanisms of dopamine modulation in the prefrontal cortex. Prog Neurobiol. 2004;74:1–58. doi: 10.1016/j.pneurobio.2004.05.006. [DOI] [PubMed] [Google Scholar]
- Seamans JK, Durstewitz D, Christie BR, Stevens CF, Sejnowski TJ. Dopamine D1/D5 receptor modulation of excitatory synaptic inputs to layer V prefrontal cortex neurons. Proc Natl Acad Sci. 2001;98:301–306. doi: 10.1073/pnas.011518798. [DOI] [PMC free article] [PubMed] [Google Scholar]
- Seong HJ, Carter AG. D1 Receptor Modulation of Action Potential Firing in a Subpopulation of Layer 5 Pyramidal Neurons in the Prefrontal Cortex. J Neurosci. 2012;32:10516–10521. doi: 10.1523/JNEUROSCI.1367-12.2012. [DOI] [PMC free article] [PubMed] [Google Scholar]
- Sigworth FJ. The variance of sodium current fluctuations at the node of Ranvier. J Physiol. 1980;307:97–129. doi: 10.1113/jphysiol.1980.sp013426. [DOI] [PMC free article] [PubMed] [Google Scholar]
- Silver RA. Neuronal arithmetic. Nat Rev Neurosci. 2010;11:474–489. doi: 10.1038/nrn2864. [DOI] [PMC free article] [PubMed] [Google Scholar]
- Sohal VS, Zhang F, Yizhar O, Deisseroth K. Parvalbumin neurons and gamma rhythms enhance cortical circuit performance. Nature. 2009;459:698–702. doi: 10.1038/nature07991. [DOI] [PMC free article] [PubMed] [Google Scholar]
- Stanley EF. The Nanophysiology of Fast Transmitter Release. Trends Neurosci. 2016;39:183–197. doi: 10.1016/j.tins.2016.01.005. [DOI] [PubMed] [Google Scholar]
- Sugita S, Shin OH, Han W, Lao Y, Südhof TC. Synaptotagmins form a hierarchy of exocytotic Ca 2+ sensors with distinct Ca 2+ affinities. EMBO J. 2002;21:270–280. doi: 10.1093/emboj/21.3.270. [DOI] [PMC free article] [PubMed] [Google Scholar]
- Surmeier DJ, Bargas J, Hemmings HC, Nairn AC, Greengard P. Modulation of calcium currents by a D1 dopaminergic protein kinase/phosphatase cascade in rat neostriatal neurons. Neuron. 1995;14:385–397. doi: 10.1016/0896-6273(95)90294-5. [DOI] [PubMed] [Google Scholar]
- Svoboda K, Sabatini BL. Analysis of calcium channels in single spines using optical fluctuation analysis. Nature. 2000;408:589–593. doi: 10.1038/35046076. [DOI] [PubMed] [Google Scholar]
- Takahashi T, Kajikawa Y, Tsujimoto T. G-Protein-coupled modulation of presynaptic calcium currents and transmitter release by a GABAB receptor. J Neurosci. 1998;18:3138–3146. doi: 10.1523/JNEUROSCI.18-09-03138.1998. [DOI] [PMC free article] [PubMed] [Google Scholar]
- Tejeda HA, Wu J, Kornspun AR, Pignatelli M, Kashtelyan V, Krashes MJ, Lowell BB, Carlezon WA, Bonci A. Pathway- and Cell-Specific Kappa-Opioid Receptor Modulation of Excitation-Inhibition Balance Differentially Gates D1 and D2 Accumbens Neuron Activity. Neuron. 2017;93:147–163. doi: 10.1016/j.neuron.2016.12.005. [DOI] [PMC free article] [PubMed] [Google Scholar]
- Thévenod F, Jones SW. Cadmium block of calcium current in frog sympathetic neurons. Biophys J. 1992;63:162–168. doi: 10.1016/S0006-3495(92)81575-8. [DOI] [PMC free article] [PubMed] [Google Scholar]
- Tritsch NX, Sabatini BL. Dopaminergic Modulation of Synaptic Transmission in Cortex and Striatum. Neuron. 2012;76:33–50. doi: 10.1016/j.neuron.2012.09.023. [DOI] [PMC free article] [PubMed] [Google Scholar]
- Tsodyks MV, Markram H. The neural code between neocortical pyramidal neurons depends on neurotransmitter release probability. Proc Natl Acad Sci U S A. 1997;94:719–723. doi: 10.1073/pnas.94.2.719. [DOI] [PMC free article] [PubMed] [Google Scholar]
- Urban NN, González-Burgos G, Henze DA, Lewis DA, Barrionuevo G. Selective reduction by dopamine of excitatory synaptic inputs to pyramidal neurons in primate prefrontal cortex. J Physiol. 2002;539:707–712. doi: 10.1113/jphysiol.2001.015024. [DOI] [PMC free article] [PubMed] [Google Scholar]
- Varela JA, Sen K, Gibson J, Fost J, Abbott LF, Nelson SB. A quantitative description of short-term plasticity at excitatory synapses in layer 2/3 of rat primary visual cortex. J Neurosci. 1997;17:7926–7940. doi: 10.1523/JNEUROSCI.17-20-07926.1997. [DOI] [PMC free article] [PubMed] [Google Scholar]
- Vijayraghavan S, Wang M, Birnbaum SG, Williams GV, Arnsten AFT. Inverted-U dopamine D1 receptor actions on prefrontal neurons engaged in working memory. Nat Neurosci. 2007;10:376–384. doi: 10.1038/nn1846. [DOI] [PubMed] [Google Scholar]
- Vyleta NP, Jonas P. Loose Coupling Between Ca2+ Channels and Release Sensors at a Plastic Hippocampal Synapse. Science (80-) 2014;343:665–670. doi: 10.1126/science.1244811. [DOI] [PubMed] [Google Scholar]
- Wang W, Dever D, Lowe J, Storey GP, Bhansali A, Eck EK, Nitulescu I, Weimer J, Bamford NS. Regulation of prefrontal excitatory neurotransmission by dopamine in the nucleus accumbens core. J Physiol. 2012;590:3743–3769. doi: 10.1113/jphysiol.2012.235200. [DOI] [PMC free article] [PubMed] [Google Scholar]
- Xia Y, Zhao Y, Yang M, Zeng S, Shu Y. Regulation of action potential waveforms by axonal GABAA receptors in cortical pyramidal neurons. PLoS One. 2014;9:e100968. doi: 10.1371/journal.pone.0100968. [DOI] [PMC free article] [PubMed] [Google Scholar]
- Yang S, Ben-Shalom R, Ahn M, Liptak AT, van Rijn RM, Whistler JL, Bender KJ. β-Arrestin-Dependent Dopaminergic Regulation of Calcium Channel Activity in the Axon Initial Segment. Cell Rep. 2016;16:1518–1526. doi: 10.1016/j.celrep.2016.06.098. [DOI] [PMC free article] [PubMed] [Google Scholar]
- Yasuda R, Sabatini BL, Svoboda K. Plasticity of calcium channels in dendritic spines. Nat Neurosci. 2003;6:948–955. doi: 10.1038/nn1112. [DOI] [PubMed] [Google Scholar]
- Zhang XF, Cooper DC, White FJ. Repeated cocaine treatment decreases whole-cell calcium current in rat nucleus accumbens neurons. J Pharmacol Exp Ther. 2002;301:1119–1125. doi: 10.1124/jpet.301.3.1119. [DOI] [PubMed] [Google Scholar]
- Zucker RS, Regehr WG. Short-Term Synaptic Plasticity. Annu Rev Physiol. 2002;64:355–405. doi: 10.1146/annurev.physiol.64.092501.114547. [DOI] [PubMed] [Google Scholar]
Associated Data
This section collects any data citations, data availability statements, or supplementary materials included in this article.
Supplementary Materials
Data Availability Statement
All code for computational models of vesicle release, and tutorials for simple simulations or replication, is available at https://github.com/kenburke/synapseModel