

Abstract
Background.
Religiosity, encompassing spirituality and religious practices, is associated with reduced disease incidence among individuals of low socioeconomic status and who self-identify as Black. We hypothesized that religiosity associates with reduced end-stage kidney disease (ESKD) risk among Black but not White adults of low socioeconomic status.
Design.
Cox models of religiosity and ESKD risk in 76,443 adults.
Results.
Black adults reporting high spirituality had reduced ESKD risk after adjusting for demographic characteristics [Hazard Ratio (HR) .82 (95% Confidence Interval (CI)) (.69–.98)], depressive symptoms, social support, and tobacco use [HR .81 (CI .68–.96)]. When clinical covariates were added, associations between spirituality and ESKD were slightly attenuated and lost significance [HR .85 (CI .68–1.06)]. Associations were not demonstrated among White adults.
Conclusions.
Spirituality associates with reduced ESKD risk among Black adults of low socioeconomic status independent of demographic, psychosocial, and behavioral characteristics. Effect modification by race was not statistically significant.
Keywords: Spirituality, religion, church attendance, religious coping, psychosocial stress, chronic kidney disease epidemiology, end-stage kidney disease incidence
Religiosity, a multi-dimensional construct encompassing spirituality, religious beliefs, and religious practices with which people may self-identify an affiliation, is associated with decreased psychological stress, reduced disease incidence, and improved survival in cardiovascular disease and other chronic illnesses.1–2 While spirituality generally refers to one’s relationship with the sacred or the search for meaning in life, religion consists of a particular system of faith and worship.3 As these constructs are related yet distinct, conceptual frameworks of religiosity posit that effects of spirituality and religion on health outcomes should be examined separately.4
Many individuals who emphasize spirituality or religion in their daily lives report improvements in emotional well-being, social support, and disease management behaviors related to it. The salutary effects of religiosity on disease outcomes are theorized to occur in part via these mechanisms.5–7 Individuals in the United States (U.S.) who self-identify as Black, those with low annual incomes, and those with decreased educational attainment report a higher degree of spirituality, a higher degree of comfort from religion, and a greater frequency of service attendance in comparison with those who do not belong to these groups.8 Thus, understanding the effects of religiosity on health outcomes may be particularly relevant to individuals who self-identify as Black and are of low socioeconomic status. Given the disproportionate burden of end-stage kidney disease (ESKD) faced by individuals belonging to these groups in the U.S., assessing the effects of religiosity on ESKD risk may help identify novel mechanisms for culturally tailored strategies to prevent incident advanced kidney disease in vulnerable populations.9–11
We tested whether high levels of self-reported religiosity, assessed multidimensionally, were associated with reduced ESKD risk in a large cohort of Black and White adults of low socioeconomic status in the southeastern U.S. We hypothesized that Black participants who reported the highest degree of religiosity would have a statistically significant decrease in ESKD risk independent of clinical covariates. Given that religiosity is theorized to improve health outcomes via improvements in psychosocial support and behavioral activation, we further hypothesized that significant associations between religiosity and ESKD risk would be attenuated by psychosocial and behavioral covariates.
Methods
Study population and design.
We analyzed data from 76,443 of 84,512 adults in the Southern Community Cohort Study (SCCS), an ongoing prospective cohort of individuals of generally low socioeconomic status recruited from 12 states in the Southeast between 2002 and 2009. A detailed description of SCCS methods has previously been published (http://www.southerncommunitystudy.org).12 Eighty-six percent of participants were enrolled at community health centers (CHCs), and 14% were enrolled via mail-based general population sampling. Southern Community Cohort Study participants provided written informed consent, and protocols were approved by the Institutional Review Boards of Vanderbilt University and Meharry Medical College. Roughly 54% of those enrolled at CHCs donated baseline blood samples which were frozen at −80 degrees Celsius in Vanderbilt’s SCCS Biospecimen Repository.
Data collection and measures used.
Participants completed standardized questionnaires at enrollment which enquired about demographic, socioeconomic, lifestyle and psychosocial characteristics, personal and family medical history, and other factors (questionnaire at http://www.southerncommunitystudy.org). Religiosity was assessed using three self-reported measures: degree of comfort brought from religion (not very much, somewhat, quite a bit, a great deal), frequency of religious service attendance (never, major holidays, more than four times per year but less than once per week, once per week, more than once per week), and degree of spirituality (not at all, slightly, fairly, very). Measures were adapted from existing, validated scales of religiosity, and participants were not asked to specify religious denomination.13 Depressive symptoms were ascertained using the validated Center for Epidemiologic Studies Depression Scale-10 (CESD-10).14 Scores range from 0 to 30, and a score of 10 or above is considered the cut-off to identify risk for clinical depression. Additional psychosocial and clinical variables were measured by self-report (size of social network, frequency of tobacco use, presence of hypertension, presence of diabetes). Incident cases of ESKD among cohort members were ascertained via linkage to the U.S. Renal Data System (USRDS) from January 1, 2002 to March 31, 2015.
Of the individuals in the cohort, 4,717 with a stored serum sample had a measurement of baseline creatinine available for calculation of estimated glomerular filtration rate (eGFR) using the Chronic Kidney Disease Epidemiology Collaboration (CKD-EPI) equation. The same equation for eGFR estimation was used for both Black and White adults. For the remainder of participants, we performed multiple imputation for eGFR values using health indicators and sociodemographic covariates.
Statistical analyses.
We restricted our study population to self-reported non-Hispanic White or Black participants, as the SCCS does not contain an adequate sample size for stable statistical analyses of other groups. Excluded from the study population were patients who: self-reported as neither Black nor White (n=4,107); were censored on the day of enrollment [due to death] (n = 19); had missing items on the CESD-10 score (n=3,304); had missing religiosity variables (n=219); or had prevalent ESKD at cohort enrollment (n=420), leaving 76,443 individuals for the analytic dataset. A total of 1,565 incident ESKD cases were identified by USRDS linkage through March 31, 2015.
We tested for associations between measures of religiosity and ESKD risk. Descriptive statistics of percentages and median percentiles were used to calculate the demographic, clinical, psychosocial, and behavioral characteristics of participants in the full cohort as well as those who went on to develop ESKD. We combined participant responses to the two lowest categories of degree of comfort from religion (not very much, somewhat) and spirituality (not at all, slightly) due to the low response counts in each of these groups.
Spearman rank correlations were used to measure associations between each pair of religiosity measures and determine whether correlations were low between measures. Hazard ratios (HRs) and 95% confidence intervals (CI) for the association of each religiosity measure with ESKD risk were calculated from Cox multivariable regression models of time to ESKD. Participants were considered at risk from the date of SCCS enrollment until the first occurrence of incident ESKD, date of death, or March 31, 2015, whichever occurred first. For each religiosity measure, we constructed three Cox models (as was done in a previously published analysis of religiosity in the SCCS).15 Models were adjusted for covariates known to affect ESKD risk. Base models adjusted for age, sex (male, female), marital status (married, separated/divorced, widowed, never married), educational level (less than high school, high school, some college, college/graduate degree), insurance status (yes/no), and annual income (<$15,000, $15,000–$25,000, >$25,000). Psychosocial-behavioral models additionally included frequency of depressive symptoms (CESD-10 score), size of social network (number of close friends or relatives, number of friends to call in an emergency), and smoking status (current, former, never). Full models additionally adjusted for self-reported history of diagnosed diabetes (yes/no) or hypertension (yes/no), body mass index (BMI, calculated from self-reported weight and height), and eGFR. To allow for potential non-linear associations between numerical variables (age at enrollment, BMI, eGFR, number of close friends or relatives, number of friends to call in an emergency, frequency of depressive symptoms) and time to ESKD, these predictors were added to the model as restricted cubic splines with three knots. To examine interactions between race and religiosity on ESKD risk, multiplicative interaction terms between race and each religiosity measure were added to each model. We performed statistical analyses using R software and applied an alpha of .05 as our threshold for statistical significance.
Results
Characteristics of overall cohort.
Demographic, clinical, and psychosocial characteristics of the 76,443 cohort participants are shown in Table 1, stratified by race. Sixty-eight percent of participants in the cohort were Black, and approximately 60% were female. The median age of Black and White cohort participants was 50 and 53 years, respectively. Compared with White participants, a higher percentage of Black participants had an annual income below $15,000 (60% vs. 47%), had less than a high school education (32% vs. 24%), had no insurance (42% vs. 36%), had never been married (27% vs. 10%), had current or previous hypertension (57% vs. 49%) and were current smokers (43% vs. 38%). More White participants reported being currently married (48% vs. 29%). Black and White cohort participants were similar in terms of their prevalence of diabetes, BMI, baseline eGFR, frequency of depressive symptoms, and size of social network.
Table 1.
PARTICIPANT DEMOGRAPHIC, CLINICAL, PSYCHOSOCIAL, AND RELIGIOSITY CHARACTERISTICS BY RACE AT COHORT ENTRY
| Full cohort [N = 76,443] |
ESKD Cases within cohort [N = 1,565] |
|||
|---|---|---|---|---|
| % or Median (25th, 75th percentile) | Black [N = 52,353] | White [N = 24,090] | Black [N = 1,361] | White [N = 204] |
| Age | 50 [45, 56] | 53 [47, 60] | 53 [47, 59] | 56 [50, 60] |
| Male | 41% | 39% | 45% | 44% |
| Female | 59% | 61% | 56% | 56% |
| Marital status | ||||
| Married | 29% | 48% | 30% | 41% |
| Separated/divorced | 34% | 32% | 33% | 33% |
| Widowed | 10% | 10% | 13% | 17% |
| Never married | 27% | 10% | 24% | 9% |
| Highest education | ||||
| < High school | 32% | 24% | 37% | 35% |
| High school | 34% | 32% | 34% | 29% |
| Some college | 25% | 26% | 21% | 26% |
| > College | 10% | 19% | 7% | 10% |
| Insurance coverage | ||||
| No insurance | 42% | 36% | 35% | 36% |
| Has insurance | 58% | 64% | 65% | 64% |
| Annual income | ||||
| < $15,000 | 60% | 47% | 69% | 67% |
| > $15,000 < 25,000 | 22% | 19% | 20% | 16% |
| > $25,000 | 18% | 35% | 12% | 17% |
| Diabetes | 22% | 19% | 65% | 71% |
| Hypertension | 57% | 49% | 85% | 81% |
| BMI | 29 [25, 35] | 29 [25, 34] | 31 [26, 37] | 33 [26, 37] |
| eGFR (mL/min/1.73 m2) | 101 [80, 117] | 91 [76, 103] | 54 [31, 86] | 52 [29, 87] |
| CESD-10 Score | 8 [4, 12] | 8 [4, 13] | 8 [5, 12] | 9 [5, 15] |
| Close friends/relatives | 3 [2, 6] | 4 [2, 6] | 3 [2, 6] | 3 [2, 5] |
| Friends to call in emergency | 3 [1, 5] | 3 [1, 5] | 2 [1, 5] | 2 [1, 5] |
| Smoking status | ||||
| Current | 43% | 38% | 37% | 39% |
| Former | 20% | 29% | 25% | 32% |
| Never | 37% | 33% | 38% | 29% |
| Comfort from religion | ||||
| Not very much or | 7% | 23% | 7% | 25% |
| Somewhat | 18% | 24% | 21% | 26% |
| Quite a bit | 75% | 53% | 72% | 49% |
| A great deal | ||||
| Spirituality | ||||
| Not at all or Slightly | 10% | 15% | 13% | 15% |
| Fairly | 32% | 35% | 29% | 40% |
| Very | 58% | 49% | 58% | 45% |
| Service attendance | ||||
| Never | 9% | 28% | 10% | 37% |
| Major holidays | 5% | 8% | 5% | 5% |
| >4X/year but <1X/week | 31% | 24% | 30% | 22% |
| 1X/week | 28% | 21% | 30% | 18% |
| >1X/week | 26% | 19% | 25% | 18% |
Notes:
ESKD = end-stage kidney disease
BMI = body mass index
eGFR = estimated glomerular filtration rate
CESD10 = Center for Epidemiologic Studies Depression Scale-10
Spearman rank correlation coefficients showed low correlations between religiosity variables: degree of comfort from religion and frequency of service attendance (.17), spirituality and frequency service attendance (.14), degree of comfort from religion and spirituality (.25). As shown in Table 1, 75% of Black participants compared with 53% of White participants reported the highest degree of comfort from religion. Fifty-eight percent and 26% of Black participants reported very high spirituality and very frequent service attendance, compared with 49% and 19% of White participants, respectively.
Characteristics associated with religiosity.
Tables 2A and 2B show the distribution of demographic and clinical characteristics according to measures of religiosity separately for Black and White participants. Black participants who reported drawing the most comfort from religion, the greatest frequency of service attendance, and the highest degree of spirituality shared demographic and clinical characteristics. These individuals were more likely to be female, to have only attained a high school education, to have an annual income of under $15,000, to have insurance, to report current or prior hypertension but no diabetes, to report never having smoked tobacco, and to report the lowest CESD-10 scores. Black participants who reported drawing the greatest degree of comfort from religion or who reported the highest levels of spirituality were more likely to be separated or divorced. Black participants who reported the most frequent service attendance were more likely to be married.
Table 2A.
DEMOGRAPHIC AND CLINICAL CHARACTERISTICS OF BLACK PARTICIPANTS IN FULL COHORT BY MEASURE OF RELIGIOSITYa
| Comfort from religion | Spirituality | Service attendance | |||||||||||
|---|---|---|---|---|---|---|---|---|---|---|---|---|---|
| N = 52,353 % or Median (25th, 75th percentile) | Not very much (N = 671) | Somewhat (N = 2,982) | Quite a bit (N = 9,562) | A great deal (N = 39,100) | Not at all (N = 617) | Slightly (N = 4,870) | Fairly (N = 16,640) | Very (N = 30,108) | Never (N = 4,905) | Major Holidays (N = 2,547) | >4X/year but not every week (N = 16,394) | 1X/Week (N = 14,890) | >1X/Week (N = 4,595) |
| Age | 50 [45, 56] | 48 [44, 54] | 50 [44, 56] | 50 [45, 57] | 49 [43, 54] | 48 [44, 54] | 49 [44, 55] | 51 [45, 58] | 49 [44, 54] | 48 [43, 53] | 49 [44, 54] | 51 [45, 57] | 51 [46, 59] |
| Male | 67% | 59% | 51% | 37% | 60% | 55% | 46% | 36% | 59% | 60% | 45% | 37% | 32% |
| Female | 33% | 41% | 49% | 63% | 40% | 45% | 54% | 64% | 41% | 40% | 55% | 63% | 68% |
| Marital status | |||||||||||||
| Married | 23% | 23% | 25% | 30% | 22% | 23% | 27% | 31% | 21% | 24% | 26% | 30% | 35% |
| Separated/divorced | 33% | 34% | 35% | 34% | 33% | 34% | 35% | 34% | 34% | 33% | 36% | 34% | 32% |
| Widowed | 6% | 5% | 9% | 10% | 5% | 6% | 8% | 11% | 6% | 5% | 8% | 11% | 12% |
| Never married | 38% | 38% | 31% | 25% | 39% | 37% | 30% | 24% | 39% | 38% | 30% | 25% | 20% |
| Education | |||||||||||||
| < High school | 39% | 34% | 34% | 31% | 45% | 42% | 31% | 30% | 41% | 41% | 33% | 31% | 25% |
| High school | 31% | 38% | 36% | 33% | 32% | 37% | 36% | 33% | 34% | 35% | 36% | 34% | 32% |
| Some college | 18% | 21% | 23% | 26% | 16% | 16% | 25% | 26% | 19% | 19% | 24% | 24% | 29% |
| > College | 12% | 7% | 7% | 11% | 8% | 5% | 8% | 12% | 6% | 5% | 7% | 11% | 14% |
| Insurance | 57% | 52% | 54% | 60% | 55% | 52% | 55% | 61% | 52% | 48% | 54% | 62% | 64% |
| No insurance | 43% | 48% | 46% | 40% | 44% | 48% | 45% | 39% | 48% | 52% | 46% | 38% | 36% |
| Annual income | |||||||||||||
| < $15,000 | 66% | 66% | 63% | 58% | 69% | 70% | 59% | 57% | 70% | 70% | 63% | 57% | 51% |
| >$15,000<$25,000 | 15% | 20% | 22% | 22% | 17% | 19% | 23% | 22% | 18% | 19% | 22% | 23% | 24% |
| > $25,000 | 18% | 14% | 14% | 19% | 13% | 10% | 17% | 19% | 11% | 10% | 14% | 19% | 24% |
| Diabetes | 19% | 20% | 21% | 22% | 19% | 19% | 20% | 24% | 19% | 17% | 20% | 24% | 25% |
| No diabetes | 81% | 80% | 79% | 78% | 81% | 81% | 80% | 76% | 80% | 83% | 80% | 76% | 75% |
| Hypertension | 50% | 52% | 56% | 58% | 51% | 53% | 54% | 60% | 54% | 51% | 56% | 59% | 60% |
| No hypertension | 50% | 48% | 44% | 42% | 49% | 47% | 46% | 40% | 46% | 49% | 44% | 41% | 40% |
| BMI | 27 [24, 33] | 28 [24, 33] | 28 [24, 34] | 30 [25, 35] | 27 [23, 33] | 28 [24, 33] | 29 [25, 34] | 30 [26, 35] | 27 [23, 33] | 27 [24, 33] | 29 [24, 34] | 30 [25, 35] | 30 [26, 36] |
| eGFR | 115 | 104 | 101 | 100 | 90 | 104 | 106 | 98 | 105 | 105 | 101 | 100 | 99 |
| (mL/min/1.73 m2) | [97, 121] | [86, 119] | [81, 118] | [79, 117] | [67, 113] | [84, 119] | [83, 119] | [78, 115] | [85, 121] | [78, 119] | [81, 118] | [79, 116] | [78, 116] |
| CESD-10 Score | 10 [6, 15] | 10 [6, 14] | 9 [5, 13] | 7 [4, 12] | 9 [6, 15] | 10 [6, 14] | 8 [5, 13] | 7 [4, 12] | 10 [5, 14] | 9 [5, 13] | 8 [5, 13] | 8 [4, 12] | 7 [3, 11] |
| Close friends/relatives | 2 [1, 5] | 3 [1, 5] | 3 [2, 5] | 4 [2, 7] | 3 [1, 5] | 3 [1, 5] | 3 [2, 6] | 4 [2, 7] | 2 [1, 5] | 3 [1, 5] | 3 [2, 6] | 4 [2, 6] | 4 [2, 9] |
| Friends to call in emergency | 2 [1, 4] | 2 [1, 4] | 2 [1, 4] | 3 [1, 5] | 2 [1, 4] | 2 [1, 4] | 2 [1, 5] | 3 [1, 5] | 2 [1, 4] | 2 [1, 4] | 2 [1, 5] | 3 [1, 5] | 3 [2, 5] |
| Smoking status | |||||||||||||
| Current | 53% | 58% | 52% | 39% | 53% | 58% | 50% | 36% | 61% | 61% | 53% | 37% | 27% |
| Former | 18% | 15% | 18% | 21% | 17% | 15% | 17% | 22% | 16% | 15% | 17% | 20% | 26% |
| Never |
29% | 26% | 30% | 40% | 30% | 27% | 33% | 41% | 23% | 23% | 31% | 42% | 47% |
Notes:
BMI = body mass index
eGFR = estimated glomerular filtration rate
CESD10 = Center for Epidemiologic Studies Depression Scale-10
Table 2B.
DEMOGRAPHIC AND CLINICAL CHARACTERISTICS OF WHITE PARTICIPANTS IN FULL COHORT BY MEASURE OF RELIGIOSITYa
| Comfort from religion |
Spirituality |
Service attendance |
|||||||||||
|---|---|---|---|---|---|---|---|---|---|---|---|---|---|
| N = 24,090 % or Median (25th, 75th percentile) | Not very (N = 1,688) | Somewhat (N = 3,871) | Quite a bit (N = 5,686) | A great deal (N = 12,827) | Not at all (N = 910) | Slightly (N = 2,778) | Fairly (N = 8,483) | Very (N = 11,869) | Never (N = 6,658) | Major Holidays (N = 1,925) | >4X/year but not every week (N = 5,807) | 1X/Week (N = 5,085) | >1X/Week (N = 4,595) |
| Age | 54 [47, 60] | 51 [46, 59] | 52 [46, 59] | 54 [47, 61] | 53 [47, 59] | 52 [46, 59] | 52 [46, 59] | 54 [47, 61] | 52 [47, 59] | 50 [45, 57] | 51 [46, 59] | 54 [47, 62] | 56 [48, 63] |
| Male | 63% | 48% | 42% | 31% | 62% | 50% | 41% | 32% | 42% | 41% | 36% | 38% | 36% |
| Female | 37% | 52% | 58% | 69% | 38% | 50% | 59% | 68% | 58% | 59% | 64% | 62% | 64% |
| Marital status | |||||||||||||
| Married | 50% | 45% | 45% | 50% | 48% | 44% | 48% | 49% | 44% | 44% | 43% | 51% | 55% |
| Separated/divorced | 30% | 35% | 34% | 30% | 31% | 34% | 32% | 31% | 35% | 35% | 36% | 28% | 24% |
| Widowed | 5% | 6% | 9% | 11% | 5% | 7% | 8% | 11% | 8% | 7% | 9% | 10% | 12% |
| Never married | 12% | 13% | 11% | 8% | 14% | 13% | 11% | 9% | 12% | 13% | 10% | 9% | 7% |
| Education | |||||||||||||
| < High school | 18% | 25% | 25% | 24% | 23% | 30% | 23% | 23% | 29% | 24% | 24% | 20% | 20% |
| High school | 23% | 32% | 33% | 32% | 24% | 33% | 33% | 31% | 33% | 30% | 32% | 30% | 31% |
| Some college | 25% | 25% | 25% | 27% | 21% | 21% | 26% | 27% | 23% | 27% | 27% | 26% | 28% |
| > College | 35% | 19% | 17% | 18% | 32% | 17% | 19% | 19% | 15% | 19% | 17% | 24% | 22% |
| Insurance | 66% | 60% | 61% | 66% | 65% | 59% | 63% | 66% | 60% | 60% | 59% | 71% | 71% |
| No insurance | 34% | 40% | 39% | 34% | 35% | 41% | 37% | 34% | 40% | 40% | 41% | 29% | 29% |
| Annual income | |||||||||||||
| < $15,000 | 35% | 46% | 49% | 46% | 39% | 48% | 45% | 47% | 51% | 47% | 50% | 40% | 40% |
| >$15,000<$25,000 | 15% | 19% | 18% | 19% | 17% | 18% | 19% | 18% | 18% | 19% | 19% | 17% | 18% |
| > $25,000 | 49% | 34% | 32% | 33% | 43% | 33% | 35% | 33% | 29% | 33% | 30% | 41% | 40% |
| Diabetes | 17% | 19% | 19% | 20% | 18% | 19% | 18% | 20% | 20% | 18% | 18% | 19% | 20% |
| No diabetes | 83% | 81% | 81% | 80% | 82% | 81% | 82% | 80% | 80% | 82% | 82% | 81% | 80% |
| Hypertension | 45% | 48% | 49% | 49% | 45% | 49% | 48% | 50% | 51% | 46% | 48% | 47% | 49% |
| No hypertension | 55% | 52% | 50% | 51% | 55% | 51% | 52% | 50% | 49% | 53% | 52% | 53% | 51% |
| BMI | 27 [24, 32] | 28 [24, 33] | 28 [24, 34] | 29 [25, 34] | 28 [24, 33] | 28 [24, 33] | 28 [25, 34] | 29 [25, 34] | 29 [25, 34] | 28 [24, 34] | 28 [24, 34] | 28 [25, 33] | 29 [25, 34] |
| eGFR | 92 | 94 | 92 | 90 | 92 | 94 | 92 | 90 | 92 | 96 | 93 | 90 | 88 |
| (mL/min/1.73 m2) | [83, 104] | [78, 105] | [76, 103] | [75, 102] | [77, 102] | [77, 106] | [76, 104] | [76, 101] | [77, 102] | [82, 105] | [78, 103] | [74, 103] | [70, 101] |
| CESD-10 Score | 7 [4, 14] | 9 [5, 15] | 8 [4, 13] | 7 [4, 12] | 7 [4, 14] | 9 [5, 15] | 8 [4, 13] | 7 [4, 13] | 9 [5, 15] | 9 [5, 14] | 8 [5, 14] | 7 [3, 12] | 6 [3, 11] |
| Close friends/relatives | 3 [1, 5] | 3 [1, 5] | 3 [2, 6] | 4 [2, 8] | 3 [1, 5] | 3 [1, 5] | 4 [2, 6] | 4 [2, 8] | 3 [1, 5] | 3 [2, 6] | 4 [2, 6] | 4 [2, 8] | 5 [3, 10] |
| Friends to call in emergency | 2 [1, 5] | 2 [1, 4] | 2 [1, 5] | 3 [2, 6] | 2 [1, 5] | 2 [1, 4] | 3 [1, 5] | 3 [2, 5] | 2 [1, 4] | 2 [1, 5] | 2 [1, 5] | 3 [2, 5] | 4 [2, 7] |
| Smoking status | |||||||||||||
| Current | 39% | 45% | 43% | 33% | 40% | 47% | 42% | 33% | 48% | 46% | 44% | 30% | 20% |
| Former | 31% | 27% | 27% | 29% | 30% | 27% | 27% | 29% | 27% | 25% | 25% | 30% | 33% |
| Never |
29% | 26% | 30% | 37% | 29% | 26% | 30% | 37% | 24% | 28% | 30% | 40% | 46% |
Notes:
BMI = body mass index,
eGFR = estimated glomerular filtration rate
CESD10 = Center for Epidemiologic Studies Depression Scale-10
White participants who reported the highest degree of comfort from religion, the greatest frequency of service attendance, and the highest level of spirituality were more frequently female, married, had attained a high school education, had insurance, reported an annual income under $15,000, denied having diabetes or hypertension, and had never smoked tobacco. White participants with the most frequent service attendance had the lowest median CESD-10 scores and reported the greatest number of close friends or relatives. Black and White participants who were current smokers were more likely to also report low spirituality or not ever attending religious services.
Associations between religiosity and ESKD risk within and between racial groups.
Comfort from religion did not significantly associate with ESKD risk among either Black participants or White participants. Among Black participants, HRs and 95% CIs for ESKD risk associated with the highest vs. lowest degrees of comfort from religion were .90 (.73–1.11) in our base model, .91 (.74–1.13) with the addition of psychosocial and behavioral covariates, and .92 (.70–1.21) in the fully adjusted model. Corresponding estimates among White participants were .77 (.55–1.07), .76 (.55–1.07), and .84 (.58–1.21). (Figure 1).
Figure 1.
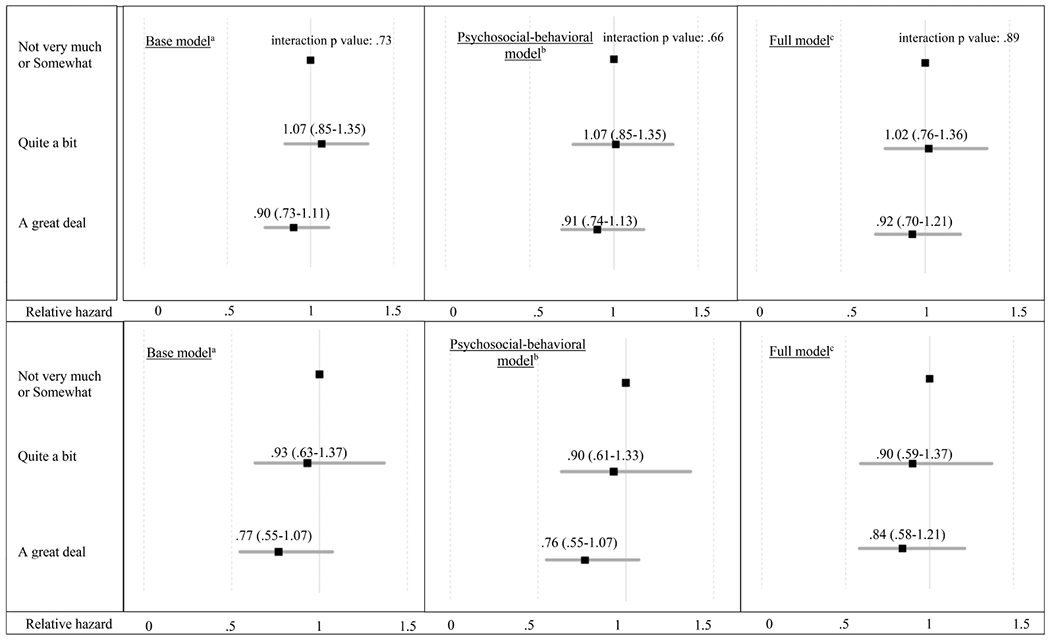
Hazard ratios with 95% confidence intervals for the association between degree of comfort from religion and end-stage kidney disease risk among Black (top) and White (bottom) participants.
Notes:
aBase model of demographics: adjusted for age, gender, race, education, income, marital status, insurance status.
bPsychosocial-behavioral model: adjusted for covariates in base model + frequency of depressive symptoms, size of social network, smoking status.
cFull model: adjusted for covariates in psychosocial model + body mass index, diabetes, hypertension, estimated glomerular filtration rate.
Service attendance did not significantly associate with ESKD risk among Black participants; HRs and 95% CIs among Black participants who reported the highest vs. lowest frequency of service attendance were .92 (.75–1.12) in the base model, .90 (.73–1.11) in the psychosocial model, and .92 (.70–1.20) in the fully adjusted model. Corresponding estimates among White participants were .67 (.45–1.00), .67 (.45–1.00), and .80 (.52–1.24) (Figure 2), suggesting an inverse association with higher service attendance, albeit not statistically significant.
Figure 2.
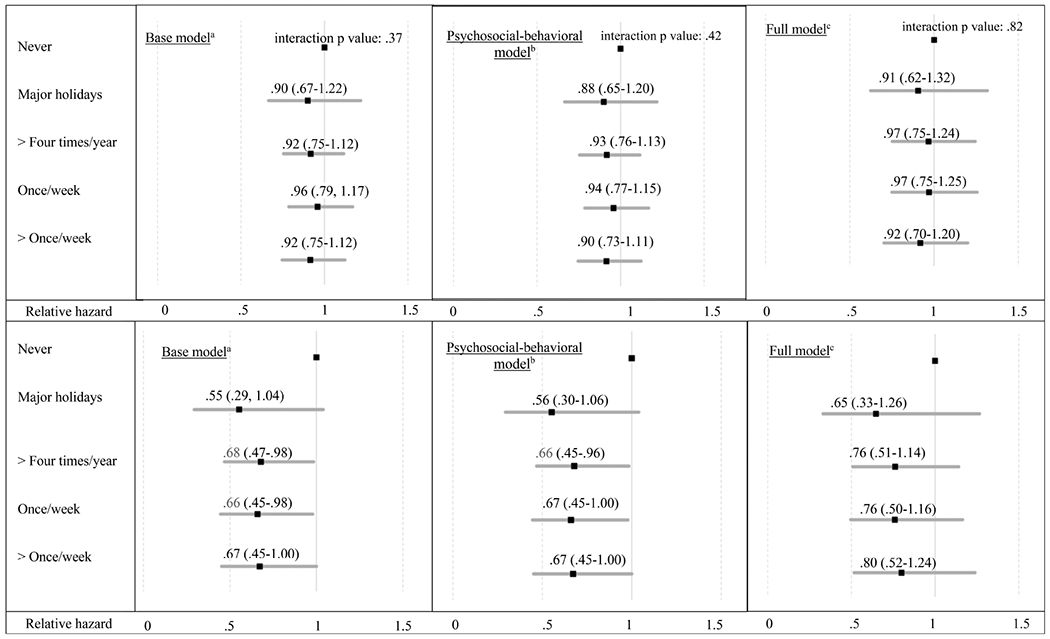
Hazard ratios with 95% confidence intervals for the association between frequency of service attendance and end-stage kidney disease risk among Black (top) and White (bottom) participants.
Notes
aBase model of demographics: adjusted for age, gender, race, education, income, marital status, insurance status
bPsychosocial behavioral model: adjusted for covariates in base model + frequency of depressive symptoms, size of social network, smoking status
cFull model: adjusted for covariates in psychosocial model + body mass index, diabetes, hypertension, estimated glomerular filtration rate
Spirituality significantly associated with decreased ESKD risk among Black participants. Hazard ratios and 95% CIs for ESKD risk associated with the highest vs. lowest degree of spirituality among Black participants were .82 (.69–.98) in the base model, .81 (.68–.96) with the addition of psychosocial-behavioral covariates, and .85 (.68–1.06) in the full model. Among White participants, the associations were not statistically significant, with corresponding estimates of .87 (.58–1.31), .87 (.58–1.30), and .94 (.61–1.46) (Figure 3).
Figure 3:
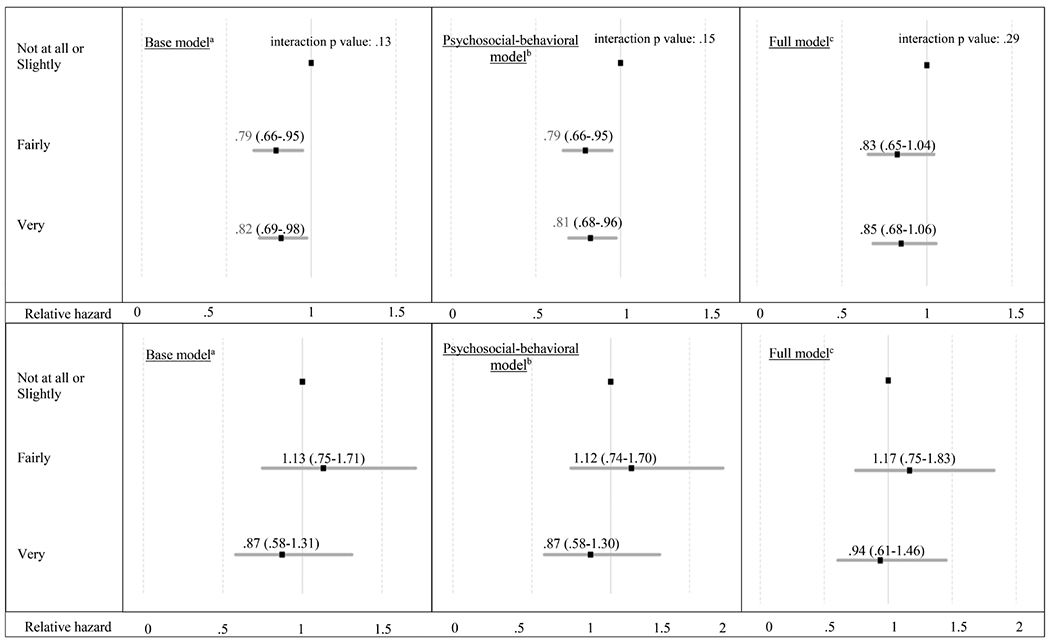
Hazard ratios with 95% confidence intervals for the association between degree of spirituality and end-stage kidney disease risk among Black (top) and White (bottom) participants.
Notes
aBase model of demographics: adjusted for age, gender, race, education, income, marital status, insurance status
bPsychosocial behavioral model: adjusted for covariates in base model + frequency of depressive symptoms, size of social network, smoking status
cFull model: adjusted for covariates in psychosocial model + body mass index, diabetes, hypertension, estimated glomerular filtration rate
No statistically significant effect modification by race was observed in any model for any of the three religiosity variables (Figures 1–3).
Discussion
We tested for associations between religiosity (measured by self-report of spiritualty, degree of comfort from religion, and frequency of religious service attendance) and risk of ESKD in a large cohort of Black and White adults of low socioeconomic status. As conceptual frameworks of religion, spirituality, and health outcomes implicate psychosocial and behavioral factors in the causal pathway between religiosity and chronic disease incidence, we added depressive symptoms, social support, and frequency of tobacco use to our models. High spirituality was associated with a statistically significant 20% decrease in ESKD risk among Black but not White adults. This association remained significant after adjusting for psychosocial and behavioral covariates. When clinical risk factors for ESKD were added to the model, these associations lost statistical significance, suggesting that clinical covariates may more accurately predict risk of ESKD than spirituality. Frequent service attendance may still be clinically meaningful in terms of ESKD risk among White participants, but as effect modification by race failed to reach statistical significance for any religiosity measure, our results do not support that religiosity differentially affected ESKD risk by race.
Spirituality, which might be defined as a belief in a higher power or a search for greater meaning in life, is distinct from religion, which refers to the organized beliefs and practices of a specific faith.3 Both religion and spirituality are theorized to improve health outcomes by providing a source of community support, a means to cope through trauma, a narrative framework for personal meaning-making, and an impetus for healthy lifestyle behaviors.5 While some evidence suggests that certain individuals who emphasize religious beliefs and behaviors may paradoxically feel less inclined to actively engage in the management of their health, high levels of spirituality have consistently been associated with improved health outcomes in chronic disease.16 Black participants in our cohort who reported the highest levels of spirituality had a small but statistically significant decrease in ESKD risk after adjusting for demographic, psychosocial, and behavioral covariates. Spirituality has similarly been associated with improved health outcomes among individuals of low socioeconomic status and among those who self-identify as underrepresented minorities.4,6,17 In a longitudinal study of 177 individuals with human immunodeficiency virus (36% Black), greater spirituality was associated with improved survival at 17-year follow-up, even after controlling for demographic characteristics, health behaviors, and viral load.18 Though associations between high degree of spirituality and ESKD risk did not reach statistical significance among White participants in our cohort, effect sizes were similar to those observed among Black participants, and we may not have had an adequate sample size of White participants in our cohort to reach statistical significance.
When clinical covariates were added to the model, associations between spirituality and ESKD risk lost statistical significance among Black participants. This finding lends empirical support to the view that hypertension, diabetes, BMI, eGFR, and other unmeasured covariates predict risk of ESKD more accurately than does spirituality. Clinical variables such as proteinuria, hypertension, and diabetes are associated with a significantly increased risk of ESKD, and spirituality is unlikely to exert an effect of this magnitude on ESKD risk independent of its potential direct and indirect role in degree of proteinuria, and control of hypertension and diabetes.19 Other analyses that assess effects of spirituality or measures of psychological stress report effect sizes on health outcomes similar to the one from our study. In an analysis of 10,000 patients receiving hemodialysis, a five-point decrease in mental health-related quality of life scores was associated with a 33% increase in mortality.20 As spirituality has been shown to decrease psychosocial stress, a hazard ratio .81 of the association between spirituality and reduction in ESKD risk may still be clinically meaningful. Additionally, as our cohort contained many individuals with a normal eGFR at enrollment and a smaller percentage who went onto develop ESKD, our study may have been underpowered to detect a similar effect size of spirituality on ESKD risk.
Plausible mechanisms exist by which spirituality may improve survival in chronic disease. Practices that incorporate central components of spirituality (such as meditation and mindfulness) have been shown to associate with improved lipid profiles and lower cortisol levels.21 As inflammatory markers such as C-reactive protein inversely correlate with eGFR in CKD and independently associate with mortality in ESKD, attenuating inflammation may improve health outcomes in this patient group.22–23 Spirituality also associates with favorable disease management behaviors, such as decreased tobacco use and healthier eating habits.24–25 More participants in our cohort who self-reported the highest degrees of spirituality also reported never having smoked tobacco. Thus, interventions that incorporate aspects of spirituality may improve health outcomes in and risks for ESKD by attenuating inflammation or facilitating healthy lifestyle behaviors.
Participants in our cohort who expressed high degrees of drawing comfort from religion (religious coping) or frequent service attendance did not demonstrate statistically significant reductions in ESKD risk. These results are in contrast with previously demonstrated survival benefits associated with religious coping and frequent service attendance among Black individuals. In the only other analysis of religious coping and mortality in an observational cohort, drawing comfort from religion independently associated with a reduction in all-cause mortality (HR .89, 95% CI: .82–.98) after controlling for demographic, socioeconomic, and clinical variables.25 In the Black Women’s Health Study, an eight-year longitudinal cohort, attending religious services several times per week associated with a lower mortality rate ratio (.64, 95% CI: .51–.80), even after adjusting for demographic and clinical covariates.26 Additionally, a recent analysis among participants in the SCCS found a reduction in all-cause and cancer-related mortality among individuals who attended service more than once per week compared with those who never attended, even after adjustments were made for demographic and clinical variables (HR .76, 95% CI: .71–.81).15 The discrepancy between our results and what is demonstrated in the literature may be a result of the fact that these cohorts had larger percentages of women, a group known to emphasize religiosity, and because ESKD may not be on the causal pathway between religiosity and mortality.
National polls reveal that individuals who are female, self-identify as Black, are older than 65, are widowed, attain no more than a high school education, and earn under $30,000 per year more frequently turn to religion to cope with stress, more frequently attend religious services, and report higher levels of spirituality than do their counterparts.8 Religiosity in individuals belonging to these demographic groups is thought to be a sequelae of numerous factors: cultural upbringing among those who self-identify as Black, predispositions toward risk-averse behavior among women, a tendency to turn to religion to cope with multimorbidity among older adults, and the need to mitigate the stressors of poverty among resource-poor individuals.9,27–30 Black and White participants in our cohort had numerous shared characteristics known to be associated with high levels of religiosity, and this may explain why effect modification of religiosity by race did not reach statistical significance in our model.
Our study has important limitations. Religiosity is a multi-dimensional, individualized construct, and three-item, quantitative measures collected only at baseline may not capture the full spectrum of its complexity. The low socioeconomic status and geographic location of participants may preclude the generalizability of our results to a more nationally representative sample. As measures of medication or diet adherence were not measured, we do not know if effects of religiosity on ESKD risk were attenuated by specific kidney disease self-management behaviors. The SCCS did not ask participants to specify their religious denomination, though religious affiliation correlates poorly with degree of religiosity.31 Participants in our cohort may have had other unmeasured comorbidities that predispose them to emphasize religion or spiritualty. Many of the observed effect sizes in our study were similar between Black and White participants, albeit not statistically significant among White participants, and no statistically significant effect modification by race was observed. Given the smaller percentage of White participants in this cohort, our study may have been underpowered to detect any statistically significant differences in religiosity on ESKD risk by race.
Person-centered chronic disease care not only requires consideration of demographic characteristics and comorbidities but also asks providers to assess patients’ cultural beliefs and practices. The Joint Commission on Accreditation of Healthcare Organizations requires that patients’ spiritual beliefs and needs be incorporated into the medical record, regardless of patients’ self-identified race or socioeconomic status. Additionally, emerging evidence shows that patients, including those with or at risk for ESKD, desire to have their spiritual needs assessed and addressed.32–43 Mind-body interventions and cognitive-behavioral therapies rooted in the principles of spirituality decrease psychological stress and encourage healthy behaviors in other chronic illnesses.44–45 Additional rigorous analyses and future research may support the development of similar interventions for patients at risk for ESKD.
Acknowledgments
The authors would like to acknowledge the patient participants of the Southern Community Cohort study
Funding
National Institute of Diabetes and Digestive and Kidney Diseases (NIDDK)
5T32DK007569-30 to DN
R01DK103935 to KC and KW
NIDDK 1P30DK114809 to Vanderbilt O’Brien Kidney Center
National Cancer Institute R01CA092447, American Recovery and Reinvestment Act
3R01CA092447-08S1
The Southern Community Cohort Study (SCCS) is funded by grant U01CA202979 from the National Cancer Institute. SCCS data collection was performed by the Survey and Biospecimen Shared Resource which is supported in part by the Vanderbilt-Ingram Cancer Center (P30CA68485).
Footnotes
Results from this work were presented at the American Society of Nephrology conference in 2018
All the authors have declared no competing interests.
References
- 1.Oxford English and Spanish Dictionary. Religious. United Kingdom: Oxford English and Spanish Dictionary; (online), 2020. Available at: https://en.oxforddictionaries.com/definition/religious. [Google Scholar]
- 2.Feinstein M, Liu K, Ning H, et al. Burden of cardiovascular risk factors, subclinical atherosclerosis, and incident cardiovascular events across dimensions of religiosity: the multi-ethnic study of atherosclerosis. Circulation. 2010. February 9;121(5):659–66. Epub 2010 Jan 25. 10.1161/CIRCULATIONAHA.109.879973 [DOI] [PMC free article] [PubMed] [Google Scholar]
- 3.Koenig HG. Religion, spirituality, and medicine: how are they related and what does it mean? Mayo Clin Proc. 2001. December;76(12):1189–91. 10.4065/76.12.1189 [DOI] [PubMed] [Google Scholar]
- 4.Hemmati R, Bidel Z, Nazarzadeh M, et al. Religion, spirituality, and risk of coronary heart disease: a matched case-control study and meta-analysis. J Relig Health. 2019. August;58(4):1203–16. 10.1007/s10943-018-0722-z [DOI] [PubMed] [Google Scholar]
- 5.Seeman TE, Dubin LF, Seeman M. Religiosity/spirituality and health. A critical review of the evidence for biological pathways. Am Psychol. 2003. January;58(1):53–63. 10.1037/0003-066X.58.1.53 [DOI] [PubMed] [Google Scholar]
- 6.Clark EM, Williams BR, Huang J, et al. A longitudinal study of religiosity, spiritual health locus of control, and health behaviors in a national sample of African Americans. J Relig Health. 2018. December;57(6):2258–78. 10.1007/s10943-017-0548-0 [DOI] [PMC free article] [PubMed] [Google Scholar]
- 7.Holt CL, Clark EM, Debnam KJ, et al. Religion and health in African Americans: the role of religious coping. Am J Health Behav. 2014. March;38(2):190–9. 10.5993/AJHB.38.2.4 [DOI] [PMC free article] [PubMed] [Google Scholar]
- 8.Pew Research Center. Religious landscape study. Washington, DC: Pew Research Center, 2020. Available at: http://www.pewforum.org/religious-landscape-study/. [Google Scholar]
- 9.Rostand SG, Kirk KA, Rutsky EA, et al. Racial differences in the incidence of treatment for end-stage renal disease. N Engl J Med. 1982. May 27;306(21):1276–9. 10.1056/NEJM198205273062106 [DOI] [PubMed] [Google Scholar]
- 10.Norris K, Nissenson AR. Race, gender, and socioeconomic disparities in CKD in the United States. J Am Soc Nephrol. 2008. July;19(7):1261–70. Epub 2008 Jun 4. 10.1681/ASN.2008030276 [DOI] [PubMed] [Google Scholar]
- 11.Tarver-Carr ME, Powe NR, Eberhardt MS, et al. Excess risk of chronic kidney disease among African-American versus White subjects in the United States: a population-based study of potential explanatory factors. J Am Soc Nephrol. 2002. September;13(9):2363–70. 10.1097/01.ASN.0000026493.18542.6A [DOI] [PubMed] [Google Scholar]
- 12.Signorello LB, Hargreaves MK, Blot WJ. The Southern Community Cohort Study: investigating health disparities. J Health Care Poor Underserved. 2010. February;21(1 Suppl):26–37. 10.1353/hpu.0.0245 [DOI] [PMC free article] [PubMed] [Google Scholar]
- 13.Koenig H, Bussing A. The Duke University Religion Index (DUREL): a five-item measure for use in epidemiological studies. Religions. 2010. December;1(1):78–85. 10.3390/rel1010078 [DOI] [Google Scholar]
- 14.Andresen EM, Malmgren JA, Carter WB, et al. Screening for depression in well older adults: evaluation of a short form of the CES-D (Center for Epidemiologic Studies Depression Scale). Am J Prev Med. 1994. Mar-Apr;10(2):77–84. 10.1016/S0749-3797(18)30622-6 [DOI] [PubMed] [Google Scholar]
- 15.Wen W, Schlundt D, Andersen SW, et al. Does religious involvement affect mortality in low-income Americans? BMJ Open. 2019. July 9;9(7):e028200 10.1136/bmjopen-2018-028200 [DOI] [PMC free article] [PubMed] [Google Scholar]
- 16.Gullatte MM, Brawley O, Kinney A, et al. Religiosity, spirituality, and cancer fatalism beliefs on delay in breast cancer diagnosis in African American women. J Relig Health. 2010. March;49(1):62–72. Epub 2009 Jan 30. 10.1007/s10943-008-9232-8 [DOI] [PubMed] [Google Scholar]
- 17.Ironson G, Kremer H. Spiritual transformation, psychological well-being, health, and survival in people with HIV. Int J Psychiatry Med. 2009;39(3):263–81. 10.2190/PM.39.3.d [DOI] [PubMed] [Google Scholar]
- 18.Ironson G, Kremer H, Lucette A. Relationship between spiritual coping and survival in patients with HIV. J Gen Intern Med. 2016. September;31(9):1068–76. Epub 2016 May 5. 10.1007/s11606-016-3668-4 [DOI] [PMC free article] [PubMed] [Google Scholar]
- 19.Hsu CY, Iribarren C, McCulloch CE, et al. Risk factors for end-stage renal disease: 25-year follow-up. Arch Int Med. 2009. February 23;169(4):342–50. 10.1001/archinternmed.2008.605 [DOI] [PMC free article] [PubMed] [Google Scholar]
- 20.Liebman S, Li NC, Lacson E. Change in quality of life and one-year mortality risk in maintenance dialysis patients. Qual Life Res. 2016. September;25(9):2295–306. Epub 2016 Mar 3. 10.1007/s11136-016-1257-y [DOI] [PubMed] [Google Scholar]
- 21.Holt-Lunstad J, Steffen PR, Sandberg J, et al. Understanding the connection between spiritual well-being and physical health: an examination of ambulatory blood pressure, inflammation, blood lipids, and fasting glucose. J Behav Med. 2011. December;34(6):477–88. Epub 2011 Apr 13. 10.1007/s10865-011-9343-7 [DOI] [PubMed] [Google Scholar]
- 22.Razeghi E, Parkhideh S, Ahmadi F, et al. Serum CRP levels in pre-dialysis patients. Ren Fail. 2008;30(2):193–8. 10.1080/08860220701810539 [DOI] [PubMed] [Google Scholar]
- 23.Korevaar JC, van Manen JG, Dekker FW, et al. Effect of an increase in C-reactive protein level during a hemodialysis session on mortality. J Am Soc Nephrol. 2004. November;15(11):2916–22. 10.1097/01.ASN.0000143744.72664.66 [DOI] [PubMed] [Google Scholar]
- 24.Swierad EM, Vartanian LR, King M. The influence of ethnic and mainstream cultures on African Americans’ health behaviors: a qualitative study. Behav Sci (Basel). 2017. August 4;7(3):49 10.3390/bs7030049 [DOI] [PMC free article] [PubMed] [Google Scholar]
- 25.Bailey ZD, Slopen N, Albert M, et al. Multidimensional religious involvement and tobacco smoking patterns over 9–10 years: a prospective study of middle-aged adults in the United States. Soc Sci Med. 2015. August;138:128–35. Epub 2015 Jun 10. 10.1016/j.socscimed.2015.06.006 [DOI] [PMC free article] [PubMed] [Google Scholar]
- 26.Schnall E, Wassertheil-Smoller S, Swencionis C, et al. The relationship between religion and cardiovascular outcomes and all-cause mortality in the Women’s Health Initiative Observational Study. Psychol Health. 2010. February;25(2):249–63. 10.1080/08870440802311322 [DOI] [PubMed] [Google Scholar]
- 27.VanderWeele TJ, Yu J, Cozier YC, et al. Attendance at religious services, prayer, religious coping, and religious/spiritual identity as predictors of all-cause mortality in the Black Women’s Health Study. Am J Epidemiol. 2017. April 1;185(7):515–22. 10.1093/aje/kww179 [DOI] [PMC free article] [PubMed] [Google Scholar]
- 28.Schnabel L More religious, less dogmatic: toward a general framework for gender differences in religion. Soc Sci Res. 2018. September;75:58–72. Epub 2018 Jun 26. 10.1016/j.ssresearch.2018.06.010 [DOI] [PubMed] [Google Scholar]
- 29.Gomez Palencia IP, Cantillo Banquett D, Quintana Coronado M, et al. Spirituality and religiosity in elderly adults with chronic disease. Invest Educ Enferm. 2016. June;34(2):235–42. 10.17533/udea.iee.v34n2a02 [DOI] [PubMed] [Google Scholar]
- 30.Joshi P, Hardy E, Hawkins S. Role of religiosity in the lives of the low-income population: a comprehensive review of the evidence. Research Triangle Park, NC: RTI International, 2009. Available at: https://aspe.hhs.gov/system/files/pdf/75821/report.pdf. [Google Scholar]
- 31.O’Reilly D, Rosato M. Religion and the risk of suicide: longitudinal study of over 1 million people. Br J Psychiatry. 2015. June;206(6):466–70. Epub 2015 Feb 19. 10.1192/bjp.bp.113.128694 [DOI] [PubMed] [Google Scholar]
- 32.Spinale J, Cohen SD, Khetpal P, et al. Spirituality, social support, and survival in hemodialysis patients. Clin J Am Soc Nephrol. 2008. November;3(6):1620–7. Epub 2008 Oct 15. 10.2215/CJN.01790408 [DOI] [PMC free article] [PubMed] [Google Scholar]
- 33.Thomas CJ, Washington TA. Religiosity and social support: implications for the health-related quality of life of African American hemodialysis patients. J Relig Health. 2012. December;51(4):1375–85. 10.1007/s10943-011-9483-7 [DOI] [PubMed] [Google Scholar]
- 34.VanderWeele TJ, Balboni TA, Koh HK. Health and spirituality. JAMA. 2017. August 8;8;318(6):519–20. 10.1001/jama.2017.8136 [DOI] [PubMed] [Google Scholar]
- 35.VanderWeele TJ, Jackson JW, Li S. Causal inference and longitudinal data: a case study of religion and mental health. Soc Psychiatry Psychiatr Epidemiol. 2016. November;51(11):1457–66. Epub 2016 Sep 8. 10.1007/s00127-016-1281-9 [DOI] [PubMed] [Google Scholar]
- 36.Hodge DR. A template for spiritual assessment: a review of JAHCO requirements and guidelines for implementation. Soc Work. 2006. October;51(4):317–26. 10.1093/sw/51.4.317 [DOI] [PubMed] [Google Scholar]
- 37.Patel SS, Shah VS, Peterson RA, et al. Psychosocial variables, quality of life, and religious beliefs in ESRD patients treated with hemodialysis. Am J Kidney Dis. 2002. November;40(5):1013–22. 10.1053/ajkd.2002.36336 [DOI] [PubMed] [Google Scholar]
- 38.Davison SN, Jhangri GS. Existential and supportive care needs among patients with chronic kidney disease. J Pain Sympto Manage. 2010. December;40(6):838–43. Epub 2010 Aug 24. 10.1016/j.jpainsymman.2010.03.015 [DOI] [PubMed] [Google Scholar]
- 39.Santo PR, Capote JRFG Junior, Cavalcante Filho JRM, et al. Religious coping methods predict depression and quality of life among end-stage renal disease patients undergoing hemodialysis: a cross-sectional study. BMC Nephrol. 2017. June 17;18(1):197 10.1186/s12882-017-0619-1 [DOI] [PMC free article] [PubMed] [Google Scholar]
- 40.Cervantes L, Jones J, Linas S, et al. Qualitative interviews exploring palliative care perspectives of Latinos on dialysis. Clin J Am Soc Nephrol. 2017. May 8;12(5):788–98. Epub 2017 Apr 12. 10.2215/CJN.10260916 [DOI] [PMC free article] [PubMed] [Google Scholar]
- 41.Jim HSL, Pustejovsky JE, Park CL, et al. Religion, spirituality, and physical health in cancer patients: a meta-analysis. Cancer. 2015. November 1;121(21):3760–8. Epub 2015 Aug 10. 10.1002/cncr.29353 [DOI] [PMC free article] [PubMed] [Google Scholar]
- 42.Elliott BA, Gessert CE, Larson P, et al. Religious beliefs and practices in end-stage renal disease: implications for clinicians. J Pain Symptom Manage. 2012. September;44(3):400–9. Epub 2012 Jul 3. 10.1016/j.jpainsymman.2011.09.019 [DOI] [PubMed] [Google Scholar]
- 43.Bragazzi NL, Del Puente G. Chronic kidney disease, spirituality and religiosity: a systematic overview with the list of eligible studies. Health Psychol Res. 2013. April 7;1(2):e26 10.4081/hpr.2013.733 [DOI] [PMC free article] [PubMed] [Google Scholar]
- 44.Rosenkranz MA, Esnault S, Christian BT, et al. Mind-body interactions in the regulation of airway inflammation in asthma: a PET study of acute and chronic stress. Brain Behav Immun. 2016. November;58:18–30. Epub 2016 Mar 30. [DOI] [PMC free article] [PubMed] [Google Scholar]
- 45.Handley MA, Quan J, Chao MT, et al. Use of complementary health approaches among diverse primary care patients with Type 2 Diabetes and association with cardiometabolic outcomes: from the SF Bay Collaborative Research Network (SF Bay CRN). J Am Board Fam Med. 2017. Sep-Oct;30(5):624–31. 10.3122/jabfm.2017.05.170030 [DOI] [PubMed] [Google Scholar]