

Abstract
Background
Utilization of primary-care and specialist physicians seems to be associated differently with socioeconomic status (SES). This review aims to summarize and compare the evidence on socioeconomic inequalities in consulting primary-care or specialist physicians in the general adult population in high-income countries.
Methods
We carried out a systematic search across the most relevant databases (Web of Science, Medline) and included all studies, published since 2004, reporting associations between SES and utilization of primary-care and/or specialist physicians. In total, 57 studies fulfilled the eligibility criteria.
Results
Many studies found socioeconomic inequalities in physician utilization, but inequalities were more pronounced in visiting specialists than primary-care physicians. The results of the studies varied strongly according to the operationalization of utilization, namely whether a physician was visited (probability) or how often a physician was visited (frequency). For probabilities of visiting primary-care physicians predominantly no association with SES was found, but frequencies of visits were higher in the most disadvantaged. The most disadvantaged often had lower probabilities of visiting specialists, but in many studies no link was found between the number of visits and SES.
Conclusion
This systematic review emphasizes that inequalities to the detriment of the most deprived is primarily a problem in the probability of visiting specialist physicians. Healthcare policy should focus first off on effective access to specialist physicians in order to tackle inequalities in healthcare.
PROSPERO registration number
Supplementary Information
The online version contains supplementary material available at 10.1186/s12939-020-01375-1.
Keywords: Social inequalities, Socioeconomic Status, Primary health care, Access to health care
Background
Health inequalities, precisely inverse associations between socioeconomic status (SES) and morbidity and mortality, are well analysed and described [1]. Further, numerous studies prove evidence for vertical inequalities in utilization of healthcare according to education, income and occupation, which represent SES. In order to shed more light on the role of healthcare in explaining health inequalities, it is crucial to examine socio-economic inequalities in the utilization of treatment in a more differentiated way. It has been shown that socioeconomic inequalities in healthcare are present in both universal and non-universal healthcare system, and existence does not depend on the type and financing of health systems [2–4]. Distinctions were more likely to be found according to the different dimensions of healthcare for which inequalities are analysed. So far, international evidence on socioeconomic inequalities in treatment was mainly summarized on disease-specific, or country-specific basis and indicate that lower SES is associated with poor diabetes management, lower achievement of glycaemic control targets, and reduced visits of diabetes clinics and ambulatory care facilities for treatment of diabetes [3, 5]. In cancer patients, lower SES is associated with receiving less often (neo) adjuvant therapy for colorectal cancer, [6] and with receiving less often any treatment, surgery and chemotherapy for lung cancer [2]. In coronary heart disease patients SES was often associated with lower access to coronary procedures [4]. Nevertheless, SES was only partly associated with receiving radiotherapy and chemotherapy in colorectal cancer patients, [6] or with access to drug treatment and cardiac rehabilitation in coronary heart disease patients, [4] and not associated with radiotherapy for lung cancer [2]. In contrast, in diabetes patients, it was found that lower SES was associated with more visits to a diabetologist, and more often GP consultations [3]. For Germany it was summarized that higher status groups presented higher utilization in terms of specialist consultations and prevention services [7]. It should be noted, however, that systematic reviews often summarize studies that use different operationalisations of SES and healthcare utilization, and may therefore be difficult to compare.
In order to tackle inequalities in utilization of healthcare, we need to gain a better understanding of healthcare inequalities. More detailed evidence is needed in which domains of healthcare and indicators of utilisation and SES are specified [8]. Despite disease- and country-specific systematic reviews on socioeconomic inequalities, only two reviews summarized the international evidence of inequalities in utilization rates in the general population [8, 9]. However, the first limited their analyses to home health services in developed countries, and found that utilization of home health services in the general population was notably lower for persons with high compared to low SES [8]. The second limited the analyses to healthcare utilization rates in the elderly population and found that the association with SES varied strongly according to the type of healthcare analysed. While elderly patients with low SES were advantaged in home visits, they were disadvantaged in dental and medical appointments, and no association with SES was found for hospitalization rates and emergency use [9].
So far, it is evident that socioeconomic inequalities in utilization rates differ depending on the domain of healthcare analysed. Nevertheless, the evidence on socioeconomic differences in physician utilization in the general adult population has not been summarized so far. Moreover, individual studies suggest that inequalities in physician visits differ depending on whether utilization of primary-care or specialist physicians is analysed [10–12]. Therefore, enhanced knowledge is needed (1) if socioeconomic inequalities in visiting primary-care or specialist physicians do exist; and (2) if divergent results of inequalities in physician visits can be explored depending on methodical diversity, e.g., operationalization of SES or utilization.
Methods
This review aims to summarize the evidence on socioeconomic inequalities in consulting primary-care and specialist physicians in the general adult population in high-income countries. Studies from low- and middle income countries (defined by The World Bank 2019 [13]) were excluded as the nature of and issues related to healthcare utilization and health-care system differ significantly from health care systems in high-income countries. To perform this review, we searched the electronic databases Medline and Web of Science to identify relevant studies. In addition, we manually searched the reference lists of all included articles for further potentially relevant studies. The search was conducted in January 2019 and limited to articles published in either English or German within the last 15 years. Different combinations of keywords related to (a) primary-care or specialist physicians, (b) inequalities, and (c) SES were used for the search (see additional file 1).
Study selection and eligibility criteria
The identified records were independently screened by two researchers for eligibility criteria in three consecutive steps: titles, abstracts, full texts. SLL conducted the screening at any step, JH conducted the title- and abstract screening, and JR and JM each conducted half of the full text screening. After each step a joint decision was reached through discussions in cases of disagreement. The criteria used to identify articles of interest limited the search results to original quantitative studies. An article was included in the review if it met the following criteria: (a) analysing the general population aged 15 years or older in a high-income country; (b) analysing any SES indicator (income, education, occupation, social class, or any combination of these indicators) based on individual data; (c) analysing utilization of primary-care, or specialist physicians, or both independently from each other (d) presenting quantitative original data on differences in utilization between at least two different SES groups. The following exclusion criteria were applied: (a) specific populations, namely disease- or SES-specific; (b) differences in race, rurality, insurance status, financial barriers, or employment status; (c) utilization of medical interventions, dentists, inpatient treatment, healthcare in general, or of physicians without differentiating between primary and specialized care; (d) SES or utilization based on area data, or not linked to the individual; (e) conference abstracts and comments.
Data extraction and quality assessment
Data extraction was conducted by SLL, and checked by JR or JM. The following information was extracted from texts, tables, and figures of the included studies: author, year, countries, database, number of participants, participant’s age, physician (primary care or specialist), measurement of utilization, measurement of SES, confounder variables, and the result if an association of SES with physician visits has been found. As the included studies analysed different aspects, it was difficult to compare them in a common scheme that would account for all differences. Consequently, assumptions and simplifications had to be made in order to compare the studies. The results in the tables were abstracted to the most relevant finding analysing if a relationship (and the direction) between SES and utilization of primary-care or specialist physicians was found with the following simplifications:
the results comparing the highest SES with the lowest SES (when more than two SES-groups were compared);
significant differences at a p ≤ 0.05 or lower (when several p values were designated);
the most recent findings (from studies analysing trends of socioeconomic inequalities);
the results from the best fitting final model (if an analysis was conducted using different types of adjustments);
the results including the broadest variety of the population (if subgroups, e.g. private and public healthcare, were analysed)
Further, to simplify the description of the extracted information and the comparison:
we only report the results from high-income countries and report only the most frequent result (if several analyses have been conducted for more than four countries);
we dichotomized adjustment variables to “↑” if adjustments were made for at least gender, age and any general health variable; and “↓” if the required need adjustments were not made, including only adjusting for age, gender, and mental health.
Risk of bias was assessed in accordance with RoBANS, [14] and assessed independently by (1) SLL and (2) either JR or JM. The assessments were subsequently discussed to achieve a consensus regarding the rating of each domain in each included article. In a joint decision it was defined that register and national survey data are defined to present “low risk of bias” for the selection of participants, but “high risk” when only sub-populations were analysed without rationale. Second, confounding variables presenting a “low risk of bias” are age, gender, and a minimum of one need-variable of chronic diseases or self-rated health. Further, register data and standardized questionnaires measuring self-reported values are defined to be a “low risk for bias” for measurement of exposure. Fourth, register and national survey data are defined to present “low risk of bias” for the blinding of outcome measure. Fifths, the risk of bias for incomplete outcome data was defined unclear, when missing values were not mentioned or imputed, but high risk when missing values were evident but not tested, and defined low risk when missing values were mentioned and tested. Lastly, for secondary data analyses and analyses of register, panel or national survey data without a study protocol, selective outcome reporting was rated “low risk of bias” when descriptions in the methods section match with the results section.
Results
We found 1229 unique abstracts published between January 2004 and December 2018. Among these, 57 examined socioeconomic differences in physician visits and met all inclusion criteria. The flowchart of the study selection procedure is presented in Fig. 1. Most studies were based on register-data or secondary data from population surveys (see Table 1). In total, the studies comprised data from 32 high-income countries, of which seven were non-European countries, namely, Australia, Canada, Chile, Hong Kong, Israel, New Zealand, and the USA. Whereas three studies analysed pooled data from several European countries, the majority analysed data from one country (n=44), or several countries separately (n=10). These 54 studies most often reported data from Spain (n=15), Germany (n=14), and Belgium (n=10).
Fig. 1.
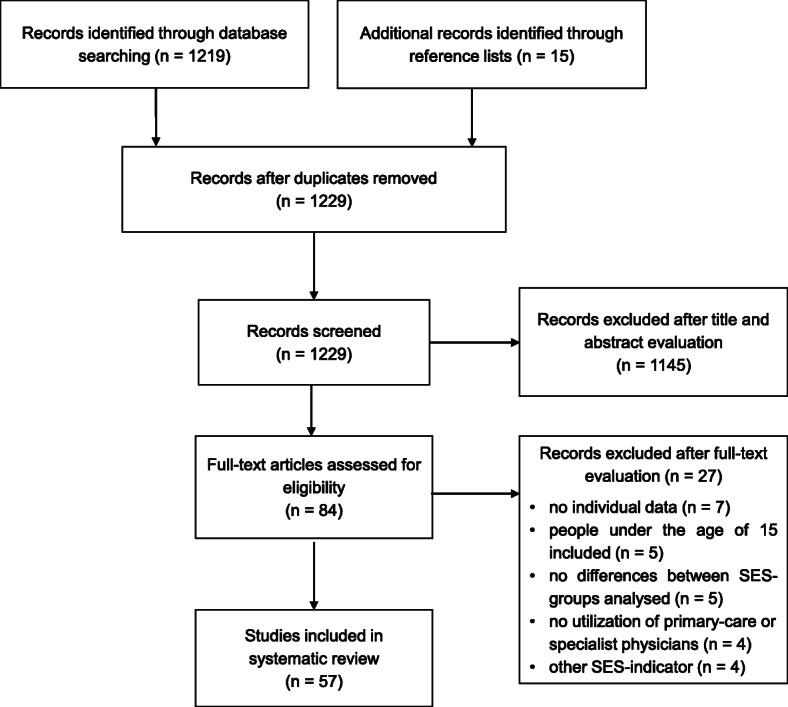
Flowchart of the systematic literature research
Table 1.
Characteristics of the 57 studies included in the systematic review
| Author | Year | Countries | database (target population) | number of participants | age of participants |
|---|---|---|---|---|---|
| Abasolo, Saez, López-Casasnovas [15] | 2017 | Spain | Spanish National Health Survey 2011/12 | 19,935 | ≥ 15 years |
| Agerholm et al. [16] | 2013 | Sweden |
Public Health Survey in Stockholm County 2006, Stockholm County Council’s administrative database 2007, Longitudinal integration database for health insurance and labor market studies |
31,848 | 25 to 84 years |
| Allin [17] | 2008 | Canada | Canadian Community Health Survey 2003 | 104,510 | ≥ 15 years |
| Asada, Kephart [18] | 2007 | Canada | Canadian Community Health Survey 2000/1 | 133,300 | ≥ 20 years |
| Bago d’Uva, Jones, van Doorslaer [19] | 2009 | Austria, Belgium, Denmark, Finland, Greece, Ireland, Italy, Netherlands, Portugal, Spain | European Community Household Panel User Database 1994–2001 | N.A. | ≥ 16 years |
| Baron-Epel, Garty, Green [20] | 2007 | Israel | Israel National Health Survey 2003/04 | 9512 | ≥ 21 years |
| Beckman, Anell [21] | 2013 | Sweden |
Skåne Regional Council and Statistics Sweden 2010/11, Statistics Sweden 2009 |
828,988 | 25 to 84 years |
| Bergmann, Kalcklösch, Tiemann [22] | 2005 | Germany | Telephone Health Survey 2003 | 8318 | ≥ 18 years |
| Bourke [23] | 2009 | Ireland | Living in Ireland survey 2001 | 6518 | ≥ 16 years |
| Bremer, Wübker [24] | 2013 | Germany | Survey of Health, Aging and Retirement in Europe 2004–2006 | 2861 | ≥ 50 years |
| Bremer, et al. [25] | 2018 | pooled data from 16 European countries | Survey of Health, Aging and Retirement in Europe 2010/11 | 56,989 | ≥ 50 years |
| Crespo-Cebada, Urbanos-Garrido [26] | 2012 | Spain | Survey of Health, Aging and Retirement in Europe 2006/07 | 1860 | ≥ 50 years |
| Devaux, de Looper [27] | 2012 | Austria, Belgium, Canada, Czech Republic, Denmark, Estonia, Finland, France, Hungary, Ireland, New Zealand, Poland, Slovak Republic, Slovenia, Spain, Switzerland, UK |
European Health Interview Surveys (2006/07, 2007, 2008 or 2009) other national health interview surveys (2005, 2006/07, 2007, 2007/08, 2008 or 2009) |
N.A. | ≥ 15 years |
| Fjaer, et al. [28] | 2017 | Austria, Belgium, Czech Republic, Denmark, Estonia, Finland, France, Germany, Hungary, Ireland, Israel, Lithuania, Netherlands, Norway, Poland, Portugal, Slovenia, Spain, Sweden, Switzerland, UK | European social survey 2014 | 31,971 | 25 to 75 years |
| Garrido-Cumbrera, et al. [29] | 2010 | Spain | Spanish National Health Survey 2006 | 29,478 | ≥ 16 years |
| Glazier et al. [30] | 2009 | Canada |
Canadian Community Health Survey 2000/01, Physician claim files in 2002/03 and 2003/04 |
25,558 | 20 to 79 years |
| Gonzalez-Alvarez, Barranquero [31] | 2009 | Spain | European Community Household Panel 1994–2001 | 15,076 | ≥ 16 years |
| Grasdal, Monstad [32] | 2011 | Norway |
Survey of Living Conditions 2005, Administrative records 2005 |
3002 | 16 to 69 years |
| Gruber, Kiesel [33] | 2010 | Germany | Survey of Health, Ageing and Retirement in Europe 2004 | 2260 | 50 to 90 years |
| Habicht, Kunst [34] | 2005 | Estonia | Survey of Living Conditions 1999 | 3990 | 25 to 74 years |
| Hansen, et al. [35] | 2012 | Norway | Tromsø Study 2007/08 | 12,982 | 30 to 87 years |
| Hoebel, et al. [12] | 2016 | Germany | German Health Interview and Examination Survey for Adults 2008–2011 | 6754 | 18 to 69 years |
| Hoeck, et al. [36] | 2011 | Belgium | Belgian Health Interview Survey 2001–2004 | 4494 | ≥ 65 years |
| Hoeck, et al. [37] | 2013 | Belgium | Belgian Health Interview Survey 2001–2004 | 19,563 | ≥ 16 years |
| Korda, et al. [38] | 2009 | Australia | Australian Longitudinal Study of Women’s Health 2004 | 10,905 | 53 to 58 years |
| La Parra-Casado, et al. [39] | 2018 | Spain | Spanish National Health Survey 2011/12 | 21,650 | ≥ 16 years |
| Lichte [40] | 2017 | Germany | random sample survey of general practitioner attenders 2015/16 | 519 | ≥ 18 years |
| Lostao, et al. [41] | 2011 | UK, Spain |
General Household Survey 2004/05 Spanish National Health Survey 2003 |
36,488 | ≥ 16 years |
| Lu, et al. [42] | 2007 | Hong Kong | Thematic Household Survey 2002 | 19,522 | ≥ 16 years |
| Masseria, Giannoni [43] | 2010 | Italy | Multiscopo Survey 1999/2000 | 109,964 | > 16 years |
| McDonald, Conde [44] | 2010 | Canada | Canadian Community Health Survey 2002/03 | 39,974 | 55 to 79 years |
| Mosquera, et al. [45] | 2017 | Sweden | Health on Equal Terms survey 2014 | 3016 | 16 to 25 years |
| Nolan [46] | 2007 | Ireland | Living in Ireland Survey 1995–2001 | 49,237 | ≥ 16 years |
| Palència, et al. [47] | 2013 | Spain | Spanish National Health Survey 2006 | 20,478 | ≥ 16 years |
| Põlluste, Kalda, Lember [48] | 2009 | Estonia | random sample survey of general population 2005 | 182 | 65 to 74 years |
| Rattay et al. [49] | 2013 | Germany | German Health Interview and Examination Survey for Adults 2008–2011 | 8152 | 18 to 79 years |
| Regidor, et al. [50] | 2008 | Spain | Spanish National Health Survey 2003/04 | 18,837 | 16 to 74 years |
| Reibling, Wendt [51] | 2010 | Austria, Belgium, Denmark, France, Germany, Greece, Italy, Netherlands, Spain, Sweden, Switzerland | Survey of Health, Ageing and Retirement in Europe 2004 | 26,808 | ≥ 50 years |
| Rogowski et al. [52] | 2008 | USA |
random sample survey of Medicare enrollees 2000; administrative data |
4600 | ≥ 65 years |
| Ryvicker, Gallo, Fahs [53] | 2012 | USA | random sample survey of community-dwelling older senior center attendees 2008 | 1870 | 60 to 99 years |
| San Sebastian, Mosquera, Gustafsson [54] | 2017 | Sweden |
Health on equal terms survey 2014 Statistics Sweden |
24,889 | 19 to 84 years |
| Schnitzer, et al. [55] | 2011 | Germany | Representative sample survey of the population with statutory health insurance 2010 | 5232 | 18 to 79 years |
| Schulz [56] | 2016 | pooled data from 13 European countries | Survey of Health, Aging, and Retirement 2004/05–2006/07 | 48,065 | ≥ 40 years |
| Stirbu, et al. [11] | 2011 | Belgium, Estonia, France, Germany, Hungary, Ireland, Latvia, Netherlands, Norway | several national health surveys between 1995 and 2004 | 104,503 | ≥ 15 years |
| Suominen-Taipale, et al. [57] | 2004 | Finland, Norway |
The Health Study of Nord-Trondelag, HUNT 1995–1997 FINRISK-97 senior survey 1997 |
9202 | 65 to 74 years |
| Tavares, Zantomio [58] | 2017 | Italy, Spain, Portugal | Survey of Health, Aging and Retirement in Europe 2011 | 9049 | ≥ 50 years |
| Terraneo [10] | 2015 | pooled data from 12 European countries | Survey of Health, Aging and Retirement in Europe 2007–2009 | 16,431 | ≥ 50 years |
| Thode et al. [59] | 2005 | Germany | German Health Interview and Examination Survey for Adults 1998 | 7124 | 18 to 79 years |
| Tille, et al. [60] | 2017 | Germany | random sample survey of the general population 2006–2016 | 42,925 | ≥ 18 years |
| van Doorslaer, Koolman, Jones [61] | 2004 | Austria, Belgium, Denmark, Germany, Greece, Ireland, Italy, Luxemburg, Netherlands, Portugal, Spain, UK | European community household panel 1996 | N.A. | ≥ 16 years |
| van Doorslaer, Masseria, Koolman [62] | 2006 | Austria, Belgium, Canada, Denmark, Finland, France, Germany, Greece, Hungary, Ireland, Italy, Netherlands, Norway, Portugal, Spain, Switzerland, UK | European community household panel and other nationally representative surveys 1996–2002 | N.A. | ≥ 16 years |
| van Ourti [63] | 2004 | Belgium | panel study of Belgian households 2001 | 4809 | > 15 years |
| Vasquez, Paraje, Estay [64] | 2013 | Chile | national socio-economic characterization survey 2009 | 246,924 | ≥ 18 years |
| Vedsted et al. [65] | 2004 | Denmark | intervention study of general practitioner attenders | 2526 | 20 to 64 years |
| Vedsted, Olesen [66] | 2005 | Denmark | intervention study of general practitioner attenders | 2211 | 20 to 64 years |
| Vikum, et al. [67] | 2013 | Norway |
Nord-Trøndelag Health Study 2006/08 register data |
46,860 | ≥ 20 years |
| Vikum, Krokstad, Westin [68] | 2012 | Norway |
Nord-Trøndelag Health Study 2006/08 register data |
44,755 | ≥ 20 years |
Overall, 70% (n=40) of the studies analysed both primary-care and specialist physician visits, another 25% (n=14) of the studies only primary-care physician visits, and 5% (n=3) only specialist physician visits (Table 2). The definition of primary- and specialist care differed between the studies and health-care systems. Primary-care implied family physicians, and/or general practitioners, but in some cases after excluding prevention services, child or maternity care, physicians at healthcare centres, or internal medicine physicians. Specialist care was defined as medical outpatient specialists, any specialist except while being hospitalized, or generally physician visits at the hospital without being hospitalized. Utilization of physicians was measured according to probability (having visited a physician or not) in 72% (n=41) of the studies, according to frequency (number of visits) in 37% (n=21) of the studies, or according to conditional frequency (number of visits conditional to having visited a physician at least once) in 30% (n=17) of the studies. 95% (n=54) of the studies adjusted the analysis for need according to at least gender, age, and either self-rated health or chronic conditions. SES was measured by income (58%; n=33) and/or education (54%; n=31) in most of the studies. 4% (n=2) of the studies measured SES by income, education, and occupation; 9% (n=5) of the studies only by occupation; and 7% (n=4) of the studies by an SES-index. The period for which physician utilization was reported by the participants, ranged from two weeks to two years. 68% (n=39) of the studies analysed utilization rates within the last 12 months, 14% (n=8) of the studies within the last four weeks or one month, 11% (n=6) of the studies within the last three months, 5% of the studies within the last two months, each 4% (n=2) of the studies within the last two weeks, and last two years, and 2% (n=1) of the studies within the last six months. Most of the 57 studies have carried out several calculations (for different countries, age groups, utilization or SES measures; see Table 2). Therefore, and through rounding the percentages are more than 100%. The following results are based on a total of 548 different analyses.
Table 2.
Results on relationships between socioeconomic status and utilization of primary-care and specialist physicians
| author | countries | age group | time | physician | utilisation | SES measure | need-adjusted | result |
|---|---|---|---|---|---|---|---|---|
| Abasolo, Saez, López-Casasnovas [15] | Spain | ≥ 15 years | 4 weeks | primary care | frequency | household income | ↓ | o |
| specialist | o | |||||||
| Agerholm et al. [16] | Sweden | 25 to 64 years | 12 months | primary care | frequency | adjusted household income | ↑ | o4 |
| specialist | + | |||||||
| 65 to 84 years | primary care | o4 | ||||||
| specialist | + | |||||||
| Allin [17] | Canada | ≥ 15 years | 12 months | primary care | probability | adjusted household income | ↑ | + |
| frequency | o | |||||||
| specialist | probability | + | ||||||
| frequency | + | |||||||
| Asada, Kephart [18] | Canada | ≥ 20 years | 12 months | primary care | probability | education | ↑ | + |
| adjusted household income | + | |||||||
| conditional frequency | education | – | ||||||
| adjusted household income | – | |||||||
| specialist | probability | education | + | |||||
| adjusted household income | + | |||||||
| conditional frequency | education | + | ||||||
| adjusted household income | o | |||||||
| Bago d’Uva, Jones, van Doorslaer [19] | Austria, Belgium, Denmark, Finland, Greece, Ireland, Italy, Netherlands, Portugal, Spain | ≥ 16 years | 12 months | primary care | frequency | adjusted household income | ↑ | −5 |
| specialist | + | |||||||
| Baron-Epel, Garty, Green [20] | Israel | ≥ 21 years | 4 weeks | primary care | probability | education | ↑ | – |
| household income | – | |||||||
| specialist | education | + | ||||||
| household income | o | |||||||
| Beckman, Anell [21] | Sweden | 25 to 44 years | 2 years | primary care | probability | household income | ↓ | + |
| 45 to 64 years | o4 | |||||||
| 65 to 84 years | + | |||||||
| Bergmann, Kalcklösch, Tiemann [22] | Germany | ≥ 18 years | 12 months | primary care | frequency | index | ↑ | – |
| Bourke [23] | Ireland | ≥ 16 years | 12 months | primary care | probability | adjusted household income | ↑ | o |
| frequency | – | |||||||
| conditional frequency | – | |||||||
| specialist | probability | + | ||||||
| frequency | o | |||||||
| conditional frequency | – | |||||||
| Bremer, Wübker [24] | Germany | ≥ 50 years | 12 months | primary care | probability | education | ↑ | o |
| adjusted household income | o | |||||||
| conditional frequency | education | o | ||||||
| adjusted household income | o | |||||||
| specialist | probability | education | o | |||||
| adjusted household income | + | |||||||
| conditional frequency | education | o | ||||||
| adjusted household income | + | |||||||
| Bremer, et al. [25] | Pooled Data from 16 European Countries | ≥ 50 years | 12 months | primary care | frequency | education | ↑ | – |
| Crespo-Cebada, Urbanos-Garrido [26] | Spain | ≥ 50 years | 12 months | primary care | probability | education | ↑ | o |
| adjusted household income | o | |||||||
| conditional frequency | education | o | ||||||
| adjusted household income | o | |||||||
| Devaux, de Looper [27] | Austria, Belgium, Canada, Czech Republic, Denmark, Estonia, Finland, France, Hungary, Ireland, New Zealand, Poland, Slovak Republic, Slovenia, Spain, Switzerland, UK | ≥ 15 years | 12 months1 | primary care | probability | adjusted household income | ↑ | o5 |
| frequency | o5 | |||||||
| specialist | probability | + 5 | ||||||
| frequency | + 5 | |||||||
| Fjaer, et al. [28] | Austria, Belgium, Czech Republic, Denmark, Estonia, Finland, France, Germany, Hungary, Ireland, Israel, Lithuania, Netherlands, Norway, Poland, Portugal, Slovenia, Spain, Sweden, Switzerland, UK | 25 to 75 years | 12 months | primary care | probability | education | ↑ | o5 |
| specialist | + 5 | |||||||
| Garrido-Cumbrera, et al. [29] | Spain | ≥ 16 years | 4 weeks | primary care | probability | occupation | ↑ | – |
| specialist | + | |||||||
| Glazier et al. [30] | Canada | 20 to 79 years | 2 years | primary care | probability | education | ↑ | o |
| adjusted household income | o | |||||||
| conditional frequency | education | – | ||||||
| adjusted household income | – | |||||||
| specialist | probability | education | + | |||||
| adjusted household income | o | |||||||
| conditional frequency | education | + | ||||||
| adjusted household income | o | |||||||
| Gonzalez-Alvarez, Barranquero [31] | Spain | ≥ 16 years | 12 months | primary care | probability | education | ↑ | – |
| adjusted household income | o | |||||||
| frequency | education | – | ||||||
| adjusted household income | o | |||||||
| conditional frequency | education | – | ||||||
| adjusted household income | o | |||||||
| specialist | probability | education | + | |||||
| adjusted household income | + | |||||||
| frequency | education | + | ||||||
| adjusted household income | + | |||||||
| conditional frequency | education | o | ||||||
| adjusted household income | o | |||||||
| Grasdal, Monstad [32] | Norway | 16 to 69 years | 12 months | primary care | probability | adjusted household income | ↑ | o |
| conditional frequency | o | |||||||
| specialist | probability | + 6 | ||||||
| conditional frequency | o | |||||||
| Gruber, Kiesel [33] | Germany | 50 to 90 years | 12 months | specialist | probability | education | ↑ | o4 |
| adjusted household income | o4 | |||||||
| frequency | education | o | ||||||
| adjusted household income | o | |||||||
| Habicht, Kunst [34] | Estonia | 25 to 74 years | 6 months | primary care | probability | education | ↑ | o |
| adjusted household income | + | |||||||
| specialist | education | + | ||||||
| adjusted household income | + | |||||||
| Hansen, et al. [35] | Norway | 30 to 87 years | 12 months | primary care | probability | education | ↑ | o |
| household income | o | |||||||
| occupation | o | |||||||
| conditional frequency | education | o4 | ||||||
| household income | – | |||||||
| occupation | o | |||||||
| Hoebel, et al. [12] | Germany | 18 to 69 years | 12 months | primary care | probability | index | ↑ | o |
| conditional frequency | – | |||||||
| specialist | probability | + | ||||||
| conditional frequency | o | |||||||
| Hoeck, et al. [36] | Belgium | ≥ 65 years | 2 months | primary care | probability | education | ↑ | o |
| adjusted household income | o | |||||||
| specialist | education | o | ||||||
| adjusted household income | o | |||||||
| Hoeck, et al. [37] | Belgium | ≥ 16 years | 2 months | primary care | probability | education | ↑ | o |
| adjusted household income | o | |||||||
| conditional frequency | education | o | ||||||
| adjusted household income | o | |||||||
| specialist | probability | education | + | |||||
| adjusted household income | o | |||||||
| conditional frequency | education | o | ||||||
| adjusted household income | o | |||||||
| ≥ 65 years | primary care | probability | education | ↑ | o | |||
| adjusted household income | o | |||||||
| conditional frequency | education | o | ||||||
| adjusted household income | o | |||||||
| specialist | probability | education | + | |||||
| adjusted household income | o | |||||||
| conditional frequency | education | o | ||||||
| adjusted household income | o | |||||||
| Korda, et al. [38] | Australia | 53 to 58 years | 12 months | primary care | probability | occupation | ↑ | o |
| conditional frequency | o | |||||||
| specialist | probability | + | ||||||
| conditional frequency | o | |||||||
| La Parra-Casado, et al. [39] | Spain | ≥ 16 years | 4 weeks | primary care | probability | occupation | ↑ | o |
| Lichte [40] | Germany | ≥ 18 years | 3 months | primary care | conditional frequency | education | ↑ | o |
| household income | o | |||||||
| Lostao, et al. [41] | UK | ≥ 16 years | 2 weeks2 | primary care | probability | occupation | ↑ | o |
| specialist | o | |||||||
| Spain | primary care | – | ||||||
| specialist | + | |||||||
| Lu, et al. [42] | Hong Kong | ≥ 16 years | 1 months | primary care | probability | income | ↑ | + |
| frequency | + | |||||||
| specialist | probability | o | ||||||
| frequency | o | |||||||
| Masseria, Giannoni [43] | Italy | > 16 years | 4 weeks | primary care | probability | education | ↑ | – |
| adjusted household income | + | |||||||
| specialist | education | + | ||||||
| adjusted household income | o | |||||||
| McDonald, Conde [44] | Canada | 55 to 79 years | 12 months | primary care | probability | education | ↑ | + |
| adjusted household income | + | |||||||
| conditional frequency | education | o | ||||||
| adjusted household income | o | |||||||
| specialist | probability | education | + | |||||
| adjusted household income | + | |||||||
| conditional frequency | education | + | ||||||
| adjusted household income | o | |||||||
| Mosquera, et al. [45] | Sweden | 16 to 25 years | 3 months | primary care | probability | household income | ↑ | – |
| Nolan [46] | Ireland | ≥ 16 years | 12 months | primary care | frequency | education | ↑ | o |
| adjusted household income | o | |||||||
| Palència, et al. [47] | Spain | ≥ 16 years | 4 weeks | primary care | probability | occupation | ↑ | – |
| specialist | + | |||||||
| Põlluste, Kalda, Lember [48] | Estonia | 65 to 74 years | 12 months | primary care | probability | education | ↑ | o |
| adjusted household income | o | |||||||
| specialist | education | o | ||||||
| adjusted household income | o | |||||||
| Rattay et al. [49] | Germany | 18 to 79 years | 12 months | primary care | probability | index | ↓ | – |
| Regidor, et al. [50] | Spain | 16 to 74 years | 2 weeks | primary care | probability | education | ↑ | – |
| adjusted household income | – | |||||||
| occupation | – | |||||||
| specialist | education | + | ||||||
| adjusted household income | + | |||||||
| occupation | + | |||||||
| Reibling, Wendt [51] | Austria, Belgium, Denmark, France, Germany, Greece, Italy, Netherlands, Spain, Sweden, Switzerland | ≥ 50 years | 12 months | specialist | probability | education | ↑ | + 5 |
| Rogowski et al. [52] | USA | ≥ 65 years | 12 months | primary care | frequency | education | ↑ | o |
| adjusted household income | o | |||||||
| specialist | education | + | ||||||
| adjusted household income | o | |||||||
| Ryvicker, Gallo, Fahs [53] | USA | 60 to 99 years | 12 months | primary care | probability | education | ↑ | + |
| San Sebastian, Mosquera, Gustafsson [54] | Sweden | 18 to 84 years | 3 months | primary care | probability | income | ↑ | + |
| specialist | o | |||||||
| Schnitzer, et al. [55] | Germany | 18 to 79 years | 12 months | specialist | frequency | education | ↑ | + |
| Schulz [56] | Pooled Data from 13 European Countries | ≥ 40 years | 12 months | primary care | frequency | education | ↑ | – |
| specialist | + | |||||||
| Stirbu, et al. [11] | Belgium, Estonia, France, Germany, Hungary, Ireland, Latvia, Netherlands, Norway | ≥ 15 years | 12 months3 | primary care | probability | education | ↑ | o5 |
| specialist | + | |||||||
| Suominen-Taipale, et al. [57] | Finland | 65 to 74 years | 12 months | primary care | probability | education | ↑ | o |
| specialist | + | |||||||
| Norway | primary care | + | ||||||
| specialist | + | |||||||
| Tavares, Zantomio [58] | Italy | ≥ 50 years | 12 months | primary care | frequency | education | ↑ | – |
| specialist | + | |||||||
| Spain | primary care | – | ||||||
| specialist | + | |||||||
| Portugal | primary care | + | ||||||
| specialist | + | |||||||
| Terraneo [10] | Pooled Data from 12 European Countries | ≥ 50 years | 12 months | primary care | probability | education | ↑ | o |
| specialist | + | |||||||
| Thode et al. [59] | Germany | 18 to 79 years | 12 months | primary care | frequency | index | ↑ | – |
| Tille, et al. [60] | Germany | ≥ 18 years | 12 months | primary care | frequency | education | ↑ | – |
| specialist | o | |||||||
| van Doorslaer, Koolman, Jones [61] | Austria, Belgium, Denmark, Germany, Greece, Ireland, Italy, Luxemburg, Netherlands, Portugal, Spain, UK | ≥ 16 years | 12 months | primary care | probability | adjusted household income | ↑ | o5 |
| frequency | −5 | |||||||
| conditional frequency | −5 | |||||||
| specialist | probability | + 5 | ||||||
| frequency | + 5 | |||||||
| conditional frequency | o5 | |||||||
| van Doorslaer, Masseria, Koolman [62] | Austria, Belgium, Canada, Denmark, Finland, France, Germany, Greece, Hungary, Ireland, Italy, Netherlands, Norway, Portugal, Spain, Switzerland, UK | ≥ 16 years | 12 months | primary care | probability | adjusted household income | ↑ | o5 |
| conditional frequency | −5 | |||||||
| specialist | probability | + | ||||||
| conditional frequency | + 5 | |||||||
| van Ourti [63] | Belgium | > 15 years | 12 months | primary care | frequency | adjusted household income | ↑ | – |
| specialist | o | |||||||
| Vasquez, Paraje, Estay [64] | Chile | ≥ 18 years | 3 months | primary care | probability | adjusted household income | ↑ | + |
| frequency | + | |||||||
| specialist | probability | + | ||||||
| frequency | + | |||||||
| Vedsted et al. [65] | Denmark | 20 to 34 years | 12 months | primary care | conditional frequency | education | ↑ | o |
| 35 to 49 years | o | |||||||
| 50 to 64 years | o4 | |||||||
| Vedsted, Olesen [66] | Denmark | 20 to 64 years | 12 months | primary care | conditional frequency | education | ↑ | o4 |
| Vikum, et al. [67] | Norway | ≥ 20 years | 12 months | primary care | probability | education | ↑ | o4 |
| 20 to 67 years | income | o4 | ||||||
| ≥ 20 years | specialist | education | + | |||||
| 20 to 67 years | income | + | ||||||
| Vikum, Krokstad, Westin [68] | Norway | ≥ 20 years | 12 months | primary care | probability | education | ↑ | – |
| adjusted household income | o | |||||||
| specialist | education | + | ||||||
| adjusted household income | + |
1, deviating for probability in Denmark: 3 months; and for frequency in some EHIS countries: 4 weeks
2, deviating for outpatient consultations in UK: 3 months
3, deviating for consultations in Netherlands and Belgium: 2 months
4, significant results only in gender-specific subgroup-analyses
5, results differ for several countries, only the most frequent results are reported
6, only for private specialists; results for hospital outpatient visits are non-significant
+, higher utilization in the most advantaged; o, no significant differences; -, higher utilization in the most deprived
↑, adjustment for at least gender, age and any general health variable (e.g., self-rated health or chronic conditions); ↓, relevant adjustments for need have not been conducted
Socioeconomic differences in primary-care and specialist physician visits
Overall, 52% of the analyses on utilization of primary-care physicians found no inequalities, and 35% found higher utilization for the lowest SES group (Fig. 2; primary care ‘all’). Contrary, 71% of the analyses on utilization of specialist physicians found higher utilization for the highest SES group, and 28% found no inequalities (Fig. 2; specialist care ‘all’). While taking a closer look at the various measures of utilization (Fig. 2; probability, frequency and conditional frequency), we found that 62% of the analyses on the probabilities of utilizing a primary-care physician found no socioeconomic inequalities, while 55% of the analyses on frequencies, and 54% of the analyses on conditional frequencies of primary-care physician visits found higher utilization in the most deprived. The results on specialist physicians also differed according to the operationalization of utilization in the way that 78% of the analyses on the probability and 75% of the analyses on the frequency of specialist visits found higher utilization for the highest SES-group. Higher utilization for the highest SES-group was found in only 50% of the analyses on the conditional frequency of specialist visits, whereas another 47% of the latter found no inequalities.
Fig. 2.

Socioeconomic differences in primary-care and specialist physician visits in all analyses, and subdivided for the different operationalisations of utilization (probability, frequency, and conditional frequency)
Various measures of socioeconomic differences in physician utilization
In a second step, we took a closer look at further variations of measures, in order to examine whether they might cause distinct results. Therefore, we contrasted the study’s results (additional file 2) according to differences in time periods for which physician utilization was reported, and SES indicators.
Regarding time periods of utilization, it was found that in shorter time periods of 6 months or less, higher probabilities for primary-care physician visits in the lowest SES-group emerged, whereas studies analysing longer time periods found more often no inequalities. Contrariwise, for specialist visits higher probabilities in the highest SES-group were found less often in short compared to long time periods. Because only a very limited number of studies analysed the frequency or conditional frequency of utilization in a short time period, we renounced the comparison.
Regarding different SES indicators, higher probabilities and frequencies of primary-care physician visits were found for those with low education compared to those with low income, but higher conditional frequencies of primary-care physician visits were found more often for those with low income compared to those with low education. Results for socioeconomic inequalities in specialist physician visits seemed to hardly differ according to SES measurement. As only few studies measured SES by occupation or by an index, we renounced the comparison.
Quality of the studies
The quality of the included studies was fairly high, as the majority of the studies was rated to have a low risk of bias in at least five of the six domains of RoBANS. Only three studies were ranked to have a high risk of bias in more than one domain (additional file 3). The risk of bias of confounding variables, measurement of exposure, blinding of outcome measure and selective outcome reporting was rated low in 54 studies, whereas the risk of bias of incomplete outcome data was rated high in 23 studies (additional file 3).
Discussion
Principal findings
In general, socioeconomic inequalities in utilization of physicians were more prevalent among specialists than among primary-care physicians. The probability of utilizing primary care was often not influenced by SES in the general population, but the disadvantaged visited their primary-care physician more frequently. Moreover, the highest-SES groups often had higher probabilities for specialist visits, but studies often found no associations of SES with (conditional) frequencies of specialist visits.
Interpretation
This systematic review confirms that the existence of socioeconomic differences in healthcare utilization heavily depends on the health services analysed [9]. The existing review on socioeconomic inequalities in physician visits in the elderly population, which did not differentiate between primary-care and specialist physicians, found more medical appointments for the highest-SES group [9]. Accordingly, we found that a distinction of medical appointments between primary and specialized care is necessary when analysing socioeconomic inequalities in physician visits, because the results differed greatly according to the type of doctor and the type of service. We found that not all medical appointments, but mainly specialist were visited with higher probabilities and frequencies by the highest-SES groups. In contrast, most studies indicated that the probability of visiting primary-care physicians was not determined by SES, comparable to the evidence for hospitalization and emergency use, which rather presents access to need- and emergency-oriented healthcare [9]. Lastly, the frequency of primary-care physician visits often was higher in the lowest-SES groups, and is therefore comparable to the evidence on inequalities in utilization of home health services und visits [8, 9].
Consequently, socioeconomic inequalities disadvantaging the deprived are a matter of concern especially in specialist visits. Based on this review, we are not able to infer whether these inequalities are a matter of need, a matter of access barriers to specialist physicians, a matter of different information, or a matter of different preferences and patient choice. Nevertheless, nearly all studies adjusted for patient’s need according to gender, age, and any physical health condition. Either self-rated health or the number of self-reported chronic conditions was applied as an indicator for the latter. Although this indicates good quality, these indicators remain only approximate to real need of receiving healthcare. Accordingly, we cannot conclude that probability of primary-care physician visits is needs-based even though most studies did not find significant associations with SES. In order to avoid underestimating or disregarding differences, when analysing only probabilities of visits using register-based data, Agerholm et al. concluded that health status should be considered in analyses on socioeconomic differences in healthcare utilization [16]. Nevertheless, self-rated health remains a subjective rating of people’s perception of their health. Although studies found that self-rated health is a good proxy for objective health in the general population, [69] one study found that the evaluation of self-rated health is biased by SES, because the more educated rated their subjective health worse with the same level of objective health, [70] which implies socioeconomic differences might be underestimated.
Given the results that low-SES populations often visit specialist physicians less often, but primary-care physicians more frequently at concurrently equal probabilities compared to high SES populations, an intuitive explanation is that barriers in access to specialists are important in explaining healthcare inequalities. One possible reason for access barriers to specialists might be rurality of low-SES populations [71]. Thus, waiting time and distance might carry more weight in visiting specialists, because those are often distributed regionally more widely than primary-care physicians. Furthermore, the results suggest that different information, preferences, and patient choices are relevant reasons for socioeconomic inequalities in physician visits, because the relationship with primary-care physicians is more trusting and familiar than with specialist. As a consequence, the lower educated might feel less exposed to existing communication problems (language barriers, terminology, information gap) [72] with their longtime, well-known primary-care physicians, and they might prefer visits to them compared to specialist physicians [10]. The perceived role in healthcare varies between SES groups, as those with low SES tend to delegate responsibility to healthcare professionals [73]. Given the trustful and longtime relationship with primary care physicians compared to specialists, and given that primary-care physicians have the task of gatekeeping in some countries, might emphasize the importance of primary-care physicians from the perspective of the low-SES population when delegating responsibility for their healthcare, and might therefore explain the more frequent visits from the most deprived.
This review found that income inequalities advantaging high-SES groups in primary-care physician visits are more pronounced than educational differences. This may be an indication that financial barriers are a relevant additional factor explaining socioeconomic inequalities in utilization of primary-care physicians [74]. The finding that detrimental inequalities were found less often in shorter time periods is consistent with the finding that detrimental inequalities were found less often when utilization was operationalized with frequency versus probability. Accordingly, a higher frequency of physician visits among the most deprived means that they are more likely to have visited a physician at least once in a short period. A possible explanation could be that frequencies are more likely to be influenced by preferences and patient choice, whereas probabilities are more likely to be influenced by access barriers.
Limitations
Although we have screened 1229 references we might have missed relevant publications, especially those not differentiating between primary and specialized healthcare in the abstract, but only in the main text. Second, the selection criteria might bias the results, which are not generalizable to children, disease-specific populations, low- and middle-income-countries, or inequalities induced by other (horizontal) disadvantages. Because very few studies based SES on area data, we excluded them even when area SES was linked to the individual on postal codes. Third, we made various simplifications in order to compare the studies, which influenced the reported results, which must be interpreted carefully. We described the results only by comparing the highest with the lowest SES group, and we did not include effect sizes in our descriptions. The health systems of the countries are very different, e.g., primary und specialized healthcare was defined differently in different studies. Primary health and its connection with specialist care is organised differently between the countries. For these reasons and because some studies analysed the same data basis, frequencies must be interpreted with caution, and comparisons are rather explorative hints than robust results. Finally, data on utilization, SES, and health were often self-rated, and even though instruments are valid, the accuracy is affected by different factors, [75] which limits expressiveness.
Conclusions
In order to tackle socioeconomic inequalities in healthcare to the detriment of the deprived population, utilization of and access to specialist physicians is essential. The fact that predominantly no inequalities in probabilities of visiting primary-care physicians were found is generally a good result. Not visiting a primary-care physician can be interpreted as more fatal in maintaining good health than visiting specialists less frequently. This emphasizes the fact that the general population in high-income countries might have access to physicians largely independent of their SES, but the deprived might experience more barriers in accessing specialized healthcare. We assume that higher frequencies of primary-care physician visits from the low-SES groups with the same level of need might be subject to patient preferences in order to compensate for different levels of health literacy, information and communication, and therefore improve equal opportunities in receiving health maintenance.
Supplementary Information
Additional file 1. Search Strategy. Search strategy used to identify articles in the Medline and Web of Science database including search terms, search strings, and filters.
Additional file 2. Figures of additional results. Figures of the results on socioeconomic differences in the probabilities of utilizing primary-care and specialist physicians (a) subdivided for the different time periods of utilization; (b) subdivided for the different measures of socioeconomic status.
Additional file 3. Results of the risk of Bias evaluation for (a) each article included; (b) each of each of the six domains of the risk of bias assessment.
Acknowledgements
We gratefully acknowledge Maren Fendt for assisting the title-screening for this systematic review.
Authors´ contributions
SLL, OvdK, JS and MR designed the study and developed the literature search strategy. SLL, JH, JM, and JR conducted the literature screening, assessed the quality of the studies and extracted relevant information. SLL wrote the original manuscript. All authors read and approved the final manuscript.
Abbreviation
- SES
Socioeconomic Status
Funding
Open Access funding enabled and organized by Projekt DEAL.
Availability of data and materials
Not applicable.
Ethics approval and consent to participate
Not applicable.
Consent for publication
Not applicable.
Competing interests
The authors declare that they have no competing interests.
Footnotes
Publisher’s Note
Springer Nature remains neutral with regard to jurisdictional claims in published maps and institutional affiliations.
References
- 1.Mackenbach JP. Re-thinking health inequalities. Eur J Public Health. 2020;30:615. doi:10.1093/eurpub/ckaa001. [DOI] [PMC free article] [PubMed]
- 2.Forrest LF, Adams J, Wareham H, Rubin G, White M. Socioeconomic inequalities in lung cancer treatment: Systematic review and meta-analysis. PLoS Med. 2013;10:e1001376. doi: 10.1371/journal.pmed.1001376. [DOI] [PMC free article] [PubMed] [Google Scholar]
- 3.Grintsova O, Maier W, Mielck A. Inequalities in health care among patients with type 2 diabetes by individual socio-economic status (SES) and regional deprivation: a systematic literature review. Int J Equity Health. 2014;13:43. doi: 10.1186/1475-9276-13-43. [DOI] [PMC free article] [PubMed] [Google Scholar]
- 4.Schröder SL, Richter M, Schröder J, Frantz S, Fink A. Socioeconomic inequalities in access to treatment for coronary heart disease: A systematic review. Int J Cardiol. 2016;219:70–78. doi: 10.1016/j.ijcard.2016.05.066. [DOI] [PubMed] [Google Scholar]
- 5.Scott A, Chambers D, Goyder E, O’Cathain A. Socioeconomic inequalities in mortality, morbidity and diabetes management for adults with type 1 diabetes: A systematic review. PLoS One. 2017;12:e0177210. doi: 10.1371/journal.pone.0177210. [DOI] [PMC free article] [PubMed] [Google Scholar]
- 6.Aarts MJ, Lemmens VEPP, Louwman MWJ, Kunst AE, Coebergh JWW. Socioeconomic status and changing inequalities in colorectal cancer? A review of the associations with risk, treatment and outcome. Eur J Cancer. 2010;46:2681–2695. doi: 10.1016/j.ejca.2010.04.026. [DOI] [PubMed] [Google Scholar]
- 7.Klein J, Hofreuter-Gätgens K, von dem Knesebeck O. Socioeconomic status and the utilization of health services in Germany: a systematic review. In: Janssen C, Swart E, Tv L, editors. Health care utilization in Germany: Theory, methodology, and results. New York: Springer; 2014. p. 117–43.
- 8.Goodridge D, Hawranik P, Duncan V, Turner H. Socioeconomic disparities in home health care service access and utilization: A scoping review. Int J Nurs Stud. 2012;49:1310–1319. doi: 10.1016/j.ijnurstu.2012.01.002. [DOI] [PubMed] [Google Scholar]
- 9.Almeida APSC, Nunes BP, Duro SMS, Facchini LA. Socioeconomic determinants of access to health services among older adults: A systematic review. Rev Saude Publica. 2017;51:50. doi: 10.1590/S1518-8787.2017051006661. [DOI] [PMC free article] [PubMed] [Google Scholar]
- 10.Terraneo M. Inequities in health care utilization by people aged 50+: Evidence from 12 European countries. Soc Sci Med. 2015;126:154–163. doi: 10.1016/j.socscimed.2014.12.028. [DOI] [PubMed] [Google Scholar]
- 11.Stirbu I, Kunst AE, Mielck A, Mackenbach JP. Inequalities in utilisation of general practitioner and specialist services in 9 European countries. BMC Health Serv Res. 2011;11:288. doi: 10.1186/1472-6963-11-288. [DOI] [PMC free article] [PubMed] [Google Scholar]
- 12.Hoebel J, Rattay P, Prutz F, Rommel A, Lampert T. Socioeconomic Status and Use of Outpatient Medical Care. The Case of Germany. PLoS One. 2016;11:e0155982. doi: 10.1371/journal.pone.0155982. [DOI] [PMC free article] [PubMed] [Google Scholar]
- 13.The World Bank. World Bank Country and Lending Groups. https://datahelpdesk.worldbank.org/knowledgebase/articles/906519-world-bank-country-and-lending-groups. Accessed 11 Dec 2020.
- 14.Kim SY, Park JE, Lee YJ, Seo H-J, Sheen S-S, Hahn S, et al. Testing a tool for assessing the risk of bias for nonrandomized studies showed moderate reliability and promising validity. J Clin Epidemiol. 2013;66:408–414. doi: 10.1016/j.jclinepi.2012.09.016. [DOI] [PubMed] [Google Scholar]
- 15.Abasolo I, Saez M, Lopez-Casasnovas G. Financial crisis and income-related inequalities in the universal provision of a public service: The case of healthcare in Spain. Int J Equity Health. 2017;16:134. doi: 10.1186/s12939-017-0630-y. [DOI] [PMC free article] [PubMed] [Google Scholar]
- 16.Agerholm J, Bruce D, Ponce de Leon A, Burström B. Socioeconomic differences in healthcare utilization, with and without adjustment for need: An example from Stockholm, Sweden. Scand J Public Health. 2013;41:318–325. doi: 10.1177/1403494812473205. [DOI] [PubMed] [Google Scholar]
- 17.Allin S. Does Equity in Healthcare Use Vary across Canadian Provinces? Healthc policy. 2008;3:83–99. [PMC free article] [PubMed] [Google Scholar]
- 18.Asada Y, Kephart G. Equity in health services use and intensity of use in Canada. BMC Health Serv Res. 2007. 10.1186/1472-6963-7-41. [DOI] [PMC free article] [PubMed]
- 19.Bago d'Uva T, Jones AM, van Doorslaer E. Measurement of horizontal inequity in health care utilisation using European panel data. J Health Econ. 2009;28:280–9. 10.1016/j.jhealeco.2008.09.008. [DOI] [PubMed]
- 20.Baron-Epel O, Garty N, Green MS. Inequalities in use of health services among Jews and Arabs in Israel. Health Serv Res. 2007;42:1008–1019. doi: 10.1111/j.1475-6773.2006.00645.x. [DOI] [PMC free article] [PubMed] [Google Scholar]
- 21.Beckman A, Anell A. Changes in health care utilisation following a reform involving choice and privatisation in Swedish primary care: A five-year follow-up of GP-visits. BMC Health Serv Res. 2013;13:452. doi: 10.1186/1472-6963-13-452. [DOI] [PMC free article] [PubMed] [Google Scholar]
- 22.Bergmann E, Kalcklösch M, Tiemann F. [Health care utilisation. Initial results of the Telephone Health Survey 2003]. Bundesgesundheitsbl. 2005;48:1365–73. doi:10.1007/s00103-005-1167-6. [DOI] [PubMed]
- 23.Bourke J. Income-related inequalities and inequities in Irish healthcare utilization. Expert Rev Pharmacoecon Outcomes Res. 2009;9:325–331. doi: 10.1586/erp.09.30. [DOI] [PubMed] [Google Scholar]
- 24.Bremer P, Wübker A. [Socio-economic Differences in the Utilisation of Screening Programmes and Health Promotion Measures in North Rhine-Westphalia, Germany]. Prävention und Gesundheitsförderung. 2013;8:15–21. doi:10.1007/s11553-012-0368-8. [DOI] [PubMed]
- 25.Bremer D, Ludecke D, Vonneilich N, von dem Knesebeck O. Social relationships and GP use of middle-aged and older adults in Europe: A moderator analysis. BMJ Open. 2018;8:e018854. 10.1136/bmjopen-2017-018854. [DOI] [PMC free article] [PubMed]
- 26.Crespo-Cebada E, Urbanos-Garrido RM. Equity and equality in the use of GP services for elderly people: The Spanish case. Health Policy. 2012;104:193–199. doi: 10.1016/j.healthpol.2011.10.007. [DOI] [PubMed] [Google Scholar]
- 27.Devaux M, Looper Md. Income-Related Inequalities in Health Service Utilisation in 19 OECD Countries, 2008–2009 2012: OECD. doi:10.1787/5k95xd6stnxt-en.
- 28.Fjaer EL, Balaj M, Stornes P, Todd A, McNamara CL, Eikemo TA. Exploring the differences in general practitioner and health care specialist utilization according to education, occupation, income and social networks across Europe: Findings from the European social survey (2014) special module on the social determinants of health. Eur J Public Health. 2017;27:73–81. doi: 10.1093/eurpub/ckw255. [DOI] [PubMed] [Google Scholar]
- 29.Garrido-Cumbrera M, Borrell C, Palencia L, Espelt A, Rodriguez-Sanz M, Pasarin MI, Kunst A. Social class inequalities in the utilization of health care and preventive services in Spain, a country with a national health system. Int J Health Serv. 2010;40:525–542. doi: 10.2190/HS.40.3.h. [DOI] [PubMed] [Google Scholar]
- 30.Glazier RH, Agha MM, Moineddin R, Sibley LM. Universal health insurance and equity in primary care and specialist office visits: A population-based study. Ann Fam Med. 2009;7:396–405. doi: 10.1370/afm.994. [DOI] [PMC free article] [PubMed] [Google Scholar]
- 31.González Álvarez ML, Barranquero AC. Inequalities in health care utilization in Spain due to double insurance coverage: An Oaxaca-Ransom decomposition. Soc Sci Med. 2009;69:793–801. doi: 10.1016/j.socscimed.2009.06.037. [DOI] [PubMed] [Google Scholar]
- 32.Grasdal AL, Monstad K. Inequity in the use of physician services in Norway before and after introducing patient lists in primary care. Int J Equity Health. 2011;10:25. doi: 10.1186/1475-9276-10-25. [DOI] [PMC free article] [PubMed] [Google Scholar]
- 33.Gruber S, Kiesel M. Inequality in health care utilization in Germany? Theoretical and empirical evidence for specialist consultation. J Public Health (Oxf) 2010;18:351–365. doi: 10.1007/s10389-010-0321-2. [DOI] [Google Scholar]
- 34.Habicht J, Kunst AE. Social inequalities in health care services utilisation after eight years of health care reforms: A cross-sectional study of Estonia, 1999. Soc Sci Med. 2005;60:777–787. doi: 10.1016/j.socscimed.2004.06.026. [DOI] [PubMed] [Google Scholar]
- 35.Hansen AH, Halvorsen PA, Ringberg U, Forde OH. Socio-economic inequalities in health care utilisation in Norway: A population based cross-sectional survey. BMC Health Serv Res. 2012;12:336. doi: 10.1186/1472-6963-12-336. [DOI] [PMC free article] [PubMed] [Google Scholar]
- 36.Hoeck S, Francois G, van der Heyden J, Geerts J, van Hal G. Healthcare utilisation among the Belgian elderly in relation to their socio-economic status. Health Policy. 2011;99:174–82. 10.1016/j.healthpol.2010.08.010. [DOI] [PubMed]
- 37.Hoeck S, van der Heyden J, Geerts J, van Hal G. Equity in GP and specialist contacts by older persons in Belgium. Int J Public Health. 2013;58:593–602. 10.1007/s00038-012-0431-4. [DOI] [PubMed]
- 38.Korda RJ, Banks E, Clements MS, Young AF. Is inequity undermining Australia's 'universal' health care system? Socio-economic inequalities in the use of specialist medical and non-medical ambulatory health care. Aust N Z J Public Health. 2009;33:458–465. doi: 10.1111/j.1753-6405.2009.00430.x. [DOI] [PubMed] [Google Scholar]
- 39.La Parra-Casado D, Mosquera PA, Vives-Cases C, San Sebastian M. Socioeconomic Inequalities in the Use of Healthcare Services: Comparison between the Roma and General Populations in Spain. Int J Environ Res Public Health. 2018. 10.3390/ijerph15010121. [DOI] [PMC free article] [PubMed]
- 40.Lichte KJ. [Frequent use of domestic doctors in a regional comparison: associations with sociodemographic factors, morbidity and practice factors - Results of a quantitative study in northern Germany] 2017.
- 41.Lostao L, Regidor E, Gimeno D, Netuveli G, Blane D. Socioeconomic patterns in health services use in Great Britain and Spain before and after the health system reforms of the 1990s. Health Place. 2011;17:830–835. doi: 10.1016/j.healthplace.2011.03.006. [DOI] [PubMed] [Google Scholar]
- 42.Lu JR, Leung GM, Kwon S, Tin KYK, van Doorslaer E, O'Donnell O. Horizontal equity in health care utilization evidence from three high-income Asian economies. Soc Sci Med. 2007;64:199–212. 10.1016/j.socscimed.2006.08.033. [DOI] [PubMed]
- 43.Masseria C, Giannoni M. Equity in access to health care in Italy: A disease-based approach. Eur J Public Health. 2010;20:504–510. doi: 10.1093/eurpub/ckq029. [DOI] [PubMed] [Google Scholar]
- 44.McDonald JT, Conde H. Does geography matter? The health service use and unmet health care needs of older Canadians. Can J Aging. 2010;29:23–37. doi: 10.1017/S0714980809990389. [DOI] [PubMed] [Google Scholar]
- 45.Mosquera PA, Waenerlund A-K, Goicolea I, Gustafsson PE. Equitable health services for the young? A decomposition of income-related inequalities in young adults' utilization of health care in Northern Sweden. Int J Equity Health. 2017;16:20. doi: 10.1186/s12939-017-0520-3. [DOI] [PMC free article] [PubMed] [Google Scholar]
- 46.Nolan A. A dynamic analysis of GP visiting in Ireland: 1995–2001. Health Econ. 2007;16:129–43. doi:10.1002/hec.1149. [DOI] [PubMed]
- 47.Palencia L, Espelt A, Rodriguez-Sanz M, Rocha KB, Pasarin MI, Borrell C. Trends in social class inequalities in the use of health care services within the Spanish National Health System, 1993–2006. Eur J Health Econ. 2013;14:211–219. doi: 10.1007/s10198-011-0362-7. [DOI] [PubMed] [Google Scholar]
- 48.Polluste K, Kalda R, Lember M. Accessibility and use of health services among older Estonian population. Cent Eur J Public Health. 2009;17:64–70. doi: 10.21101/cejph.a3509. [DOI] [PubMed] [Google Scholar]
- 49.Rattay P, Butschalowsky H, Rommel A, Prütz F, Jordan S, Nowossadeck E, et al. Utilization of outpatient and inpatient health services in Germany. Results of the German Health Interview and Examination Survey for Adults (DEGS1). Bundesgesundheitsbl. 2013;56:832–44. doi:10.1007/s00103-013-1665-x. [DOI] [PubMed]
- 50.Regidor E, Martinez D, Calle ME, Astasio P, Ortega P, Dominguez V. Socioeconomic patterns in the use of public and private health services and equity in health care. BMC Health Serv Res. 2008;8:183. doi: 10.1186/1472-6963-8-183. [DOI] [PMC free article] [PubMed] [Google Scholar]
- 51.Reibling N, Wendt C. [Access to health care by level of education. A comparative analysis of access regulation and utilisation of specialist healthcare in Europe]. Gesundheitswesen. 2010;72:447–54. doi:10.1055/s-0029-1234101. [DOI] [PubMed]
- 52.Rogowski J, Freedman VA, Wickstrom SL, Adams J, Escarce JJ. Socioeconomic disparities in medical provider visits among medicare managed care enrollees. Inquiry. 2008;45:112–129. doi: 10.5034/inquiryjrnl_45.01.112. [DOI] [PubMed] [Google Scholar]
- 53.Ryvicker M, Gallo WT, Fahs MC. Environmental factors associated with primary care access among urban older adults. Soc Sci Med. 2012;75:914–921. doi: 10.1016/j.socscimed.2012.04.029. [DOI] [PMC free article] [PubMed] [Google Scholar]
- 54.San Sebastian M, Mosquera PA, Ng N, Gustafsson PE. Health care on equal terms? Assessing horizontal equity in health care use in Northern Sweden. Eur J Public Health. 2017;27:637–643. doi: 10.1093/eurpub/ckx031. [DOI] [PubMed] [Google Scholar]
- 55.Schnitzer S, Balke K, Walter A, Litschel A, Kuhlmey A. Do gatekeeping programs increase equality of health care in Germany? A comparison of the health care situation of participants and nonparticipants. Bundesgesundheitsbl. 2011;54:942–50. doi:10.1007/s00103-011-1317-y. [DOI] [PubMed]
- 56.Schulz M. Do Gatekeeping Schemes Influence Health Care Utilization Behavior Among Patients With Different Educational Background? An Analysis of 13 European Countries. Int J Health Serv. 2016;46:448–464. doi: 10.1177/0020731416654663. [DOI] [PubMed] [Google Scholar]
- 57.Suominen-Taipale AL, Koskinen S, Martelin T, Holmen J, Johnsen R. Differences in older adults' use of primary and specialist care services in two Nordic countries. Eur J Public Health. 2004;14:375–80. doi:10.1093/eurpub/14.4.375. [DOI] [PubMed]
- 58.Tavares LP, Zantomio F. Inequity in healthcare use among older people after 2008: The case of southern European countries. Health Policy. 2017;121:1063–1071. doi: 10.1016/j.healthpol.2017.08.011. [DOI] [PubMed] [Google Scholar]
- 59.Thode N, Bergmann E, Kamtsiuris P, Kurth B-M. Predictors for ambulatory medical care utilization in Germany. Bundesgesundheitsbl. 2005;48:296–306. doi:10.1007/s00103-004-1004-3. [DOI] [PubMed]
- 60.Tille F, Gibis B, Balke K, Kuhlmey A, Schnitzer S. [Sociodemographic and health-related determinants of health care utilisation and access to primary and specialist care: Results of a nationwide population survey in Germany (2006–2016)]. Z Evid Fortbild Qual Gesundhwes. 2017;126:52–65. doi:10.1016/j.zefq.2017.07.012. [DOI] [PubMed]
- 61.van Doorslaer E, Koolman X, Jones AM. Explaining income-related inequalities in doctor utilisation in Europe. Health Econ. 2004;13:629–47. 10.1002/hec.919. [DOI] [PubMed]
- 62.van Doorslaer E, Masseria C, Koolman X. Inequalities in access to medical care by income in developed countries. CMAJ. 2006;174:177–83. doi:10.1503/cmaj.050584. [DOI] [PMC free article] [PubMed]
- 63.van Ourti T. Measuring horizontal inequity in Belgian health care using a Gaussian random effects two part count data model. Health Econ. 2004;13:705–24. 10.1002/hec.920. [DOI] [PubMed]
- 64.Vasquez F, Paraje G, Estay M. Income-related inequality in health and health care utilization in Chile, 2000–2009. Rev Panam Salud Publica. 2013;33:98–106. doi: 10.1590/S1020-49892013000200004. [DOI] [PubMed] [Google Scholar]
- 65.Vedsted P, fink P, Sorensen HT, Olesen F. Physical, mental and social factors associated with frequent attendance in Danish general practice. A population-based cross-sectional study. Soc Sci Med. 2004;59:813–823. doi: 10.1016/j.socscimed.2003.11.027. [DOI] [PubMed] [Google Scholar]
- 66.Vedsted P, Olesen F. Social environment and frequent attendance in Danish general practice. Br J Gen Pract. 2005;55:510–515. [PMC free article] [PubMed] [Google Scholar]
- 67.Vikum E, Bjorngaard JH, Westin S, Krokstad S. Socio-economic inequalities in Norwegian health care utilization over 3 decades: The HUNT Study. Eur J Public Health. 2013;23:1003–1010. doi: 10.1093/eurpub/ckt053. [DOI] [PubMed] [Google Scholar]
- 68.Vikum E, Krokstad S, Westin S. Socioeconomic inequalities in health care utilisation in Norway: The population-based HUNT3 survey. Int J Equity Health. 2012;11:48. doi: 10.1186/1475-9276-11-48. [DOI] [PMC free article] [PubMed] [Google Scholar]
- 69.Wu S, Wang R, Zhao Y, Ma X, Wu M, Yan X, He J. The relationship between self-rated health and objective health status: a population-based study. BMC Public Health. 2013;13:320. doi: 10.1186/1471-2458-13-320. [DOI] [PMC free article] [PubMed] [Google Scholar]
- 70.Dowd JB, Zajacova A. Does self-rated health mean the same thing across socioeconomic groups? Evidence from biomarker data. Ann Epidemiol. 2010;20:743–749. doi: 10.1016/j.annepidem.2010.06.007. [DOI] [PMC free article] [PubMed] [Google Scholar]
- 71.Ulubaşoğlu MA, Cardak BA. International comparisons of rural–urban educational attainment: Data and determinants. Eur Econ Rev. 2007;51:1828–1857. doi: 10.1016/j.euroecorev.2006.11.003. [DOI] [Google Scholar]
- 72.Verlinde E, de LN, de MS, Deveugele M, Willems S. The social gradient in doctor-patient communication. Int J Equity Health. 2012;11:12. doi: 10.1186/1475-9276-11-12. [DOI] [PMC free article] [PubMed] [Google Scholar]
- 73.Schröder SL, Fink A, Richter M. Socioeconomic differences in experiences with treatment of coronary heart disease: A qualitative study from the perspective of elderly patients. BMJ Open. 2018;8:e024151. doi: 10.1136/bmjopen-2018-024151. [DOI] [PMC free article] [PubMed] [Google Scholar]
- 74.Hoebel J, Rommel A, Schröder SL, Fuchs J, Nowossadeck E, Lampert T. Socioeconomic Inequalities in Health and Perceived Unmet Needs for Healthcare among the Elderly in Germany. Int J Environ Res Public Health. 2017;14:1127. doi: 10.3390/ijerph14101127. [DOI] [PMC free article] [PubMed] [Google Scholar]
- 75.Bhandari A, Wagner T. Self-reported utilization of health care services: improving measurement and accuracy. Med Care Res Rev. 2006;63:217–235. doi: 10.1177/1077558705285298. [DOI] [PubMed] [Google Scholar]
Associated Data
This section collects any data citations, data availability statements, or supplementary materials included in this article.
Supplementary Materials
Additional file 1. Search Strategy. Search strategy used to identify articles in the Medline and Web of Science database including search terms, search strings, and filters.
Additional file 2. Figures of additional results. Figures of the results on socioeconomic differences in the probabilities of utilizing primary-care and specialist physicians (a) subdivided for the different time periods of utilization; (b) subdivided for the different measures of socioeconomic status.
Additional file 3. Results of the risk of Bias evaluation for (a) each article included; (b) each of each of the six domains of the risk of bias assessment.
Data Availability Statement
Not applicable.