

Abstract
Background
Monitoring the adaptive immune responses during the natural course of severe acute respiratory syndrome coronavirus-2 (SARS-CoV-2) infection provides useful information for the development of vaccination strategies against this virus and its emerging variants. We thus profiled the serum anti-SARS-CoV-2 antibody (Ab) levels and specific memory B and T cell responses in convalescent coronavirus disease 2019 (COVID-19) patients.
Methods
A total of 119 samples from 88 convalescent donors who experienced mild to critical disease were tested for the presence of elevated anti-spike and anti-receptor binding domain Ab levels over a period of 8 months. In addition, the levels of SARS-CoV-2 neutralizing Abs and specific memory B and T cell responses were tested in a subset of samples.
Findings
Anti-SARS-CoV-2 Abs were present in 85% of the samples collected within 4 weeks after the onset of symptoms in COVID-19 patients. Levels of specific immunoglobulin M (IgM)/IgA Abs declined after 1 month, while levels of specific IgG Abs and plasma neutralizing activities remained relatively stable up to 6 months after diagnosis. Anti-SARS-CoV-2 IgG Abs were still present, although at a significantly lower level, in 80% of the samples collected at 6–8 months after symptom onset. SARS-CoV-2-specific memory B and T cell responses developed with time and were persistent in all of the patients followed up for 6–8 months.
Conclusions
Our data suggest that protective adaptive immunity following natural infection of SARS-CoV-2 may persist for at least 6–8 months, regardless of disease severity. Development of medium- or long-term protective immunity through vaccination may thus be possible.
Funding
This project was supported by the European Union’s Horizon 2020 research and innovation programme (ATAC, no. 101003650), the Italian Ministry of Health (Ricerca Finalizzata grant no. GR-2013-02358399), the Center for Innovative Medicine, and the Swedish Research Council. J.A. was supported by the SciLifeLab/KAW national COVID-19 research program project grant 2020.
Keywords: SARS-CoV-2, COVID-19, immunity, antibody, T cell, B cell, immunological memory, longevity of immune response, IgG, neutralizing antibody
Graphical abstract

Context and significance
Studies on the longevity of the adaptive immune response in convalescent coronavirus disease 2019 (COVID-19) patients may facilitate the understanding of how immune protection develops and persists during the natural course of severe acute respiratory syndrome coronavirus-2 (SARS-CoV-2) infection and thus provide useful information for the evaluation of vaccines against this emerging virus. Although the serum levels of anti-SARS-CoV-2 immunoglobulin G (IgG) antibodies declined significantly 6 months after infection, virus-specific T and/or memory B cell responses developed and were maintained at a relatively high level 6–8 months after the onset of symptoms in the majority of convalescent patients. These data suggest that protective adaptive immunity following natural infection of SARS-CoV-2 may persist for at least 6–8 months.
In this study, Sherina et al. showed that although the SARS-CoV-2-specific antibody levels decreased over time, the majority of tested COVID-19 patients developed and maintained virus-specific B and T cell memory up to at least 6–8 months following infection, regardless of the disease severity.
Introduction
The emergence and spread of severe acute respiratory syndrome coronavirus-2 (SARS-CoV-2) has led to a pandemic with a major impact on global health. The genome of this novel coronavirus encodes 4 major structural proteins, including the spike (S) protein, nucleoprotein (N), membrane (M) protein, envelope (E) protein, and other proteins (ORF3a, ORF7a).1 A robust adaptive immune response with presence of S-specific neutralizing antibodies (Abs), memory B cells, and circulating follicular helper T cells have been found in patients who have recovered from the infection.2, 3, 4 Furthermore, a large number of S protein receptor-binding domain (RBD)-specific monoclonal Abs have been isolated from convalescent patients and been tested in animal models3 , 5 , 6 and clinical trials for the development of potential passive immunotherapy.7, 8, 9 It is, however, still unclear how long the adaptive immunity to SARS-CoV-2 lasts after the natural infection, and furthermore, whether the Ab titer is a marker for protective immunity. A relationship between a humoral immune response to SARS-CoV-2 infection and protection against reinfection has been shown in rhesus macaques,10 but remains to be determined in humans. While a recent study in Iceland showed that the Ab response was maintained in 90% of convalescent patients for >4 months after onset of the disease,11 other studies have suggested a rapid decay of anti-SARS-CoV-2 immunoglobulin G (IgG) in individuals with mild illness.12 , 13 Nevertheless, long-lived memory T and B cells could be present and reactivated following a second exposure, thus providing immune protection.
Studies on the longevity of the adaptive immune response in convalescent coronavirus disease 2019 (COVID-19) patients may facilitate the understanding of how immune protection develops and persists during the natural course of SARS-CoV-2 infection and provide useful information for the development and evaluation of vaccines against this emerging virus. In this study, we aimed to assess the dynamics and longevity of the SARS-CoV-2-specific immune responses in COVID-19 patients with a broad spectrum of disease scores. The levels and Ig class of SARS-CoV-2-specific Abs and development of memory B and T cells were evaluated in samples collected from 88 patients at different time points (TPs) during a period of 8 months following initial symptoms.
Results
The dynamics of the anti-SARS-CoV-2 Ab response in COVID-19 patients
To evaluate the Ab response to SARS-CoV-2, 119 serum or plasma samples from 88 COVID-19 patients (78 from Italy and 10 from Sweden; Figure 1 ; Tables 1 and S1) were tested by an in-house enzyme-linked immunosorbent assay (ELISA) for the presence of anti-S and anti-RBD Abs (for details, see Method details). We examined the SARS-CoV-2-specific IgM, IgA, and IgG Abs in 55 samples from COVID-19 patients collected during the early phases of recovery (between 7 and 28 days after the onset of disease symptoms) and 108 historical controls (samples collected before the SARS-CoV-2 pandemic). Significantly higher levels of anti-S and anti-RBD IgM, IgA, and IgG Abs (p < 0.0001 for all groups) were detected in patients as compared to historical controls (Figures 2 A–2C). Anti-S IgM, IgA, and IgG levels were increased in 76%, 78%, and 85% of patients, respectively. A similar proportion of patients had elevated anti-RBD IgM, IgA, and IgG levels, with 67%, 62%, and 85% being positive, respectively. Titers of anti-S and anti-RBD Abs were highly correlated for all isotypes (r = 0.88 for IgM, r = 0.77 for IgA, r = 0.95 for IgG) (Figures 2D–2F).
Figure 1.

Flowchart illustrating the study design.
Table 1.
Summary of demographic and clinical characteristics in COVID-19+ individuals
| Italian cohort | Swedish cohort | |
|---|---|---|
| Demographics | ||
| No. | 78 | 10 |
| Age, y, median (range) | 63.0 (32–89) | 53.5 (29–75) |
| Male, % | 58 (45/78) | 50 (5/10) |
| Female, % | 42 (33/78) | 50 (5/10) |
| Disease severity, % | ||
| Mild | 6 (5/78) | 100 (10/10) |
| Moderate | 21 (16/78) | 0 (0/10) |
| Severe | 67 (52/78) | 0 (0/10) |
| Critical | 6 (5/78) | 0 (0/10) |
| Symptoms, % | ||
| Fever | 96 (75/78) | 40 (4/10) |
| Cough | 67 (52/78) | 40 (4/10) |
| Dyspnea | 47 (37/78) | 0 (0/10) |
| Asthenia | 12 (9/78) | 60 (6/10) |
| Diarrhea | 9 (7/78) | 0 (0/10) |
| Anosmia | 4 (3/78) | 50 (5/10) |
| Hypoxia | 1 (1/78) | 0 (0/10) |
| Medical history, % | ||
| Hypertension | 51 (40/78) | 0 (0/10) |
| Diabetes | 21 (16/78) | 0 (0/10) |
| Heart diseases | 15 (12/78) | 0 (0/10) |
| Obesity | 13 (10/78) | 0 (0/10) |
| HCV | 10 (8/78) | 0 (0/10) |
| Lung diseases | 5 (4/78) | 0 (0/10) |
| Tumor | 5 (4/78) | 0 (0/10) |
| Other comorbidities | 41 (32/78) | 10 (1/10) |
| >1 comorbidity | 49 (38/78) | 0 (0/10) |
| >2 comorbidities | 29 (23/78) | 0 (0/10) |
| Severity, % | ||
| Oxygen therapy | 73 (57/78) | 0 (0/10) |
| ICU | 6 (5/78) | 0 (0/10) |
HCV, hepatitis C virus; ICU, intensive care unit. See also Table S1.
Figure 2.

Anti-SARS-CoV-2 antibody response in COVID-19 patients
(A–C) Levels of anti-S and anti-RBD IgM, IgA, and IgG antibodies in historical controls and COVID-19 patients.
(D–F) Correlation between titers of anti-S and anti-RBD IgM, IgA, and IgG.
Antibodies were measured in 55 samples from COVID-19 patients collected during early phases of recovery (between 7 and 28 days after onset of disease symptoms) and 108 historical controls (before the SARS-CoV-2 pandemic). Symbols represent individual subjects; horizontal black lines indicate the median. The dashed red line indicates the cutoff value for elevated anti-S and anti-RBD antibody levels (2.5 and 8.4 AU/mL for IgM, 0.5 and 0.08 AU/mL for IgA, and 0.03 and 14.81 AU/mL for IgG, respectively) defined using receiver operating characteristic (ROC) curves, based on the antibody responses in historical controls (n = 108) and COVID-19 patients (n = 55).
Percentages in (A)–(C) show the frequency of antibody-positive individuals. Mann-Whitney U test (A–C) and Spearman’s rank correlation (D–F). ∗∗∗∗p < 0.0001.
Based on the symptoms presented at the time of COVID-19 diagnosis, patients were given a disease score ranging from mild to moderate to severe to critical (see Method details). Analysis of anti-SARS-CoV-2 Ab levels did not show statistically significant differences in patients presenting with severe and critical disease scores compared to mild or moderate disease groups (p = 0.1444 and p = 0.2943 for anti-S IgG, p = 0.1203 and p = 0.4672 for anti-RBD IgG) (Figures 3A and 3B). Notably, in 6 patients (11%), rather low levels or even an absence of anti-S and anti-RBD IgM, IgA, and IgG Abs were observed. Sera from these individuals were obtained at median day 10.5 after symptom onset (range 7–22). A second sample taken at a later TP was available for 2 of these patients (86 and 226 days after symptom onset), in which both had become anti-S and anti-RBD IgG+. For the other 4 samples (7%), no second sample was available for analysis. These 4 individuals had a higher median age (79 years) compared to the entire patient cohort (62 years), had severe disease scores, and 2 of them later died from COVID-19 complications. When patients were divided based on sex, no statistically significant differences were observed in anti-S and anti-RBD Ab levels for all isotypes, except for anti-RBD IgG, in which significantly higher levels were present in males compared to females with severe/critical disease scores (p = 0.0306) (Figures 3C and 3D).
Figure 3.

Anti-SARS-CoV-2 antibody responses in COVID-19 patients with different disease scores
Levels of anti-S and anti-RBD IgM, IgA, and IgG antibodies according to disease severity (A and B) and sex (C and D). Symbols represent individual subjects; horizontal black lines indicate the median. The dashed red line indicates the cutoff value for elevated anti-S and anti-RBD antibody levels (same as in Figure 2). Mann-Whitney U test. ∗p < 0.05. No statistically significant difference (p > 0.05) was observed in the level of anti-S (A) and anti-RBD (B) between patients presenting with severe and critical disease scores compared to mild (p = 0.1444 and p = 0.2943 for anti-S IgG, respectively) or moderate disease groups (p = 0.1203 and p = 0.4672 for anti-RBD IgG, respectively).
To examine the longevity of the anti-SARS-CoV-2 Ab response, we subsequently analyzed all 119 samples from the 88 patients collected at different TPs (7–240 days after symptom onset). Anti-S and anti-RBD Ab levels were significantly increased already 7–14 days after symptom onset (p < 0.0001 for all isotypes) and reached maximum at days 15–28 (Figure 4 ) (days 7–14 to days 15–28, p = 0.0087 and p = 0.0309 for IgM, p = 0.0080 and p = 0.0029 for IgA, p = 0.0159 and p = 0.0049 for IgG). After day 28, a significant decrease in anti-S and anti-RBD IgM and IgA Ab levels was observed (days 15–28 to days 29–90, p = 0.0184 for anti-RBD IgA; days 15–28 to days 91–180, p < 0.0001 for anti-S and anti-RBD IgM and IgA; days 15–28 to days 181–240, p < 0.0001 for anti-S and anti-RBD IgM and IgA). No significant decrease in anti-S and anti-RBD IgG levels was present by days 91–180 (days 15–28 to days 91–180, p = 0.1847 and p = 0.0544, respectively); however, a significant decline was observed by days 181–240 (days 15–28 to days 181–240, p = 0.0003 and p = 0.0002, respectively). Importantly, a prominent anti-SARS-CoV-2 IgG response was still present in 80% (12/15) of the patients who were followed 181–240 days (6–8 months) after the onset of symptoms. These patients had mild (n = 5), moderate (n = 2), and severe (n = 5) disease scores at the time of diagnosis.
Figure 4.
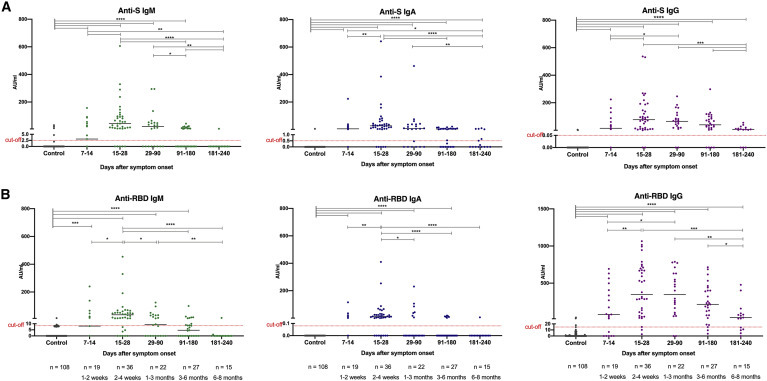
Longevity of the anti-SARS-CoV-2 antibody response in COVID-19 patients
Anti-S and anti-RBD IgM, IgA, and IgG antibody response in COVID-19 patients during the time following diagnosis and recovery (A and B). In total, 119 samples were collected from 88 patients. Samples were taken at 5 study periods: 7–14 days (n = 19), 15–28 days (n = 36), 29-90 days (n = 22), 91–180 days (n = 27), and 181–240 days (n = 15) after symptom onset. Symbols represent individual subjects; horizontal black lines indicate the median. The dashed red line indicates the cutoff value for elevated anti-S and anti-RBD antibody levels (same as in Figure 2). Significant differences between the groups were marked by bars on the top. Mann-Whitney U test. ∗p ≤ 0.05, ∗∗p ≤ 0.001, ∗∗∗p ≤ 0.001, and ∗∗∗∗p < 0.0001.
See also Figure S1.
To further evaluate the dynamics of the anti-SARS-CoV-2 Ab response, we compared the Ab levels in paired samples from 27 patients. The first sample (TP1) was taken at median day 21 (range 7–64) after the onset of symptoms, and the paired second sample (TP2) was taken at median day 126 (range 57–234). This analysis showed a significant decrease in anti-S IgM and IgA levels (p < 0.0001 and p = 0.0008, respectively), as well as in anti-RBD IgM and IgA levels (p = 0.0002 and p = 0.0052, respectively) in the paired second samples (Figure 5 ). No significant decline in anti-S and anti-RBD IgG levels, however, was observed (p = 0.1551).
Figure 5.

Dynamics of the anti-SARS-CoV-2 antibody levels in paired samples from COVID-19 patients
Levels of anti-S (A–C) and anti-RBD (D–F) IgM, IgA, and IgG antibodies in 27 pairs of COVID-19 patients measured at time point 1 (TP1, median day 21, range 7–64) and TP2 (median day 126, range 57–234) and presented on a group (left panel) or an individual (right panel) level. Symbols represent individual subjects; horizontal black lines indicate the median. The gray area under the curve (right panels) shows the distribution of antibody decay rates estimated by 2-phase exponential association. Wilcoxon signed-rank test. ∗∗p ≤ 0.001 and ∗∗∗p ≤ 0.001.
Finally, the SARS-CoV-2 neutralizing (NT)-Ab levels were measured by a microneutralization test (for details, see Method details) in 96 samples. The NT-Ab titers correlated with the levels of anti-S IgM (r = 0.42), anti-S IgA (r = 0.36), and anti-S IgG (r = 0.46), as well as with the levels of anti-RBD IgM (r = 0.38), anti-RBD IgA (r = 0.21), and anti-RBD IgG (r = 0.42) (Figures S1A and S1B). Similar to the dynamic of anti-S and anti-RBD Abs, the plasma neutralizing activities reached a maximum at days 15–28 (Figures S1C and S1D). Furthermore, similar to the IgG isotype, the NT-Ab titers remained stable up to 91–180 days post-infection, but declined significantly although still present at 181–240 days (Figures S1C and S1D). These data suggest that an anti-SARS-CoV-2 Ab response was induced in a majority of COVID-19 patients in our study cohort, and although IgM and IgA Abs rapidly declined, IgG Abs and plasma neutralizing activity remained present, albeit at lower levels, for at least 6–8 months after diagnosis.
Induction of SARS-CoV-2-specific memory B and T cells
To address the question of whether SARS-CoV-2-specific memory B and T cells were generated and how long the B and T cell-mediated responses persist in COVID-19 convalescent individuals, we analyzed 32 peripheral blood mononuclear cell (PBMC) samples collected from 24 patients (mild = 11, moderate = 4, severe = 8, critical = 1; Table S1). A total of 17 patients were sampled at a single time, whereas 6 patients had samples collected at 2 TPs and 1 at 3 TPs. We further divided samples into 3 groups based on the TPs (collected at 14–35 days, 85–180 days, and 181–236 days post-onset of symptoms, ∼2–4 weeks, 3–6 months, and 6–8 months, respectively). No, or a negligible number of B cells secreting RBD-specific IgG Abs were detected by ELISpot (for details, see Method details) in samples from 4 healthy individuals and 7 pre-pandemic buffy coats. Using the highest value observed from all of the negative controls as a cutoff, RBD-specific IgG-producing B cells were detected in 33% (2/6), 93% (14/15), and 100% (11/11) of the patient samples collected at 2–4 weeks, 3–6 months, and 6–8 months after the onset of symptoms, respectively (Figure 6 A). Compared to the early TP samples, the number of RBD-specific IgG-producing cells was significantly higher in the latter TP groups (p = 0.0001 and p = 0.0006, for 3–6 or 6–8 months versus 2–4 weeks, respectively) (Figure S2A; Table S2). The B cell response seemed to reach a maximum at 3–6 months post-infection, although there was no significant decrease observed at 6–8 months (Figures 6B and S2A, p = 0.1982; Table S2). Furthermore, no significant difference was observed for the number of specific B cells among patients with different disease scores (Figure S3A; Table S3). Thus, although the decline in anti-RBD IgG levels was observed over time, SARS-CoV-2-specific memory B cells developed and remained present in almost all of the patients followed up until the latest date of the study, regardless of the disease severity (Figures 6A, 6B, S2A, S2B, S3A, and S3B).
Figure 6.

SARS-CoV-2-specific memory B and T cell responses in COVID-19 patients
(A) Number of RBD-specific memory B cells from control (n = 11) and COVID-19 patient (n = 32) samples.
(B and F) Dynamics of RBD-specific memory B cell, SARS-CoV-2-specific T cell, and serum anti-RBD IgG levels in COVID-19 patient samples over time, with the corresponding log-normal fitting curve.
(C–E) Number of T cells specific for the S1, S2N, and S N M O SARS-CoV-2 protein-derived peptide pools and producing IL-2 (C), IFN-γ (D), or IFN-γ and IL-2 (E) in control and COVID-19 patient samples, respectively.
(G) Number of specific memory B cells and IFN-γ/IL-2-producing T cells specific for the S1, S2N, and S N M O protein-derived peptide pools in 7 patients (with mild [CP45], moderate [CP08, CP09], or severe [CP34, CP03, CP19, CP06] disease) at TP1, TP2, and TP3 (for CP06).
The results were expressed as the number of spots per 300,000 seeded cells after subtracting the background spots of the negative control. The red line indicates the median value of the group. The cutoff value was set at the highest number of specific B and T cell spots for the negative controls. Mann-Whitney U test. ∗∗p ≤ 0.01, ∗∗∗p ≤ 0.001, and ∗∗∗∗p ≤ 0.0001.
See also Figures S2–S4 and Tables S2 and S3.
Furthermore, while no or a negligible number of interleukin-2 (IL-2), interferon-γ (IFN-γ), or IL-2/IFN-γ-producing T cells against 3 SARS-CoV-2-derived peptide pools were detected by a FluoroSpot assay (for details, see Method details) in the negative controls, such T cells were observed at a level above the cutoff in 17%–100% of the patient samples tested, depending on the peptide pool tested (S1, S2 N, or S N M O protein derived) and in which cytokines were analyzed (Figures 6C–6E). In 2 patients, a high number of IFN-γ- and/or IL-2-producing T cells was also detected in the control culture without adding the SARS-CoV-2 peptides, which may suggest ongoing inflammation. Overall, a T cell response against at least one of the SARS-CoV-2 peptide pools was detectable in all of the patients (n = 6) tested at the early TP (2–4 weeks), and the response was maintained in the vast majority of patients analyzed at the later TPs (93% [14/15] and 100% [11/11] at 3–6 or 6–8 months after the onset of symptoms, respectively). Notably, the only patient who had no T cell response at 4 months had a detectable memory B cell response. Compared to the early TP samples, the number of S1-specific IL-2, IFN-γ, and IL-2/IFN-γ-producing T cells was significantly higher in the later TP samples, especially those collected at 6–8 months after the onset of infection (p = 0.0047, p = 0.0033, and p = 0.0019, respectively; Figures S2C–S2E; Table S2). Similar results were observed for the S N M O, but not the S2 peptide pool-specific T cells. No statistically significant differences were observed for the number of cytokine-producing T cells for all 3 peptide pools among patients with different disease scores (p > 0.05; Figures 3C–3E; Table S3). While anti-RBD IgG levels decreased over time, SARS-CoV-2-specific T cells, in addition to specific memory B cells, were also generated and remained present in the vast majority of patients followed to date, regardless of disease severity (Figure 6F).
To further investigate the dynamics of virus specific B and T cell responses, patients with samples from at least 2 TPs were analyzed separately (Figure 6G). In 6 of the 7 patients, there was an increase in the number of virus-specific B and T cells at the second TP (TP1 = 14–116 days, TP2 = 124–236 days; Figure 6G). In the remaining patient (Convalescent Patient [CP]19), there was a slight decrease in virus-specific B and T cells at TP2 (TP1 = 122 days, TP2 = 228 days).
Finally, for patients who have been evaluated for SARS-CoV-2-specific adaptive immunity in all assays (i.e., virus-specific Abs, memory B and T cells), we have plotted normalized log2 values of levels of anti-RBD-specific IgM, IgA, and IgG, number of RBD-specific IgG-producing B cells, and S1 peptide pool-specific IL-2 and/or IFN-γ-producing T cells for each individual (Figure S4). Samples with different TPs from the same individual were plotted together with different color codes (Figure S4). Although most samples presented a unique pattern, 6 and 17 of the 24 patients have developed 2 or all “arms” of adaptive immunity at variable levels, in at least 1 TP, and the remaining single patient had only memory B cells detected (CP10, sampled at 126 days). In patients with samples from >1 TP, a clear shift from the production of specific Abs, including IgM/IgA at the early TP, to the generation of memory B and T cells at the later TP(s) was observed (Figure S4). Although having individual differences, SARS-CoV-2-specific memory B and T cells were generated and maintained in the vast majority of tested convalescent COVID-19 patients, regardless of the initial disease severity, suggesting that the adaptive immunity against SARS-CoV-2 during the natural course of infection is maintained at least for 6–8 months.
Discussion
In the present study, we measured anti-S and anti-RDB IgM, IgA, and IgG Ab levels using normalization against a serially diluted highly positive reference serum pool and by setting a cutoff value based on historical control samples. Our data showed that an anti-SARS-CoV-2 Ab response was present in the majority of COVID-19 patients as early as 2 weeks after onset of symptoms, and the level of anti-S and anti-RDB IgG remained relatively stable up to 6 months after diagnosis, followed by a significant decline at months 6–8, while a decrease in anti-S and anti-RDB IgM and IgA levels was observed already between 1 and 3 months after the onset of disease. Our results are in line with previous studies showing a similar longevity and pattern of anti-SARS-CoV-2 Ab responses, with Ab levels reaching a peak at 23 days following symptom onset and being maintained for at least 4 months,11 , 14, 15, 16, 17, 18, 19, 20 yet contradictory to others, in which a low prevalence and rapid decay (within 3 months) of anti-SARS-CoV-2 Abs in COVID-19 patients with either mild or severe disease were observed.12 , 21 In agreement with other reports, we also observed higher anti-RBD IgG Ab titers in males who were more severely affected by SARS-CoV-2 infection, while 7% of patients with a severe disease score in our study did not develop or had extremely low levels of Abs, suggesting that they mounted a weaker antiviral immune response.11 , 13 , 21 Higher levels of specific Abs, or the other end of spectrum (i.e., absence of specific Abs), in individuals with severe diseases and in male patients may be due to a higher viral load, longer duration of viral shedding,22 , 23 or other host/genetic factors.24 , 25
Previously reported conflicting findings in the prevalence and longevity of anti-SARS-CoV-2 Ab response may result from an absence of a standard assay to measure anti-SARS-CoV-2 Abs, as a majority of reported studies are based on using different types of SARS-CoV-2 antigens (RBD, S or N proteins). The discrepant results between studies could also be explained by the differences between COVID-19 cohorts, as the number of patients included the sample collection TPs, the treatment used, and the age and sex of study subjects all could affect the analysis.26 Furthermore, the use of negative controls and setting of cutoffs may also contribute to the differences among studies. In our study, we have tested patients with both mild and severe disease, using the RBD and S antigens and compared the patients to historical controls (pre-pandemic samples) and set the cutoffs accordingly. Under these conditions, we demonstrated that the level of anti-S and anti-RDB IgG remained relatively stable—in other words, no significant decline up to 6 months after diagnosis, regardless of disease severity. Although the protective role of Abs against SARS-CoV-2 remains uncertain, in agreement with previous reports, we observed that the levels of anti-RBD Abs correlated with the plasma neutralization activity.17 , 19 , 27 A recent study suggested that despite the anti-RBD, S2, and N protein Ab levels declining over the 6- to 8-month period, the neutralizing titers showed an insignificant decay.28 In our study, the decline in anti-RBD and anti-S IgG Abs observed after 6 months was paralleled by a corresponding decrease in neutralization titers, which is in agreement with another recent report.32 It is important to point out that in both cases, the anti-RBD Abs and plasma neutralizing activity were reduced but remained detectable 6 months after the infection. While our study cohort is relatively small, the inclusion of Italian and Swedish patients with a different spectrum of disease and the long follow-up time (up to 6–8 months) can help to solve the current debate about the persistence of SARS-CoV-2-specific Abs. It has been reported that Abs against the 2 other coronaviruses, SARS-CoV and Middle Eastern respiratory syndrome (MERS)-CoV, could still be detected 1–3 years after infection onset,22 suggesting that SARS-CoV-2-specific Abs may be present for an even longer period than we have observed thus far.
Studies reported up to now have mainly been focused on the longevity of the specific antiviral Ab response. However, the development of memory B and T cell is critical for long-term protection, and the longitudinal dynamics of these memory cells remain poorly resolved. Our results show that the majority of patients, irrespective of disease severity, can mount specific memory B cell responses, which remain present at least 6–8 months post-symptom onset. These findings are consistent with recent studies (including preprints) predominantly based on mild to moderate disease cohorts, and where flow cytometry assays were used to measure the RBD-specific memory B cells.18 , 20 , 29, 30, 31, 32 In addition, we showed that these memory B cells could secrete RBD-specific IgG Abs following stimulation.
Previously, it has been shown that S1 and other SARS-CoV-2 protein-derived peptides induce specific T cell responses in patients with mild to severe disease 1–3 months post-symptoms.2 , 29 , 33, 34, 35 More recently, it was also reported (including in preprints) that SARS-CoV-2-specific T cells are maintained at least 6 months following primary infection in all tested COVID-19 patients in predominantly mild to moderate disease cohorts.20 , 36, 37, 38 Our results confirm and extend earlier findings, showing that SARS-CoV-2-specific IL-2 and/or IFN-γ−producing cells are present in a vast majority of samples collected from patients with disease scores ranging from mild to severe. Furthermore, we showed that specific T cell responses were not only detectable but also appeared to be maintained 6–8 months after the onset of disease (the longest follow-up time in the literature). This is somewhat in contrast to recent studies showing that the T cell response declined over the 6- to 8-month period in asymptomatic as well as symptomatic COVID-19 patients.20 , 38 The difference could be explained by the small number of samples included in our study, especially in the early disease phase, and/or the higher proportion of aged and severe patients in our cohort, as SARS-CoV-2-specific T cell response may be stronger and persist longer in patients with severe disease due to a higher viral load and/or longer persistence of viral antigens.20 , 38 Some studies also noted that T cell responses directed against the S and/or M protein of SARS-CoV-2 are present in 25%–50% of unexposed healthy blood donors, which is consistent with a high degree of potentially cross-reactive T cell immunity in the general population.2 , 34 , 35 The reason we did not detect a significant number of cross-reactive T cells against the virus in unaffected controls may be due to different experimental conditions, including the negative controls used and a longer in vitro stimulation with the peptides in some studies39; however, cross-reactive T cells have also been observed in studies using in vitro stimulation for a shorter time (9–24 h).2 , 34 , 35
The detection of memory S1-specific T cells marked by the production of IL-2 and IFN-γ, and the dual production of those cytokines is indicative of induction of T cells with both effector and proliferative potential in vivo. IFN-γ-producing T cells is a hallmark of immunity against intracellular pathogens, and although it was not tested in our study, SARS-CoV-2-specific IFN-γ-producing T cells were previously shown to be of the CD4+ (T helper 1 [Th1]-like) or CD8+ cytotoxic phenotype.2 , 34 It was shown that convalescent patient donors with undetectable Abs against the S1 protein of SARS-CoV-2 had T cell responses more strongly directed against the M than the S1 protein.40 Furthermore, a Th1-biased cellular immune response of S-specific IFN-γ+ CD4+ T cells to pooled S peptides was detected in a majority of monkeys vaccinated with S protein and was associated with the induction of specific and neutralizing anti-S Abs.41 Our results thus suggest that the use of S protein as an immunogen for vaccination has the potential to induce memory T and B cells specific for the S protein and RBD in humans.
Importantly, although serum IgG Ab levels decreased over time in our study, specific memory B and T cells were maintained over the 6- to 8-month period and could contribute to protection from SARS-CoV-2 reinfection.29 , 31 However, the detection of Abs to SARS-CoV-2, including neutralizing Abs, as well as memory B cells and T cells over a long period does not necessarily indicate protective and long-term immunity, and a correlate of protection still needs to be established. Studies on common human coronaviruses show that neutralizing Abs are induced, and a recent report showed that the duration of protective immunity against the common cold coronavirus may last 6–12 months.42 Reinfections with all seasonal coronaviruses usually occur within 3 years,22 and repeat infections are generally associated with milder symptoms and a lower viral load.22 , 43 Single intravenous administration of neutralizing Abs against the spike protein in patients with mild or moderate COVID-19 has been shown to reduce the viral load and a shortened length of hospitalization.8 Furthermore, infection with SARS-CoV-2 and vaccine against the S protein can protect rhesus macaques from a challenge infection.10 It is thus likely that Abs and cell-mediated immunity will decrease the risk of reinfection and attenuate the severity in case of reinfection. We thus plan to expand our cohort and follow it over longer intervals of time to evaluate the maintenance of immunological memory.
In conclusion, the presence of high levels of SARS-CoV-2-specific memory B and T cells in the majority of patients 6–8 months after infection, suggests that immunity after natural infection may be at least transiently protective and that the development of medium- or long-term protective immunity through vaccination may thus be possible. The discovery of T cell reactivity against S protein epitopes and Abs against the RBD domain suggests that vaccine development using the S protein to induce Abs that target the RBD is a plausible approach.33 It is, however, unclear at the moment whether the neutralizing Abs and B and T cell responses developed during earlier waves of infection and current vaccination strategies are protective for the emerging SARS-CoV-2 variants such as 501Y.V2.44 To meet the urgent need for SARS-CoV-2 vaccine development and evaluation, we propose that in addition to the analysis of specific Ab responses and their longevity, the measurement of specific memory B and T cells, the main components of long-term immunity, as well as correlation with protection from reinfection (with the same or different variants), should be considered.
Limitations of study
Our study has certain limitations, including the relatively small patient cohort size (119 samples from 88 patients) and the low number of samples analyzed for T and B cells (32 samples, including paired samples from 7 individuals). Furthermore, the first TP samples mainly included those during the early phase of convalescence (days 14–28 after onset of symptoms), and fewer samples were analyzed for B and T cells between 1 and 3 months after diagnosis. The level of specific T cells measured at an early TP was lower than that previously measured in convalescent patients 1–2 months after onset of symptoms, suggesting that the number of memory cells may increase during this period.34 , 45 In addition, due to the experimental settings, it was not possible to distinguish whether the T cells measured at early TPs were effector or memory cells. To assess the development and persistence of memory B and T cells, a higher number of samples should be evaluated and followed at multiple TPs during the study period, and cell phenotyping should be performed.
STAR★Methods
Key Resources Table
| REAGENT or RESOURCE | SOURCE | IDENTIFIER |
|---|---|---|
| Antibodies | ||
| (HRP)-conjugated goat anti-human IgM | Invitrogen | Cat# A18835; RRID: AB_2535612 |
| (HRP)-conjugated goat anti-human IgA | Jackson | Cat# 109-036-011; RRID: AB_2337592 |
| (HRP)-conjugated goat anti-human IgG | Invitrogen | Cat# A18805; RRID: AB_2535582 |
| Bacterial and virus strains | ||
| SARS-CoV-2 | Patient isolate (Italy) | N/A |
| Biological samples | ||
| Blood samples (convalescent) | Italy, this paper | Table S1 |
| Blood samples (convalescent, healthy) | Sweden, this paper | Table S1 |
| Serum (convalescent, healthy) | Sweden, this paper | Table S1 |
| Buffy coat (healthy donor) | Sweden, this paper | Table S1 |
| Chemicals, peptides, and recombinant proteins | ||
| Ni-NTA resin | Thermofisher | Cat# 88221 |
| 16/600 Superdex 200 kDa | Cytiva | Cat# 28989335 |
| Lymphoprep | Axis-Shield | Cat# 1114547 |
| RNeasy mini kit | QIAGEN | Cat# 74106 |
| imidazoquinoline resiquimod | Mabtech AB | Cat# R848 |
| Tetramethylbenzidine substrate | Sigma | Cat# T0440 |
| Tween 20 | Sigma | Cat# P9416 |
| PBS | Karolinska University Hospital | Cat# MIK3125-1000 |
| BSA | Sigma | Cat# A7906 |
| RPMI1640 | ThermoFisher Scientific | Cat# 61870010 |
| FBS | ThermoFisher Scientific | Cat# 10270106 |
| Penicillin-Streptomycin | ThermoFisher Scientific | Cat# 15140122 |
| SARS-CoV-2 S1 peptide pool | Mabtech AB | Cat# 3629-1 |
| SARS-CoV-2 SNMO peptide pool | Mabtech AB | Cat# 3622-1 |
| SARS-CoV-2 S2N peptide pool | Mabtech AB | Cat# 3620-1 |
| RBD-His recombinant protein | In house, this paper | N/A |
| S1-S2-His recombinant protein | In house, this paper | N/A |
| Critical commercial assays | ||
| RBD ELISpotPLUS (ALP) kit | Mabtech AB | Cat# 3850-4APW-R1-1 |
| Human IFN-γ/IL-2 FluoroSpot PLUS kit | Mabtech AB | Cat# FSP-0102-2 |
| Experimental models: cell lines | ||
| Expi293 | Thermo Fisher Scientific | Cat# A14527; RRID: CVCL_D615 |
| High Five insect cells BTI-TN-5B1-4 | Thermo Fisher Scientific | Cat# B85502; RRID: CVCL_C190 |
| Vero-E6 | ATCC | Cat# CRL-1586; RRID: CVCL_0574 |
| Software and algorithms | ||
| GraphPad Prism 7 and 8 | GraphPad Software | https://www.graphpad.com/ |
| R version 3.6.1 | RStudio | https://rstudio.com/ |
| Other | ||
| High-binding half area flat bottom plates | Corning | Cat# 3690 |
Resource availability
Lead contact
Further information and requests for resources and reagents should be directed to and will be fulfilled by the Lead Contact, Qiang Pan-Hammarström (qiang.pan-hammarstrom@ki.se).
Materials availability
RBD and S1-S2 proteins can be generated and shared on a collaborative basis.
Data and code availability
All relevant data outputs are within the paper and its supplementation information.
Experimental model and subject details
Study design and participants
Screening of COVID-19 patient donors and sample collection were conducted at the Fondazione IRCCS Policlinico San Matteo in Pavia, Italy, a designated medical institution for COVID-19. Study inclusion criteria included subjects over 18 years of age, who were willing and able to provide informed consent, confirmed positivity of SARS-CoV-2 by real-time RT-PCR targeting the E and RdRp genes according to Corman et al. protocols and monitored until two subsequent samples with negative results.46 Between February 28 and October 10, 2020, 78 COVID-19 patients were recruited. Forty-seven donors had blood drawn at one single time point ranging from 7 to 240 days after symptom onset while 28 and 3 donors had blood taken at two or three time points, respectively. Disease severity was defined as mild (non-hospitalized), moderate (hospitalized, with lower respiratory tract infection, with dyspnea or not, but without oxygen support), severe (infectious disease/sub intensive ward with a need for oxygen and/or positive chest computed tomography scan, severe lower tract infections, with any oxygen support) and critical (intensive care unit (ICU) patients, intubated or with extracorporeal membrane oxygenation procedures).
The demographic and clinical characteristics of the patients are summarized in Table 1 and detailed in Table S1. The patients had a median age of 63 years (range 32-89) with 45 (58%) males and 33 (42%) females. The degree of clinical severity of COVID-19 in cohort was mild (n = 5), moderate (n = 16), severe (n = 52) and critical (n = 5). The most common underlying diseases were hypertension 40/78, 51%), diabetes (16/78, 21%), heart disease (12/78, 15%) and obesity (10/78, 13%). The study was performed under the approval of the Institutional Review Board of Policlinico San Matteo (protocol number P_20200029440).
Twelve samples from 10 volunteers from Sweden (median age of 54 years, range 29-75) who had tested PCR- or serology-positive for SARS-CoV-2 and experienced mild symptoms were also included (Tables 1 and S1). Blood samples were collected at 60-238 days after onset of symptoms. The study was approved by the ethics committee in Stockholm (Dnr 2020-02646).
In addition, serum samples from 108 anonymized individuals (16 to 80 years of age), collected before the SARS-CoV-2 pandemic (1995 to 2005) were used as historical negative controls for the ELISA and PBMCs from four healthy controls (median age 41 years, range 39-50) and seven additional buffy coats collected in Sweden before the SARS-CoV-2 pandemic (2011- January 2020) were included as negative controls for the B- and T cell assays. Patients and samples tested in different assays are summarized in a flow chart (Figure 1).
Method details
Detection of antibodies specific to SARS-CoV-2
RBD-His protein was expressed in Expi293 cells and purified on Ni-NTA resin (#88221, Thermo Fisher) followed by size-exclusion chromatography on a Superdex 200 gel filtration column in PBS.47 S1-S2-His (referred as S) protein was expressed baculovirus-free in High Five insect cells48 and purified on HisTrap excel column (Cytiva) followed by preparative size exclusion chromatography on 16/600 Superdex 200 pg column (Cytiva).49
High-binding Corning Half area plates (Corning #3690) were coated over night at 4°C with S or RBD protein (1.7 μg/ml for IgM and IgG; 2.0 μg/ml for IgA) in PBS; washed three times in PBS-Tween (0.05%) and blocked with 2% BSA in PBS for 1h at room temperature. Serum or plasma diluted 1:3200 (S IgM), 1:6400 (S IgG), 1:1600 (S IgA; RBD IgM, IgA, IgG) in 0.1% BSA in PBS, was incubated for 1.5h at room temperature. Plates were then washed and incubated for 1h at room temperature with horseradish peroxidase (HRP)-conjugated goat anti-human IgM (Invitrogen #A18835), goat anti-human IgA (Jackson #109-036-011), or goat anti-human IgG (Invitrogen #A18805), (all diluted 1:15 000 in 0.1% BSA-PBS). Bound antibodies were detected using tetramethylbenzidine substrate (Sigma #T0440). The color reaction was stopped with 0.5M H2SO4. Absorbance was measured at 450nm. Antibody levels were presented as arbitrary units (AU/ml), based on a standard curve made from a serially diluted highly positive serum pool. A cut-off value for antibody positivity was defined for each antigen and isotype using receiver operating characteristic (ROC) curves, based on the antibody responses in historical controls (n = 108) and COVID-19 patients (55 samples collected within 7-28 days after symptom onset). The cut-off value for positivity was set at > 2.5 AU/ml for anti-S IgM, > 0.5 AU/ml for anti-S IgA, > 0.03 AU/ml for anti-S IgG, > 8.4 AU/ml for anti-RBD IgM, > 0.08 AU/ml for anti-RBD IgA, and > 14.8 AU/ml for anti-RBD IgG, giving a specificity of 96% for IgM, 99% for IgA and 97% IgG. A previously described microneutralization assay50 , 51 was used to determine the titers of SARS-CoV-2 NT-abs in 96 samples. The neutralizing titer was the maximum dilution giving a reduction of 90% of the cytopathic effect.
Isolation of PBMCs and RNA
PBMCs were isolated from blood or buffy coat samples by standard density gradient centrifugation using Lymphoprep (Axis-Shield) and were cryopreserved and stored in liquid nitrogen until analysis. Total RNA was extracted from PBMCs by using RNeasy mini kit according to the manufacturer’s protocol (QIAGEN).
B and T cell response to SARS-CoV-2
PBMCs were incubated for four days in RPMI-1640 medium with 10% FCS, supplemented with the TLR7 and TLR8 agonist imidazoquinoline resiquimod (R848, 1 μg/ml; Mabtech AB, Nacka, Sweden), and recombinant human IL-2 (10 ng/ml) for stimulation of memory B cells.52 The ELISpot plates pre-coated with capturing monoclonal anti-human IgG antibodies were incubated with a total of 300 000 or 30 000 pre-stimulated cells per well for detection of RBD-specific IgG and total IgG secreting cells, respectively. The number of B cells secreting IgG antibodies specific for SARS-CoV-2 RBD and cells secreting IgG (total IgG) were measured using the Human IgG SARS-CoV-2 RBD ELISpotPLUS (ALP) kit according to the manufacturer’s protocol (Mabtech AB).
IFN-γ and IL-2 secreting T cells were detected using Human IFN-γ/IL-2 SARS-CoV-2 FluoroSpotPLUS kits according to the manufacture’s protocol (Mabtech AB). The plates pre-coated with capturing monoclonal anti-IFN-γ and anti-IL-2 were incubated overnight in RPMI-1640 medium containing 10% FCS supplemented with a mixture containing the SARS-CoV-2 peptide pool (scanning or defined pools), anti-CD28 (100 ng/ml) and 300 000 cells per well in humidified incubators (5% CO2, 37°C).
The SARS-CoV-2 S1 scanning pool contains 166 peptides from the human SARS-CoV-2 virus (#3629-1, Mabtech AB). The peptides are 15-mers overlapping with 11 amino acids, covering the S1 domain of the S protein (amino acid 13-685). The SARS-CoV-2 S N M O defined peptide pool contains 47 synthetic peptides binding to human HLA, derived from the S, N, M ORF3a and ORF7a proteins (#3622-1, Mabtech AB).45 The SARS-CoV-2 S2 N defined peptide pool contains 41 synthetic peptides binding to human HLA derived from the S and N proteins of the SARS-CoV-2 virus (#3620-1, Mabtech AB).53 Results of ELISpot and Fluorospot assays were evaluated using an IRIS-reader and analyzed by the IRIS software version 1.1.9 (Mabtech AB). The results were expressed as the number of spots per 300 000 seeded cells after subtracting the background spots of the negative control. The cut-off value was set at the highest number of specific B- and T cell spots from the negative controls.
Quantification and statistical analysis
Mann-Whitney U test was used for comparisons between groups in anti-SARS-CoV-2 antibody levels and numbers of specific memory B- and T cells. Correlation analysis was performed using Spearman’s rank correlation. A Wilcoxon signed-rank test was used for comparison paired samples. All analyses and data plotting were performed using GraphPad or R version 3.6.1.
Acknowledgments
We thank all of the patients, blood donors, and clinicians for their contributions. This project was supported by the European Union’s Horizon 2020 research and innovation programme (ATAC, No. 101003650), the Italian Ministry of Health (Ricerca Finalizzata grant no. GR-2013-02358399), the Center for Innovative Medicine and the Swedish Research Council. J.A. was supported by the SciLifeLab/KAW national COVID-19 research program project grant 2020.
Author contributions
N.S. performed the ELISA experiment. A.P., I.C., E.P., A.S., F. Bergami, R.D., H.A., L.D., M. Sachs, and F. Baldanti contributed to patient data curation, sample preparation, and the neutralization assay. L.D., M.K.-B., and S.B.-A. designed and/or performed the ELISpot and FluoroSpot experiments. M.V., M. Sambo, V.Z., R.B., T.O., and F.M. contributed to the enrollment of patients, patient management, and collection of clinical data. J.A., F. Bertoglio, M. Schubert, and M.H. performed the production and purification of proteins. N.S., L.D., H.W., M.K.-B., M.B.-S., J.H., H.A., L.H., H.M., and Q.P.-H. contributed to the analysis and interpretation of data. N.S., H.M., and Q.P.-H. drafted the manuscript. Y.X., L.H., H.M., F.B., and Q.P.-H. conceived and supervised the study.
Declaration of interests
S.B.-A. is a member of the advisory board of Mabtech AB. The other authors declare no competing interests.
Published: February 10, 2021
Footnotes
Supplemental information can be found online at https://doi.org/10.1016/j.medj.2021.02.001.
Supplemental information
References
- 1.Naqvi A.A.T., Fatima K., Mohammad T., Fatima U., Singh I.K., Singh A., Atif S.M., Hariprasad G., Hasan G.M., Hassan M.I. Insights into SARS-CoV-2 genome, structure, evolution, pathogenesis and therapies: structural genomics approach. Biochim. Biophys. Acta Mol. Basis Dis. 2020;1866:165878. doi: 10.1016/j.bbadis.2020.165878. [DOI] [PMC free article] [PubMed] [Google Scholar]
- 2.Grifoni A., Weiskopf D., Ramirez S.I., Mateus J., Dan J.M., Moderbacher C.R., Rawlings S.A., Sutherland A., Premkumar L., Jadi R.S., et al. Targets of T cell responses to SARS-CoV-2 coronavirus in humans with COVID-19 disease and unexposed individuals. Cell. 2020;181:1489–1501.e15. doi: 10.1016/j.cell.2020.05.015. [DOI] [PMC free article] [PubMed] [Google Scholar]
- 3.Juno J.A., Tan H.-X., Lee W.S., Reynaldi A., Kelly H.G., Wragg K., Esterbauer R., Kent H.E., Batten C.J., Mordant F.L., et al. Humoral and circulating follicular helper T cell responses in recovered patients with COVID-19. Nat. Med. 2020;26:1428–1434. doi: 10.1038/s41591-020-0995-0. [DOI] [PubMed] [Google Scholar]
- 4.Robbiani D.F., Gaebler C., Muecksch F., Lorenzi J.C.C., Wang Z., Cho A., Agudelo M., Barnes C.O., Gazumyan A., Finkin S., et al. Convergent antibody responses to SARS-CoV-2 in convalescent individuals. Nature. 2020;584:437–442. doi: 10.1038/s41586-020-2456-9. [DOI] [PMC free article] [PubMed] [Google Scholar]
- 5.Hassan A.O., Case J.B., Winkler E.S., Thackray L.B., Kafai N.M., Bailey A.L., McCune B.T., Fox J.M., Chen R.E., Alsoussi W.B., et al. A SARS-CoV-2 infection model in mice demonstrates protection by neutralizing antibodies. Cell. 2020;182:744–753.e4. doi: 10.1016/j.cell.2020.06.011. [DOI] [PMC free article] [PubMed] [Google Scholar]
- 6.Rogers T.F., Zhao F., Huang D., Beutler N., Burns A., He W.-T., Limbo O., Smith C., Song G., Woehl J., et al. Isolation of potent SARS-CoV-2 neutralizing antibodies and protection from disease in a small animal model. Science. 2020;369:956–963. doi: 10.1126/science.abc7520. [DOI] [PMC free article] [PubMed] [Google Scholar]
- 7.DeFrancesco L. COVID-19 antibodies on trial. Nat. Biotechnol. 2020;38:1242–1252. doi: 10.1038/s41587-020-0732-8. [DOI] [PMC free article] [PubMed] [Google Scholar]
- 8.Chen P., Nirula A., Heller B., Gottlieb R.L., Boscia J., Morris J., Huhn G., Cardona J., Mocherla B., Stosor V., et al. BLAZE-1 Investigators SARS-CoV-2 Neutralizing Antibody LY-CoV555 in Outpatients with Covid-19. N. Engl. J. Med. 2021;384:229–237. doi: 10.1056/NEJMoa2029849. [DOI] [PMC free article] [PubMed] [Google Scholar]
- 9.Hammarström L., Abolhassani H., Baldanti F., Marcotte H., Pan-Hammarström Q. Development of passive immunity against SARS-CoV-2 for management of immunodeficient patients-a perspective. J. Allergy Clin. Immunol. 2020;146:58–60. doi: 10.1016/j.jaci.2020.04.043. [DOI] [PMC free article] [PubMed] [Google Scholar]
- 10.Chandrashekar A., Liu J., Martinot A.J., McMahan K., Mercado N.B., Peter L., Tostanoski L.H., Yu J., Maliga Z., Nekorchuk M., et al. SARS-CoV-2 infection protects against rechallenge in rhesus macaques. Science. 2020;369:812–817. doi: 10.1126/science.abc4776. [DOI] [PMC free article] [PubMed] [Google Scholar]
- 11.Gudbjartsson D.F., Norddahl G.L., Melsted P., Gunnarsdottir K., Holm H., Eythorsson E., Arnthorsson A.O., Helgason D., Bjarnadottir K., Ingvarsson R.F., et al. Humoral immune response to SARS-CoV-2 in Iceland. N. Engl. J. Med. 2020;383:1724–1734. doi: 10.1056/NEJMoa2026116. [DOI] [PMC free article] [PubMed] [Google Scholar]
- 12.Ibarrondo F.J., Fulcher J.A., Goodman-Meza D., Elliott J., Hofmann C., Hausner M.A., Ferbas K.G., Tobin N.H., Aldrovandi G.M., Yang O.O. Rapid decay of anti-SARS-CoV-2 antibodies in persons with mild Covid-19. N. Engl. J. Med. 2020;383:1085–1087. doi: 10.1056/NEJMc2025179. [DOI] [PMC free article] [PubMed] [Google Scholar]
- 13.Long Q.-X., Tang X.-J., Shi Q.-L., Li Q., Deng H.-J., Yuan J., Hu J.-L., Xu W., Zhang Y., Lv F.-J., et al. Clinical and immunological assessment of asymptomatic SARS-CoV-2 infections. Nat. Med. 2020;26:1200–1204. doi: 10.1038/s41591-020-0965-6. [DOI] [PubMed] [Google Scholar]
- 14.Bölke E., Matuschek C., Fischer J.C. Loss of anti-SARS-CoV-2 antibodies in mild covid-19. N. Engl. J. Med. 2020;383:1694–1695. doi: 10.1056/NEJMc2027051. [DOI] [PubMed] [Google Scholar]
- 15.Iyer A.S., Jones F.K., Nodoushani A., Kelly M., Becker M., Slater D., Mills R., Teng E., Kamruzzaman M., Garcia-Beltran W.F., et al. Persistence and decay of human antibody responses to the receptor binding domain of SARS-CoV-2 spike protein in COVID-19 patients. Sci. Immunol. 2020;5:eabe0367. doi: 10.1126/sciimmunol.abe0367. [DOI] [PMC free article] [PubMed] [Google Scholar]
- 16.Isho B., Abe K.T., Zuo M., Jamal A.J., Rathod B., Wang J.H., Li Z., Chao G., Rojas O.L., Bang Y.M., et al. Persistence of serum and saliva antibody responses to SARS-CoV-2 spike antigens in COVID-19 patients. Sci. Immunol. 2020;5:eabe55115. doi: 10.1126/sciimmunol.abe5511. [DOI] [PMC free article] [PubMed] [Google Scholar]
- 17.Wajnberg A., Amanat F., Firpo A., Altman D.R., Bailey M.J., Mansour M., McMahon M., Meade P., Mendu D.R., Muellers K., et al. Robust neutralizing antibodies to SARS-CoV-2 infection persist for months. Science. 2020;370:1227–1230. doi: 10.1126/science.abd7728. [DOI] [PMC free article] [PubMed] [Google Scholar]
- 18.Hartley G.E., Edwards E.S.J., Aui P.M., Varese N., Stojanovic S., McMahon J., Peleg A.Y., Boo I., Drummer H.E., Hogarth P.M., et al. Rapid generation of durable B cell memory to SARS-CoV-2 spike and nucleocapsid proteins in COVID-19 and convalescence. Sci. Immunol. 2020;5:eabf8891. doi: 10.1126/sciimmunol.abf8891. [DOI] [PMC free article] [PubMed] [Google Scholar]
- 19.Röltgen K., Powell A.E., Wirz O.F., Stevens B.A., Hogan C.A., Najeeb J., Hunter M., Wang H., Sahoo M.K., Huang C., et al. Defining the features and duration of antibody responses to SARS-CoV-2 infection associated with disease severity and outcome. Sci. Immunol. 2020;5:eabe0240. doi: 10.1126/sciimmunol.abe0240. [DOI] [PMC free article] [PubMed] [Google Scholar]
- 20.Dan J.M., Mateus J., Kato Y., Hastie K.M., Yu E.D., Faliti C.E., Grifoni A., Ramirez S.I., Haupt S., Frazier A., et al. Immunological memory to SARS-CoV-2 assessed for up to 8 months after infection. Science. 2021;371:eabf4063. doi: 10.1126/science.abf4063. [DOI] [PMC free article] [PubMed] [Google Scholar]
- 21.Kutsuna S., Asai Y., Matsunaga A. Loss of anti–SARS-CoV-2 antibodies in mild covid-19. N. Engl. J. Med. 2020;383:1695–1696. doi: 10.1056/NEJMc2027051. [DOI] [PubMed] [Google Scholar]
- 22.Huang A.T., Garcia-Carreras B., Hitchings M.D.T., Yang B., Katzelnick L.C., Rattigan S.M., Borgert B.A., Moreno C.A., Solomon B.D., Trimmer-Smith L., et al. A systematic review of antibody mediated immunity to coronaviruses: kinetics, correlates of protection, and association with severity. Nat. Commun. 2020;11:4704. doi: 10.1038/s41467-020-18450-4. [DOI] [PMC free article] [PubMed] [Google Scholar]
- 23.Zheng S., Fan J., Yu F., Feng B., Lou B., Zou Q., Xie G., Lin S., Wang R., Yang X., et al. Viral load dynamics and disease severity in patients infected with SARS-CoV-2 in Zhejiang province, China, January-March 2020: retrospective cohort study. BMJ. 2020;369:m1443. doi: 10.1136/bmj.m1443. [DOI] [PMC free article] [PubMed] [Google Scholar]
- 24.Bastard P., Rosen L.B., Zhang Q., Michailidis E., Hoffmann H.-H., Zhang Y., Dorgham K., Philippot Q., Rosain J., Béziat V., et al. HGID Lab. NIAID-USUHS Immune Response to COVID Group. COVID Clinicians. COVID-STORM Clinicians. Imagine COVID Group. French COVID Cohort Study Group. Milieu Intérieur Consortium. CoV-Contact Cohort. Amsterdam UMC Covid-19 Biobank. COVID Human Genetic Effort Autoantibodies against type I IFNs in patients with life-threatening COVID-19. Science. 2020;370:eabd4585. doi: 10.1126/science.abd4585. [DOI] [PMC free article] [PubMed] [Google Scholar]
- 25.Zhang Q., Bastard P., Liu Z., Le Pen J., Moncada-Velez M., Chen J., Ogishi M., Sabli I.K.D., Hodeib S., Korol C., et al. COVID-STORM Clinicians. COVID Clinicians. Imagine COVID Group. French COVID Cohort Study Group. CoV-Contact Cohort. Amsterdam UMC Covid-19 Biobank. COVID Human Genetic Effort. NIAID-USUHS/TAGC COVID Immunity Group Inborn errors of type I IFN immunity in patients with life-threatening COVID-19. Science. 2020;370:eabd4570. doi: 10.1126/science.abd4570. [DOI] [PMC free article] [PubMed] [Google Scholar]
- 26.Yang O.O., Ibarrondo F.J. Loss of Anti-SARS-CoV-2 Antibodies in Mild Covid-19. Reply. N. Engl. J. Med. 2020;383:1697–1698. doi: 10.1056/NEJMc2027051. [DOI] [PubMed] [Google Scholar]
- 27.Premkumar L., Segovia-Chumbez B., Jadi R., Martinez D.R., Raut R., Markmann A., Cornaby C., Bartelt L., Weiss S., Park Y., et al. The receptor binding domain of the viral spike protein is an immunodominant and highly specific target of antibodies in SARS-CoV-2 patients. Sci. Immunol. 2020;5:eabc8413. doi: 10.1126/sciimmunol.abc8413. [DOI] [PMC free article] [PubMed] [Google Scholar]
- 28.Trinité B., Tarrés-Freixas F., Rodon J., Pradenas E., Urrea V., Marfil S., Rodríguez de la Concepción M.L., Ávila-Nieto C., Aguilar-Gurrieri C., Barajas A., et al. SARS-CoV-2 infection elicits a rapid neutralizing antibody response that correlates with disease severity. Sci. Rep. 2021;11:2608. doi: 10.1038/s41598-021-81862-9. [DOI] [PMC free article] [PubMed] [Google Scholar]
- 29.Rodda L.B., Netland J., Shehata L., Pruner K.B., Morawski P.A., Thouvenel C.D., Takehara K.K., Eggenberger J., Hemann E.A., Waterman H.R., et al. Functional SARS-CoV-2-specific immune memory persists after mild COVID-19. Cell. 2021;184:169–183.e17. doi: 10.1016/j.cell.2020.11.029. [DOI] [PMC free article] [PubMed] [Google Scholar]
- 30.Vaisman-Mentesh A., Dror Y., Tur-Kaspa R., Markovitch D., Kournos T., Dicker D., Wine Y. SARS-CoV-2 specific memory B cells frequency in recovered patient remains stable while antibodies decay over time. medRxiv. 2020 doi: 10.1101/2020.08.23.20179796. [DOI] [Google Scholar]
- 31.Wheatley A.K., Juno J.A., Wang J.J., Selva K.J., Reynaldi A., Tan H.-X., Lee W.S., Wragg K.M., Kelly H.G., Esterbauer R., et al. Evolution of immunity to SARS-CoV-2. medRxiv. 2020 doi: 10.1101/2020.09.09.20191205. [DOI] [Google Scholar]
- 32.Gaebler C., Wang Z., Lorenzi J.C.C., Muecksch F., Finkin S., Tokuyama M., Cho A., Jankovic M., Schaefer-Babajew D., Oliveira T.Y., et al. Evolution of antibody immunity to SARS-CoV-2. Nature. 2021 doi: 10.1038/s41586-021-03207-w. [DOI] [PMC free article] [PubMed] [Google Scholar]
- 33.Zhang F., Gan R., Zhen Z., Hu X., Li X., Zhou F., Liu Y., Chen C., Xie S., Zhang B., et al. Adaptive immune responses to SARS-CoV-2 infection in severe versus mild individuals. Signal Transduct. Target. Ther. 2020;5:156. doi: 10.1038/s41392-020-00263-y. [DOI] [PMC free article] [PubMed] [Google Scholar]
- 34.Sekine T., Perez-Potti A., Rivera-Ballesteros O., Strålin K., Gorin J.-B., Olsson A., Llewellyn-Lacey S., Kamal H., Bogdanovic G., Muschiol S., et al. Karolinska COVID-19 Study Group Robust T cell immunity in convalescent individuals with asymptomatic or mild COVID-19. Cell. 2020;183:158–168.e14. doi: 10.1016/j.cell.2020.08.017. [DOI] [PMC free article] [PubMed] [Google Scholar]
- 35.Braun J., Loyal L., Frentsch M., Wendisch D., Georg P., Kurth F., Hippenstiel S., Dingeldey M., Kruse B., Fauchere F., et al. SARS-CoV-2-reactive T cells in healthy donors and patients with COVID-19. Nature. 2020;587:270–274. doi: 10.1038/s41586-020-2598-9. [DOI] [PubMed] [Google Scholar]
- 36.Zuo J., Dowell A., Pearce H., Verma K., Long H., Begum J., Aiano F., Amin-Chowdhury Z., Hallis B., Stapley L., et al. Robust SARS-CoV-2-specific T-cell immunity is maintained at 6 months following primary infection. bioRxiv. 2020 doi: 10.1101/2020.11.01.362319. [DOI] [Google Scholar]
- 37.Breton G., Mendoza P., Hägglöf T., Oliveira T.Y., Schaefer-Babajew D., Gaebler C., Turroja M., Hurley A., Caskey M., Nussenzweig M.C. Persistent cellular immunity to SARS-CoV-2 infection. J. Exp. Med. 2020;218:e20202515. doi: 10.1084/jem.20202515. [DOI] [PMC free article] [PubMed] [Google Scholar]
- 38.Bert N.L., Clapham H.E., Tan A.T., Chia W.N., Tham C.Y., Lim J.M., Kunasegaran K., Tan L., Dutertre C.-A., Shankar N., et al. Highly functional virus-specific cellular immune response in asymptomatic SARS-CoV-2 infection. bioRxiv. 2020 doi: 10.1101/2020.11.25.399139. [DOI] [PMC free article] [PubMed] [Google Scholar]
- 39.Nelde A., Bilich T., Heitmann J.S., Maringer Y., Salih H.R., Roerden M., Lübke M., Bauer J., Rieth J., Wacker M., et al. SARS-CoV-2-derived peptides define heterologous and COVID-19-induced T cell recognition. Nat. Immunol. 2021;22:74–85. doi: 10.1038/s41590-020-00808-x. [DOI] [PubMed] [Google Scholar]
- 40.Schwarzkopf S., Krawczyk A., Knop D., Klump H., Heinold A., Heinemann F.M., Thümmler L., Temme C., Breyer M., Witzke O., et al. Cellular Immunity in COVID-19 convalescents with PCR-confirmed infection but with undetectable SARS-CoV-2–specific IgG. Emerg. Infect. Dis. 2021;27 doi: 10.3201/eid2701.203772. [DOI] [PubMed] [Google Scholar]
- 41.Yu J., Tostanoski L.H., Peter L., Mercado N.B., McMahan K., Mahrokhian S.H., Nkolola J.P., Liu J., Li Z., Chandrashekar A., et al. DNA vaccine protection against SARS-CoV-2 in rhesus macaques. Science. 2020;369:806–811. doi: 10.1126/science.abc6284. [DOI] [PMC free article] [PubMed] [Google Scholar]
- 42.Edridge A.W.D., Kaczorowska J., Hoste A.C.R., Bakker M., Klein M., Loens K., Jebbink M.F., Matser A., Kinsella C.M., Rueda P., et al. Seasonal coronavirus protective immunity is short-lasting. Nat. Med. 2020;26:1691–1693. doi: 10.1038/s41591-020-1083-1. [DOI] [PubMed] [Google Scholar]
- 43.Callow K.A., Parry H.F., Sergeant M., Tyrrell D.A. The time course of the immune response to experimental coronavirus infection of man. Epidemiol. Infect. 1990;105:435–446. doi: 10.1017/s0950268800048019. [DOI] [PMC free article] [PubMed] [Google Scholar]
- 44.Callaway E. Fast-spreading COVID variant can elude immune responses. Nature. 2021;589:500–501. doi: 10.1038/d41586-021-00121-z. [DOI] [PubMed] [Google Scholar]
- 45.Peng Y., Mentzer A.J., Liu G., Yao X., Yin Z., Dong D., Dejnirattisai W., Rostron T., Supasa P., Liu C., et al. Oxford Immunology Network Covid-19 Response T cell Consortium. ISARIC4C Investigators Broad and strong memory CD4+ and CD8+ T cells induced by SARS-CoV-2 in UK convalescent individuals following COVID-19. Nat. Immunol. 2020;21:1336–1345. doi: 10.1038/s41590-020-0782-6. [DOI] [PMC free article] [PubMed] [Google Scholar]
- 46.Corman V.M., Landt O., Kaiser M., Molenkamp R., Meijer A., Chu D.K., Bleicker T., Brünink S., Schneider J., Schmidt M.L., et al. Detection of 2019 novel coronavirus (2019-nCoV) by real-time RT-PCR. Euro Surveill. 2020;25:2000045. doi: 10.2807/1560-7917.ES.2020.25.3.2000045. [DOI] [PMC free article] [PubMed] [Google Scholar]
- 47.Amanat F., Stadlbauer D., Strohmeier S., Nguyen T.H.O., Chromikova V., McMahon M., Jiang K., Arunkumar G.A., Jurczyszak D., Polanco J., et al. A serological assay to detect SARS-CoV-2 seroconversion in humans. Nat. Med. 2020;26:1033–1036. doi: 10.1038/s41591-020-0913-5. [DOI] [PMC free article] [PubMed] [Google Scholar]
- 48.Bleckmann M., Schürig M., Endres M., Samuels A., Gebauer D., Konisch N., van den Heuvel J. Identifying parameters to improve the reproducibility of transient gene expression in High Five cells. PLoS ONE. 2019;14:e0217878. doi: 10.1371/journal.pone.0217878. [DOI] [PMC free article] [PubMed] [Google Scholar]
- 49.Bertoglio F., Meier D., Langreder N., Steinke S., Rand U., Simonelli L., Heine P.A., Ballmann R., Schneider K.-T., Roth K.D.R., et al. SARS-CoV-2 neutralizing human recombinant antibodies selected from pre-pandemic healthy donors binding at RBD-ACE2 interface. bioRxiv. 2020 doi: 10.1101/2020.06.05.135921. [DOI] [PMC free article] [PubMed] [Google Scholar]
- 50.Percivalle E., Cambiè G., Cassaniti I., Nepita E.V., Maserati R., Ferrari A., Di Martino R., Isernia P., Mojoli F., Bruno R., et al. Prevalence of SARS-CoV-2 specific neutralising antibodies in blood donors from the Lodi Red Zone in Lombardy, Italy, as at 06 April 2020. Euro Surveill. 2020;25:2001031. doi: 10.2807/1560-7917.ES.2020.25.24.2001031. [DOI] [PMC free article] [PubMed] [Google Scholar]
- 51.Bonelli F., Sarasini A., Zierold C., Calleri M., Bonetti A., Vismara C., Blocki F.A., Pallavicini L., Chinali A., Campisi D., et al. Clinical and analytical performance of an automated serological test that identifies S1/S2-neutralizing IgG in COVID-19 patients semiquantitatively. J. Clin. Microbiol. 2020;58 doi: 10.1128/JCM.01224-20. e01224-20. [DOI] [PMC free article] [PubMed] [Google Scholar]
- 52.Jahnmatz M., Kesa G., Netterlid E., Buisman A.-M., Thorstensson R., Ahlborg N. Optimization of a human IgG B-cell ELISpot assay for the analysis of vaccine-induced B-cell responses. J. Immunol. Methods. 2013;391:50–59. doi: 10.1016/j.jim.2013.02.009. [DOI] [PubMed] [Google Scholar]
- 53.Ahmed S.F., Quadeer A.A., McKay M.R. Preliminary identification of potential vaccine targets for the COVID-19 coronavirus (SARS-CoV-2) based on SARS-CoV immunological studies. Viruses. 2020;12:254. doi: 10.3390/v12030254. [DOI] [PMC free article] [PubMed] [Google Scholar]
Associated Data
This section collects any data citations, data availability statements, or supplementary materials included in this article.
Supplementary Materials
Data Availability Statement
All relevant data outputs are within the paper and its supplementation information.