Abstract.
Purpose: To assess acute ischemic stroke (AIS) severity, infarct is segmented using computed tomography perfusion (CTP) software, such as RAPID, Sphere, and Vitrea, relying on contralateral hemisphere thresholds. Since this approach is potentially patient dependent, we investigated whether convolutional neural networks (CNNs) could achieve better performances without the need for contralateral hemisphere thresholds.
Approach: CTP and diffusion-weighted imaging (DWI) data were retrospectively collected for 63 AIS patients. Cerebral blood flow (CBF), cerebral blood volume (CBV), time-to-peak, mean-transit-time (MTT), and delay time maps were generated using Vitrea CTP software. U-net shaped CNNs were developed, trained, and tested for 26 different input CTP parameter combinations. Infarct labels were segmented from DWI volumes registered with CTP volumes. Infarct volumes were reconstructed from two-dimensional CTP infarct segmentations. To remove erroneous segmentations, conditional random field (CRF) postprocessing was applied and compared with prior results. Spatial and volumetric infarct agreement was assessed between DWI and CTP (CNNs and commercial software) using median infarct difference, median absolute error, dice coefficient, positive predictive value.
Results: The most accurate combination of parameters for CNN segmenting infarct using CRF postprocessing was CBF, CBV, and MTT (4.83 mL, 10.14 mL, 0.66, 0.73). Commercial software results are: RAPID = (2.25 mL, 21.48 mL, 0.63, 0.70), Sphere = (7.57 mL, 17.74 mL, 0.64, 0.70), Vitrea = (6.79 mL, 15.28 mL, 0.63, 0.72).
Conclusions: Use of CNNs with multiple input perfusion parameters has shown to be accurate in segmenting infarcts and has the ability to improve clinical workflow by eliminating the need for contralateral hemisphere comparisons.
Keywords: brain, computed tomography perfusion, diffusion-weighted imaging, infarct core, ischemic stroke
1. Introduction
Across the United States, it is approximated that 7 million individuals reported having a stroke with the prevalence for stroke being 2.5%.1 Eighty-seven percent of these strokes are categorized as ischemic strokes.2 An ischemic stroke occurs when a blood vessel supplying the brain with oxygenated blood is blocked.3 This blockage can be the result of a clot (embolus) in the vessel or a stenosis (narrowing) of the vessel.4 Depending on the location of an embolus in a patient’s neurovasculature, the blockage of blood can be known as a large or small vessel occlusion. Large vessel occlusions occur in the internal carotid artery, basilar artery, and main branches of the posterior, anterior, and middle cerebral arteries (i.e., M1 branch of the middle cerebral artery).5 Small vessel occlusions, as their name suggests, typically occur in the smaller branches of the posterior, anterior, and middle cerebral arteries (i.e., M3 or M4 branches of the middle cerebral artery).6 Although small vessel occlusions can result in the formation of infarctions, or permanently dead cerebral tissue, large vessel occlusions are typically much more severe as they result in a more rapid formation of large infarct territories.7
The main treatment methods currently put in place for large vessel occlusion ischemic stroke patients are intravenous thrombolysis and mechanical thrombectomy. Intravenous thrombolysis results in a chemical reaction with the embolus so that it breaks down within the vessel restoring blood flow.8,9 This method can only be used if symptom onset is however.10 Mechanical thrombectomy involves the use of a catheter and stent retriever to remove the blood clot through endovascular means. This is done by feeding the catheter through the femoral or radial artery, through the embolus, expanding the retriever, and then pulling the clot out of the vessel.8,9
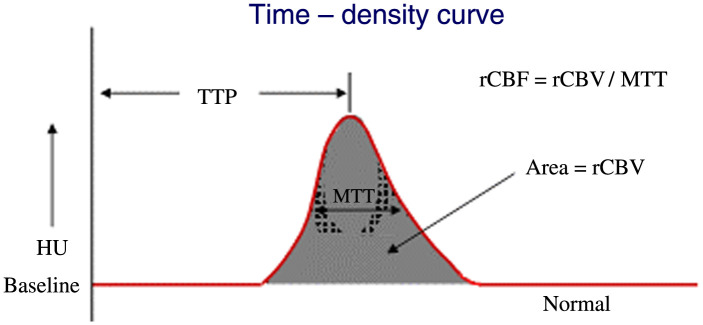
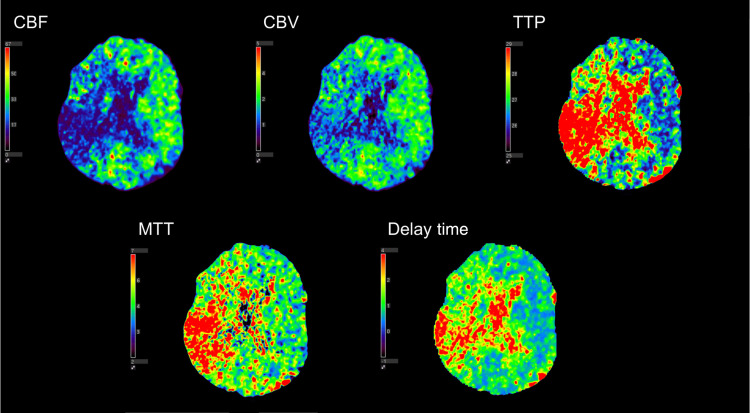
In order to diagnose the presence of a large vessel occlusion and determine if a thrombectomy can be conducted, three different types of medical imaging can be utilized. One type of imaging used to diagnose infarct tissue is known as computed tomography perfusion (CTP). CTP involves the injection of contrast media into the neurovasculature of a patient while multiple CT scans are taken to capture the progression of contrast as it flows through the vessels of the brain. These scans showing contrast progression can be used to generate what are known as time density curves (TDCs) which show the image intensity in a specific voxel over a given period of time (Fig. 1). From these TDCs, multiple perfusion parameters can be extracted to aid in the diagnosis of infarct tissue. Cerebral blood flow (CBF), cerebral blood volume (CBV), time-to-peak (TTP), mean-transit-time (MTT), and delay time are the five parameters typically extracted from TDCs. TTP is the time it takes to reach peak contrast enhancement on the TDC, while MTT is the average time blood travels through the capillaries and is the full width at half maximum of the TDC. Delay time is the time for contrast to arrive to tissue, which is the time the TDC intensity moves above 0. CBV is the volume of blood per unit of brain tissue and is calculated as the area under the TDC. CBF represents the volume of blood traveling through the capillaries per unit of time and is calculated as CBV divided by MTT. Contralateral hemisphere comparisons are subsequently conducted from the generated perfusion parameters and thresholds across hemispheres are set to identify infarct tissue.11–13 Figure 2 shows the five perfusion maps for the aforementioned parameters.
Fig. 1.
A TDC and how the perfusion parameters are extracted from the curve. TTP is the time to reach peak contrast enhancement, MTT is the full width at half maximum, delay time is the time at which contrast intensity goes above 0, CBV is the area under the curve, and CBF is CBV divided by MTT.11
Fig. 2.
The five perfusion parameters generated using CTP. This specific patient has an M2 middle cerebral artery occlusion, which is indicated by the decrease in CBV and flow along with an increase in TTP, MTT, and delay time in the right hemisphere of the brain.
Commercially available CTP software include RAPID (iSchemaView, Menlo Park, California), Sphere (Olea Medical, La Ciotat, France), and Vitrea (Vital Images, Minnetonka, Minnesota). Within each of these software, different perfusion parameters and contralateral hemisphere thresholds are used to identify infarct tissue. RAPID uses relative and time until the impulse residue function reaches its while Sphere uses relative and s compared with the contralateral hemisphere to identify infarct. Vitrea, however, uses relative , , and relative compared with the contralateral hemisphere to identify infarct. Although these thresholds have been shown to be successful in segmenting ischemic tissue in previous studies, they do not account for baseline hemodynamics of stroke patients.14,15 Some patients may have naturally low flow in one hemisphere but have perfectly functioning brain tissue that these software will label as infarcts. Some patients may also have naturally low blood flow throughout their brain, which will not meet contralateral hemisphere comparison thresholds designed to isolate infarcts. Furthermore, some commercial software, such as RAPID, require infarct analysis to be conducted offsite leading to large windows of time before infarct estimation results are received. In order to improve the performance of the aforementioned approach, a data-driven approach may be combined with generated CTP parameters maps.
Convolutional neural networks (CNNs) may provide the ability to remove contralateral hemisphere thresholding and supply more accurate infarct segmentations. CNNs are commonly utilized in medical imaging to segment various structures using convolutions to detect patterns and features within an image.16 Although a CNN can be thought of as a black-box in certain instances, it is still capable of detecting more features in an image than manual analysis. While segmenting regions from an image, the CNN determines which image features are most important and weights them more for classification purposes. A previous study has been conducted showing a CNN is capable of segmenting infarcts, but these results are not compared with clinically available CTP software. In addition, this previous study does not include multiple perfusion parameters in segmenting infarct tissue.17 Utilization of multiple parameters is essential as it can be seen from the various commercially available CTP software that one perfusion parameter alone cannot segment infarcts with the best possible accuracy.
In this study, we propose the use of a data-driven model, in this case a CNN, with multiple input perfusion maps to automatically segment infarct tissue in ischemic stroke patients. Every combination of perfusion parameters was tested providing 26 different combinations. Three-dimensional (3D) infarct volumes were compared between the CNN segmentations and 48-h follow-up diffusion-weighted imaging (DWI). In addition, spatial accuracy of the infarct segmentations was conducted and compared with DWI. The results from this CNN were also compared with infarct segmentation results from RAPID, Sphere, and Vitrea. The results from this study could provide an improvement in clinical work flow for segmentation of infarct tissue in ischemic stroke patients, along with the ability to remove the need for contralateral hemisphere thresholding.
2. Methods
2.1. Patient Inclusion
For this retrospective study, institutional review board approval was obtained and informed consent was waived. Inclusion criteria involved acute ischemic stroke (AIS) patients who presented with emergent large vessel occlusion at our comprehensive stroke center between March 2019 and January 2020. Patients were required to have undergone baseline CTP imaging upon stroke center arrival and follow-up DWI within 48 h following admission. 63 patients were included in total and were a combination of endovascular intervention and conservative treatment patients.
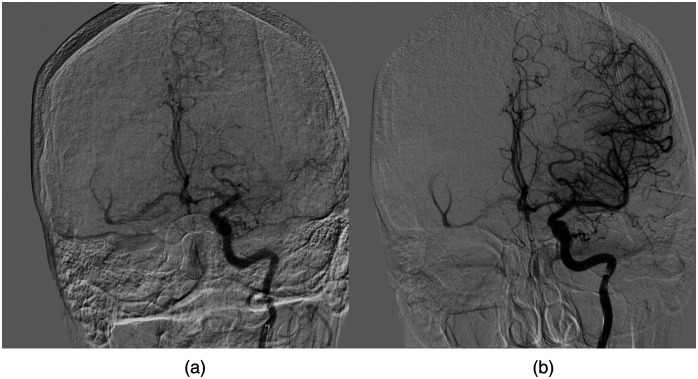
Within this study, endovascular intervention patients all underwent successful mechanical thrombectomy, obtaining a reperfusion status [thrombolysis in cerebral infarction (TICI)] of 2b, 2c, or 3. TICI 2b indicates there is filling of greater than 50% of the distal neurovascular branches, 2c indicates there is complete filling of the distal neurovascular branches but with a slight delay, and 3 indicates complete filling of all distal branches.8 Figure 3 demonstrates a successful reperfusion from TICI 0 to TICI 3. Successful reperfusion was required to ensure all penumbra, or salvageable tissue, was salvaged leaving only infarcts for the follow-up DWI. Conservative treatment patients did not undergo mechanical thrombectomy or have intravenous thrombolysis due to being outside the 4.5-h time window. In addition, conservative treatment patients presented with initial large infarcted area and little penumbra and time since stroke symptom onset was greater than 48 h. This extended time since symptom onset indicates all penumbra had already converted to infarct on initial CTP imaging, meaning it should be the same volume as on DWI.18,19
Fig. 3.
A digital subtraction angiography image for a patient who achieved successful reperfusion of TICI 3 following a middle cerebral artery occlusion. (a) TICI 0, prior to thrombectomy, which is evident based on no filling of the M1 segment. The red arrow indicates the location of the clot and where filling is halted. Note the complete filling of all distal vessels, which demonstrated a complete reperfusion status in (b).
2.2. CTP Data Analysis
CTP data were collected using 2 Aquilion ONE CT scanners (Canon Medical Systems Corporation, Otawara, Japan) using the Neuro ONE protocol. This protocol involves the acquisition of 19 scan volumes of an ischemic stroke patient’s brain as contrast progresses through the vasculature. Each scan volume contained 320 slices with a thickness of 0.5 mm, along with an in-plane resolution of 0.42 mm. An automated injector was utilized to inject 50 mL of Omnipaque 350 at a rate of . A tube voltage of 80 kVp, CT dose indices ranging from 15.3 to 44.3 mGy, and dose length products ranging from 244.5 to 709.8 mGy·cm were utilized as scan parameters. All 19 scans were acquired within 49.3 s and reconstructed volumes were available for CTP processing within 5 min from the start of the scan.
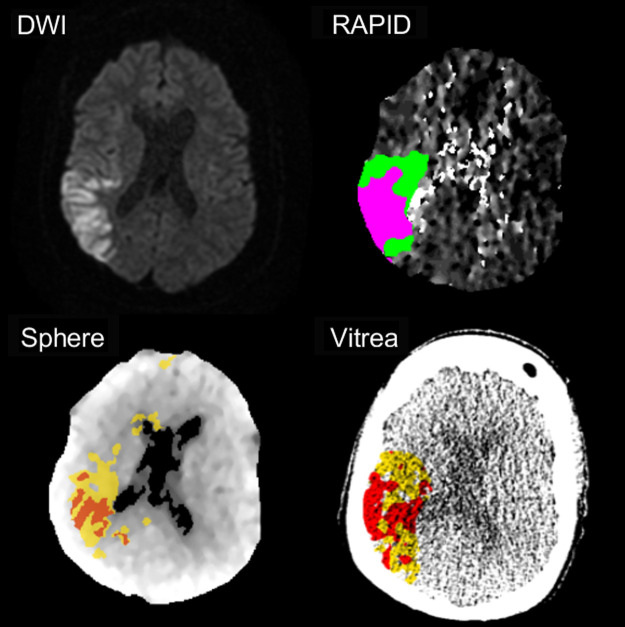
Following volume reconstruction, each patient’s CTP scans were analyzed by RAPID, Sphere, and Vitrea CTP software. Each software relied on their respective perfusion parameters and contralateral hemisphere comparison thresholds to identify infarct tissue; RAPID: relative , and ; Sphere: relative and , Vitrea: relative , , and relative .14,15 Figure 4 shows segmented infarcts for these three commercially available software. Following the quantification and segmentation of infarcts from each software, the segmented volumes were exported as Digital Imaging and Communications in Medicine (DICOM) files to compare infarct spatial overlap with follow-up DWI.
Fig. 4.
The estimations of infarct and penumbra for RAPID, Sphere, and Vitrea CTP software compared with DWI. For RAPID, infarct, and penumbra are represented as pink and green regions, respectively. For Sphere and Vitrea, red and yellow regions indicate infarct and penumbra, respectively. Note the spatial agreement seen between the estimated ischemic regions with follow-up imaging.
Of the three CTP software utilized, Vitrea allowed for the export of the raw data for generated perfusion maps. Therefore, CBF, CBV, TTP, MTT, and delay time perfusion maps were exported from Vitrea to be used as data input for the CNN.
2.3. DWI Data Analysis
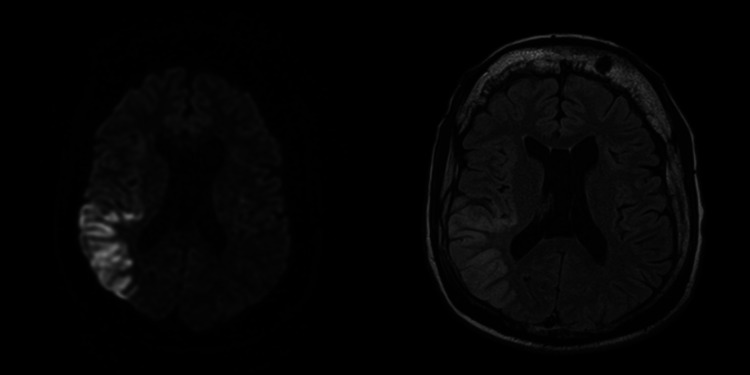
Two other medical imaging methods used to diagnose infarct tissue are fluid-attenuation inversion recovery (FLAIR) magnetic resonance imaging (MRI) and DWI. These two methods involve the isolation of infarct tissue as hyperintense regions (Fig. 5) based on the transverse relaxation of the net magnetization and random Brownian motion of molecules, respectively.20,21 Although these two imaging methods are commonly used as the gold standards for infarct calculation, they are both typically conducted as follow-up imaging since the acquisition time of CTP is much shorter.22,23 This shorter acquisition time for CTP is beneficial over FLAIR and DWI since it prevents more infarct from forming while imaging is occurring.
Fig. 5.
The estimations of infarct and penumbra for RAPID, Sphere, and Vitrea CTP software compared with DWI. For RAPID, infarct and penumbra are represented as pink and green regions, respectively. For Sphere and Vitrea, red and yellow regions indicate infarct and penumbra, respectively. Note the spatial agreement seen between the estimated ischemic regions with follow-up imaging.
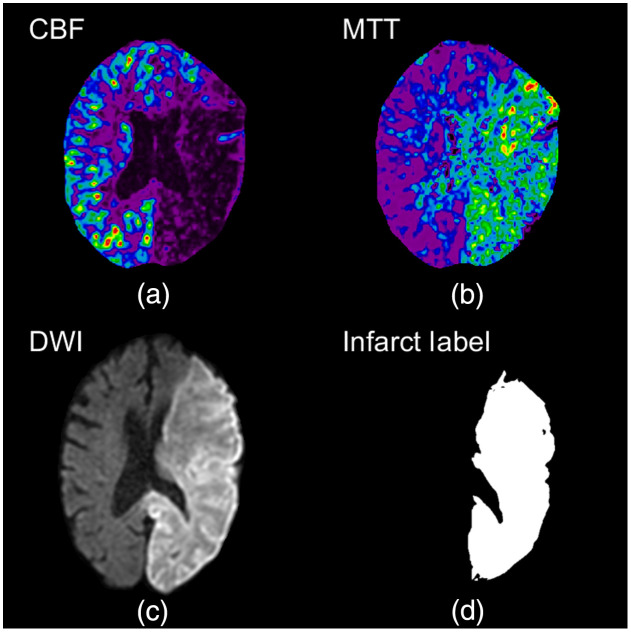
DWI data were collected using a Vantage Titan 1.5 Tesla MRI unit (Canon Medical Systems Corporation, Otawara, Japan) using the IsoDWI protocol. The IsoDWI protocol includes a diffusion -value of 1000, an echo time of 100 ms, and a repetition time of 8700 ms. The resulting DWI volumes have a slice thickness of 5 mm and an in-plane resolution of 0.81 mm. For this study, DWI imaging was utilized for ground truth infarct labels as it is the most common method utilized for final infarct volume estimation. To create ground truth infarct labels, a previously published method was utilized, which segmented infarct as voxels with a 162% increase in image intensity compared with the contralateral hemisphere in the DWI volume.24 An endovascular fellow with over 5 years of experience reviewed the DWI infarct segmentations and manually corrected any erroneous segmentations that could have occurred. One potential source of erroneous segmentation is due to T2 shine, which corresponds to hyperintensified regions on DWI that do not correspond to restricted diffusion, but rather high T2 signal from a long T2 decay time in normal tissue. Figure 6 represents a slice from a DWI, the segmented infarct as a binary image, and the corresponding CTP slices from each perfusion parameter.
Fig. 6.
(a),(b) the CBF and MTT perfusion maps for a conservative treatment patient with a complete occlusion of the middle and posterior cerebral arteries. (c) Follow-up DWI with hyperintensified regions indicating infarct. Segmented infarct is indicated as a binary image in (d) with 1s indicating infarct and 0s indicating background and healthy tissue.
2.4. CTP and DWI Volume Registration
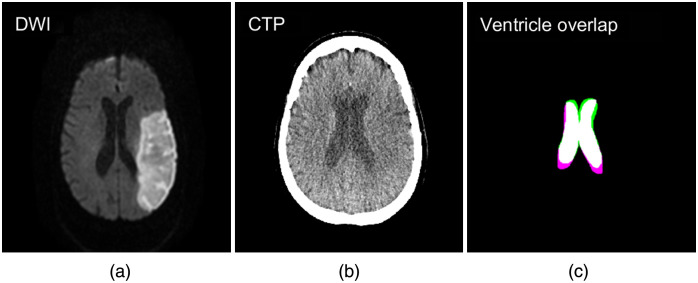
CTP and DWI 3D volumes were registered using an intensity and geometric-based MATLAB® technique, which has been used in previously conducted studies.13,25–27 An affine transformation was utilized along with linear interpolation, a one-plus-one evolutionary optimizer, and multimodal Mattes method similarity metric. The multimodal Mattes similarity metric was designed to register volumes from different imaging modalities by calculating the joint probability distribution for voxels sampled in each image to properly map voxels across both volumes.28 For the one-plus-one evolutionary optimizer, an initial search radius of 0.004, a minimum search radius of , a search radius growth factor of 1.05, and a maximum number of 250 iterations were utilized to register the volumes. The specific transformation utilized to register the CTP and DWI images was stored and used to register the segmented DWI infarct to the CTP volume for spatial overlap assessment. Accuracy assessment of this registration method was conducted by manually segmenting the ventricles from both the CTP and DWI volumes and determining the degree of spatial overlap of the two. Dice coefficient calculation was used to assess the degree of ventricle overlap and Fig. 7 shows the degree of ventricle overlap between registered CTP and DWI volumes.
Fig. 7.
(a) DWI and (b) CTP following image registration of the two volumes. The degree of ventricle overlap is indicated in (c) with white, green, and pink regions indicating overlapping, CTP, and DWI infarct, respectively.
2.5. CNN Infarct Segmentation
The 3D CTP parameter (CBF, CBV, TTP, MTT, and delay time) volumes that were exported from Vitrea were made up of 320 slices and were 512 pixels by 512 pixels. Each volume was separated into 320 two-dimensional (2D) images resulting in 20,160 images for each parameter for the 63 patients included in the study. DWI volumes were additionally separated into 2D images to be used as ground truth labels. Any CTP images determined not to contain infarct based on their corresponding DWI image were removed from the dataset. This resulted in a total of 8352 images being included for each CTP parameter. Preprocessing was conducted on all 8352 images by dividing the intensity values of each image by the maximum intensity value in that particular image. This was conducted as a normalization technique. In addition, each image was resized to 64 pixels by 64 pixels to aid in computational efficiency, and it has been shown that smaller networks tend to converge easier and take less data to do so.29 To resize each image, bilinear interpolation was utilized along with anti-aliasing for downscaling. Furthermore, the original intensity value range was preserved from the original to the downscaled image. This resizing was conducted using the scikit-image library in Python.
The CNN created for this study was developed using Keras, Google’s (Google LLC, Menlo Park, California) python machine learning framework and a Tensorflow backend. In order to accept multiple input CTP maps to train the network, our model used a multiple channel input where each CTP map was loaded into a different color channel. This resulted in the network having a minimum of two color channels and a maximum of five color channels depending on the number of perfusion parameter maps used for training. The architecture of our CNN was a modified U-net, which was utilized for 2D image segmentation. The model consisted of two contraction processes, one middle process, and two expansion processes. Each of the contraction processes contained two convolutional layers, two batch normalizations, one max pooling layer, and one dropout layer of 30%. The middle process contained convolutional two layers and two batch normalizations. Each expansion process contained one upsampling convolutional layer, one skip connection, one dropout layer of 30%, three convolutional layers, and three batch normalizations. Segmentation was then carried out by the final layer, which contained one convolutional layer and a sigmoid activation function. Figure 8 shows the complete architecture of the CNN model. Verification that two contraction/expansion processes was the optimal number was conducted through an inverse ablation study by comparing network performance metrics across two, three, and four expansion/contraction processes using one combination of perfusion parameters.
Fig. 8.

The network architecture for the CNN that utilized in this study. The architecture is based on a modified U-net with the input images section representing the CTP maps that are input into the network. The output prediction in this figure represents the output binary image, which segments infarct from the different combinations of input perfusion maps.
For utilization of our CNN, a training:testing:validation percentage split of 60:30:10 was used to prevent overfitting of the model. The split was conducted on the number of patients included in the study as opposed to the total number of images so infarct volumes could be reconstructed for each patient later on. This split allocated 38 patients to the training set, 19 patients to the testing set, and 6 patients to the validations set. This resulted in images being allocated to the training set, 2519 images being allocated to the testing set, and 795 images being allocated to the validation set for each CTP parameter. The aforementioned allocation numbers are based on each patient having 133 slices of infarct on average. Training of the model was conducted using every possible combination of multiple CTP maps, resulting in 26 different combinations as input to the network. For training the CNN parameters utilized included: an Adadelta optimizer, which automatically adjusts the learning rate during training, a batch size of 32, binary cross entropy dice loss, and early stopping of training if the loss did not improve over 10 epochs to prevent overfitting. The weights 10 epochs prior to the final epoch were saved and utilized for testing as these weights would have the highest segmentation metrics and the lowest amount of overfitting if any were to occur. Variability of the CNN was tested using Monte Carlo cross validation by training and testing the network 20 times for each combination of perfusion parameters. This cross-validation technique randomly allocates patients to the training, testing, and validation cohorts each time. Cases allocated to the testing set were manually checked to ensure all included patients were tested on at least once. Monte Carlo cross validation was chosen over -fold cross validation as -fold suggests a value of 10, which would allocate only six patients to the testing set. Although the bias between Monte Carlo and -fold cross validation would be the same since each patient is included in the testing set at least once, the variability would increase for -fold since it has fewer cases in the testing set compared to Monte Carlo cross validation.30 Each training and testing of the CNN was conducted using an NVIDIA (Nvidia Corporation, Santa Clara, California) P2000 graphical processing unit.
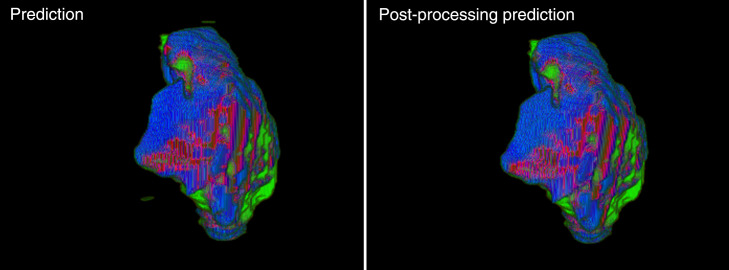
Following network training, testing of the network was conducted on slices from 19 patients, images containing infarct. All predictions (infarct/noninfarct) were made using a threshold of 0.5 from the prediction probabilities. 3D infarct volumes were reconstructed for each patient from the 2D prediction images. Postprocessing was conducted on the reconstruction volumes to remove small erroneous regions of infarct that were segmented in the contralateral hemisphere and at the base of the perfusion maps. This postprocessing method isolated all infarct lesions within the reconstructed volume and determined the size of each. All infarct volumes except for the largest lesion were then removed as they were likely errors in segmentation. Figure 9 shows the removal of small erroneous infarct segmentations by isolating the largest infarct lesion in the volume.
Fig. 9.
Reconstructed predicted infarct volumes from the CNN utilized in this study. Green regions indicate predicted infarct, blue indicates DWI infarct, and maroon indicates overlapping infarct. Note the removal of the small erroneously segmented infarct from the original image following postprocessing.
2.6. Conditional Random Field Postprocessing
Conditional random field (CRF) postprocessing was additionally utilized and compared with the infarct volume segmentation results without using this method. This was done mainly to remove false-positive infarct predicted regions. CRFs are a common graphical model used to improve segmentation predictions. This postprocessing typically provides finer segmentations and spatial consistency as standard CNN convolutional filters and max pooling layers produce coarse outputs. The major benefit of CRF postprocessing is it assigns similar labels to pixels with similar spatial location and intensity values.31 This allows for more uniform and defined boundaries of the segmented portion of the image.
To implement CRF postprocessing, unary and pairwise terms were generated for each of our 2D prediction images to calculate the energy of configuration [Eq. (1)]. Unary terms represent the inverse likelihood a pixel takes a specific label [first summation of Eq. (1)]. Pairwise terms represent the cost of assigning a specific label to multiple pixels simultaneously [second summation of Eq. (1)]. This indicates the pairwise term takes into consideration that pixels with similar location and intensity will likely have the same classification. The energy of configuration term is then used to model a CRF using a Gibbs distribution [Eq. (2)] where corresponds to the pixels in the image and corresponds to the specific image.31 A total of five inference steps were utilized for this postprocessing technique. Following CRF postprocessing, 2D slices were again used to reconstruct 3D infarct volumes and the largest infarct lesion was isolated from the volume through postprocessing
| (1) |
| (2) |
2.7. Statistical Analysis
Summary statistics for quantitative variables (i.e., age) and frequency distributions for categorical variables (i.e., sex) were calculated for patient demographics. For volume comparisons between each tested combination of CTP parameters and DWI, along with RAPID, Sphere, and Vitrea software, median infarct volumes and median absolute error were calculated. Repeated measures analysis of variance (ANOVA) analysis was used to determine if there was any difference between the predicted infarct volumes from the CNN with the commercially available CTP software. A statistical significance level of 0.05 was utilized for all testing. Spatial infarct agreement was assessed using Dice coefficient and positive predictive value (PPV) calculations. Dice coefficients were calculated as two times the number of positive predicted infarct voxels from CTP divided by the summation of total infarct voxels in both the CTP and DWI volumes. PPV was calculated as the number of true positive predicted infarct voxels from CTP divided by the summation of true positive and false positive infarct voxels from CTP. In essence, PPV indicates the percentage of the predicted CTP infarct lesion that lies within the DWI infarct lesion. Dice coefficients, PPVs, median infarct difference between the ground truth and prediction, and median absolute error were used to assess the optimal number of contraction/expansion processes. Weighted ranks were calculated for each perfusion parameter combination and commercially available software by rating each metric (median infarct volume, median absolute error, Dice coefficient, and PPV) from best to worst and averaging the ranks to see which combination or software was the best. Each metric was assigned an equal weight of 1. All aforementioned metrics were calculated prior to and after CRF postprocessing, and these results were additionally compared to assess if implementation of CRFs can improve infarct segmentation.
3. Results
Table 1 indicates patient demographics for all 63 AIS patients included in the study. Of the 63 included patients, 39 were successful endovascular intervention patients and 24 were conservative treatment patients. Time from onset of symptoms is indicated for all patients and for endovascular intervention patients since conservative treatment patients will have a longer time since onset of symptoms than intervention patients. In addition, reperfusion status is solely indicated for the 39 endovascular intervention patients with the majority, 23/39, achieving a status of TICI 2b.
Table 1.
Ischemic stroke patient characteristics.
| Characteristic | Mean | Standard deviation | Median | Interquartile range |
|---|---|---|---|---|
| Age (years) | 67.5 | 13.9 | 68.0 | 58.5 to 77.5 |
| National Institute of Health Stroke Scale score | 16.5 | 7.2 | 16.0 | 11.5 to 22.0 |
| Time from onset of symptoms to initial stroke imaging (minutes) | 508.4 | 755.0 | 186.0 | 90.5 to 686.0 |
| Reperfusion patients | ||||
| Time from onset of symptoms to initial stroke imaging (minutes) | 396.6 | 657.0 | 154.0 | 80.0 to 335.5 |
| Time from onset of symptoms to recanalization (minutes) | 485.6 | 654.1 | 241.0 | 147.5 to 446.5 |
| Time from initial stroke imaging to recanalization (minutes) |
89.0 |
86.4 |
63.0 |
56.5 to 82.5 |
| |
Percentage |
Fraction |
||
| Sex (male) | 46.0 | 29/63 | ||
| Middle cerebral artery occlusion | 71.4 | 45/63 | ||
| Posterior cerebral artery occlusion | 4.8 | 3/63 | ||
| Anterior cerebral artery occlusion | 1.6 | 1/63 | ||
| Internal carotid artery occlusion | 22.2 | 14/63 | ||
| TICI 2b | 59.0 | 23/39 | ||
| TICI 2c | 25.6 | 10/39 | ||
| TICI 3 | 15.4 | 6/39 | ||
Characteristics of all 63 ischemic stroke patients included within the study. Continuous quantitative variables, such as time since onset of symptoms, are displayed as summary statistics (mean, standard deviation, median, and interquartile range). Discrete variables, such as sex, are displayed as the fraction and percentage of patients with that characteristic.
Table 2 indicates the median infarct difference between predicted infarct using the CBF, CBV, TTP, and delay time perfusion parameters and ground truth DWI for multiple contraction/expansion processes. In addition, median absolute error, Dice coefficients, and PPVs for each number of contraction/expansion processes are indicated in the table. All results are indicated as 95% confidence intervals.
Table 2.
Performance metrics across various expansion/contraction processes.
| Number of contraction/expansion processes | Median infarct difference (mL) | Median absolute error (mL) | Dice coefficient | PPV |
|---|---|---|---|---|
| 2 | 14.83 | |||
| 3 | 15.02 | |||
| 4 | 14.64 |
Mean infarct difference, median absolute error, Dice coefficient, and PPVs for multiple number of contraction/expansion processes when using the CBF, CBV, TTP, and delay time perfusion parameters as input. 95% confidence intervals were calculated over 20 iterations of Monte Carlo cross validation.
Figure 10 represents the mean model accuracy, model Dice coefficient, and model loss over all epochs for all 20 iterations of Monte Carlo cross validation using the CBF and MTT parameters’ maps as input. The aforementioned metrics are shown for both the training and validation sets, which are represented as blue and orange curves, respectively. Ninety-five percent confidence intervals for the training and validation curves are indicated with green and gray shading, respectively. The dashed line in each plot indicates which epoch weights were utilized for testing as the final 10 epochs showed no loss improvement. Within the figure, loss is indicated as binary cross entropy dice loss. All plots for each perfusion parameter combination showed a similar pattern of exponential decay for the loss metric and logarithmic growth for the accuracy and Dice metrics.
Fig. 10.
The mean change in accuracy, Dice coefficient, and binary cross entropy Dice loss over each epoch over all 20 iterations of Monte Carlo cross validation for the training and validation sets. Training and validation 95% confidence intervals are indicated with green and gray shading, respectively. This example uses the CBF and MTT perfusion maps as the network input and all parameters showed similar trends in the plots.
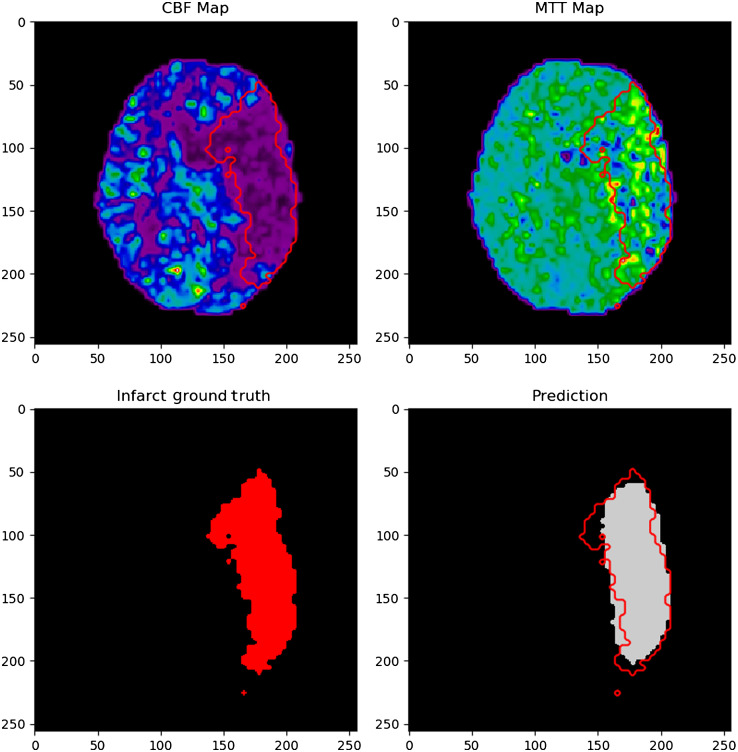
Figure 11 indicates an example of an infarct segmentation from 2D CTP slices using the developed CNN. Training of the CNN took 10 h on average and each infarct prediction took 0.003 s. The top two images represent the input CTP parameter maps used for infarct prediction, which are CBF and MTT in this example. The bottom left image shows the ground truth infarct label, which has been segmented for DWI. The bottom right image in the figure shows the predicted region of infarct in gray along with an overlap of the ground truth infarct outlined in red. The outline of ground truth infarct is also outlined in red on both input CTP maps used for the prediction, CBF and MTT. These images were resized as 256 pixels by 256 pixels for visualization purposes. For this specific example, the Dice coefficient between the infarct label and prediction is 0.86.
Fig. 11.
Input CBF and MTT network input maps as the upper images. The lower left image is the segmented infarct from DWI and the lower right images indicated the network infarct prediction. Ground truth infarct is outlined in red in the prediction in input images.
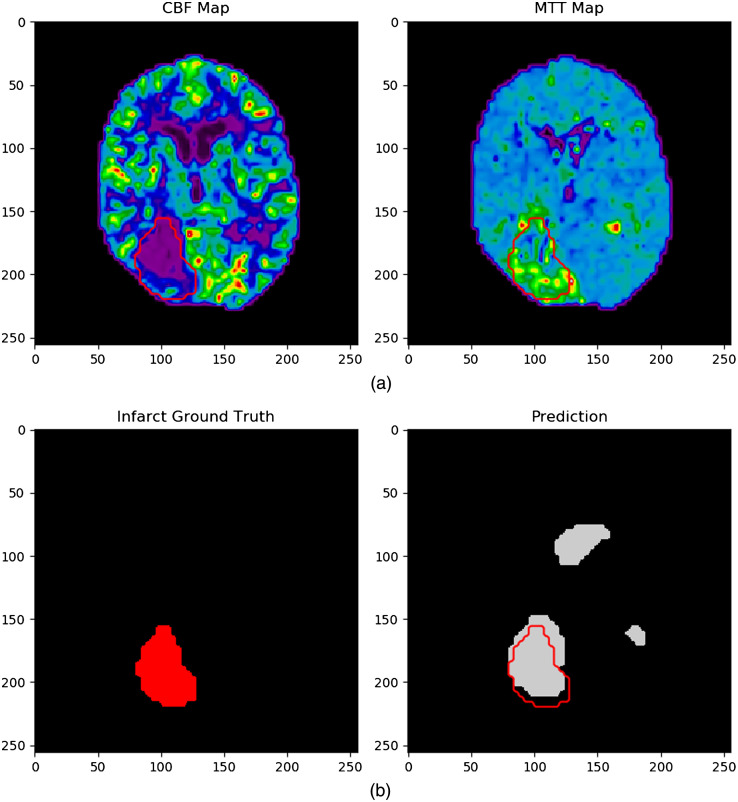
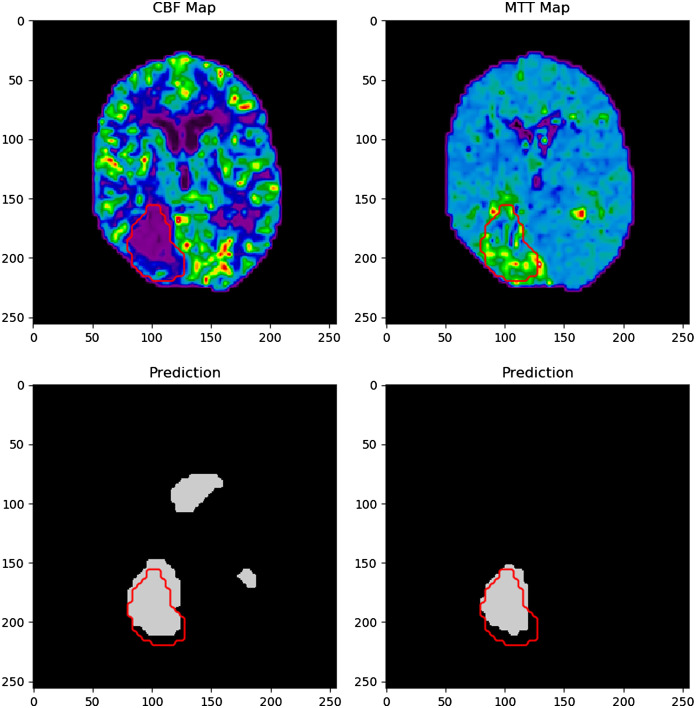
Figure 12 indicates an example of a failed infarct segmentation, with a Dice coefficient of 0.61, through overestimating the number of infarct regions. The top two images again indicated the CTP parameters input into the network to predict the region of infarct (bottom right) prior to watershed being utilized. Ground truth infarct regions are again outlined in red on the prediction image, which predicts the majority of the posterior infarct correctly, but has erroneously segmented infarct around the ventricle regions.
Fig. 12.
The network input (a) computed tomography maps and ground truth infarct and (b) network predicted infarct. Note the overestimation of infarct in the network prediction image which incorrectly identifies the ventricles as regions of infarction.
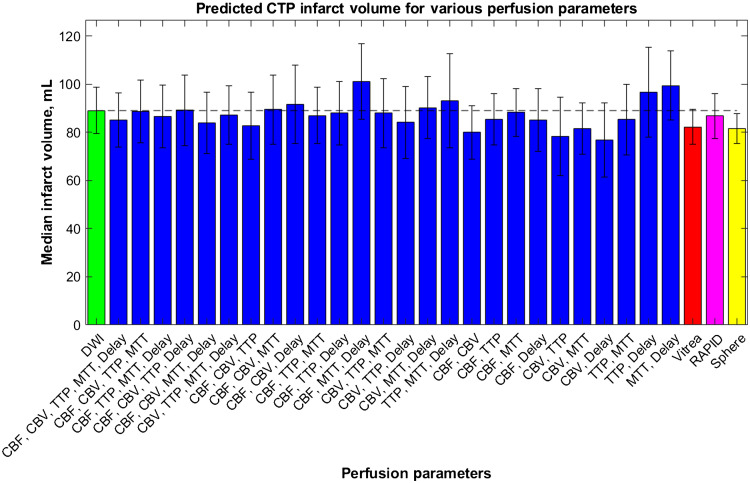
Using the 2D segmentations seen in the previous figure, median final infarct volumes were calculated when using each combination of perfusion parameters and are indicated in Fig. 13. In addition, median infarct volumes from RAPID, Sphere, and Vitrea are shown in Fig. 13 for comparison with the predictions from this study’s CNN. Error bars indicate 95% confidence levels, the green bar indicates the median infarct volume for DWI, and the dashed line allows for comparison of each parameter combination and software with the DWI infarct ground truth infarct. ANOVA analysis indicated no significant difference between any of the predicted infarct volumes with DWI.
Fig. 13.
The median infarct volumes calculated from each combination of CTP parameters from the developed CNN. The infarct volumes measured from DWI (green) and commercially available perfusion software: Vitrea (red), RAPID (pink), and Sphere (yellow). The dashed line is for comparison of each volume with ground truth infarct volumes.
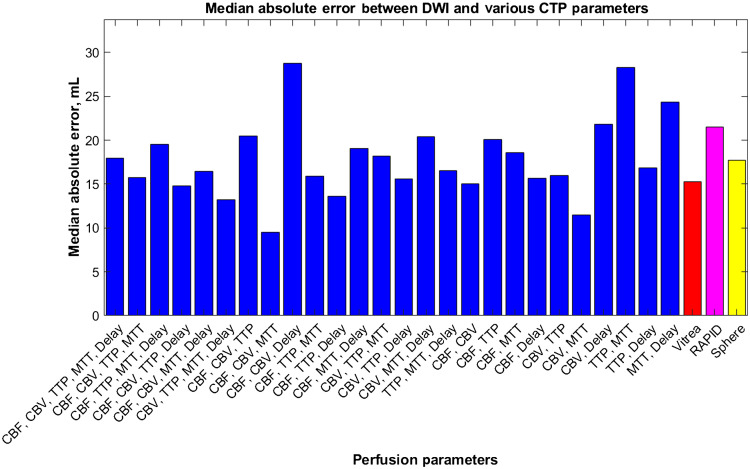
Figure 14 indicates the median absolute error values for each tested combination of CTP parameters along with the median absolute error values for RAPID, Sphere, and Vitrea when predicting infarct. In the figure, the majority of median absolute error values for the CNN are on par or better than the commercially available software indicating similar performance through low variability in results.
Fig. 14.
The median absolute error values for each tested perfusion parameter combination using our multiple input CNN. Vitrea, RAPID, and Sphere are also represented for comparison of our network with commercially available CTP software.
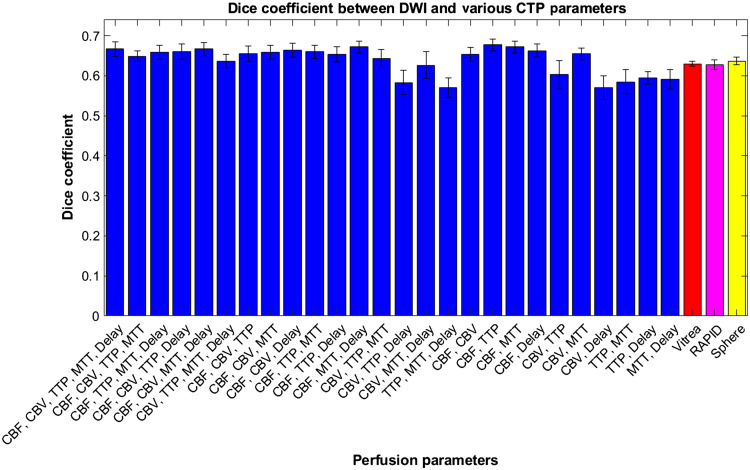
Within Fig. 15, average Dice coefficient values are represented for various CTP infarct estimation methods with DWI infarct. Error bars represent 95% confidence levels. It can be seen that the majority of Dice coefficient values are higher for the CNN infarct predictions compared with commercial software, but ANOVA analysis indicates they are not different to a significant degree.
Fig. 15.
Dice coefficients between segmented infarct from the developed CNN using multiple perfusion map combinations with DWI infarct. Dice coefficients are additionally included between ground truth infarct volumes with Vitrea, RAPID, and Sphere CTP software.
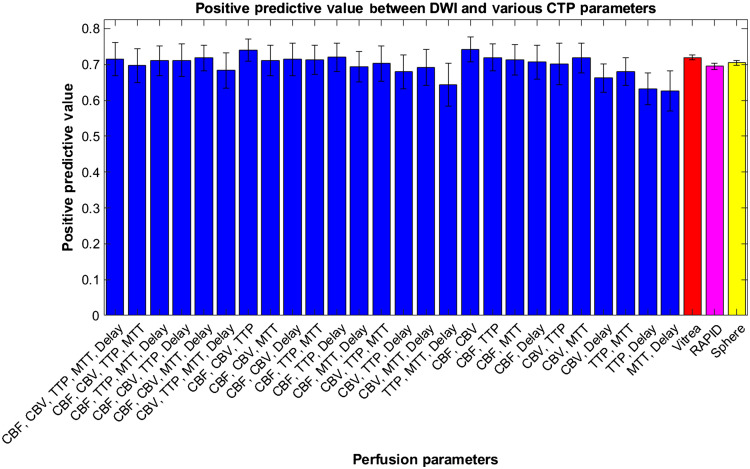
Figure 16 represents the average PPVs for each combination of perfusion parameters and commercially available software with DWI infarct. Error bars are represented as 95% confidence levels and commercially available software indicate lower variability in PPV results. ANOVA analysis again indicates no statistical difference between each perfusion parameter combination and commercially available software indicating our CNN’s performance is on par with current diagnosis methods.
Fig. 16.
Positive predictive values between diffusion weighted imaging infarct and predicted infarct from our CNN when trained on multiple CTP parameters. Vitrea, RAPID, and Sphere are also compared with ground truth infarct volumes and their respective PPVs are indicated.
Table 3 indicates the overall values of median infarct difference between DWI and CTP, median absolute error, Dice coefficient, and PPV for RAPID, Sphere, Vitrea, and all tested perfusion map combinations using our CNN. In addition, ranks for performance of each CTP estimation method are indicated in parentheses with 1 indicating the most efficient and 29 indicating the least efficient. A weighted average rank for each infarct estimation method is indicated in the right most column with all four metrics receiving equal weight in the final calculation. A lower value in the right most column indicates a more effective infarct assessment method with 6.5 being the best. This most effective method corresponds to our CNN when using the CBF, CBV, TTP, and delay time maps as our inputs.
Table 3.
Weighted rank calculation for CTP parameter combinations.
| CTP parameters | Median infarct difference, mL (rank) | Median absolute error, mL (rank) | Dice coefficient (Rank) | PPV (rank) | Weighted rank |
|---|---|---|---|---|---|
| CBF, CBV, TTP, MTT, delay | 3.93 (15) | 17.99 (17) | 0.67 (5) | 0.72 (8) | 11.25 |
| CBF, CBV, TTP, MTT | 0.33 (2) | 15.77 (10) | 0.65 (16) | 0.70 (19) | 11.75 |
| CBF, TTP, MTT, delay | 2.54 (11) | 19.50 (21) | 0.66 (10) | 0.71 (14) | 14 |
| CBF, CBV, TTP, delay | (1) | 14.84 (5) | 0.66 (8) | 0.71 (12) | 6.5 |
| CBF, CBV, MTT, Delay | 5.14 (19) | 16.43 (13) | 0.67 (4) | 0.72 (6) | 10.5 |
| CBV, TTP, MTT, delay | 1.89 (8) | 13.23 (3) | 0.64 (19) | 0.68 (23) | 13.25 |
| CBF, CBV, TTP | 6.23 (20) | 20.48 (24) | 0.66 (12) | 0.74 (2) | 14.5 |
| CBF, CBV, MTT | (3) | 9.51 (1) | 0.66 (11) | 0.71 (13) | 7 |
| CBF, CBV, delay | (12) | 28.78 (29) | 0.66 (6) | 0.71 (9) | 14 |
| CBF, TTP, MTT | 2.03 (9) | 15.89 (11) | 0.66 (9) | 0.71 (11) | 10 |
| CBF, TTP, delay | 1.09 (5) | 13.65 (4) | 0.65 (15) | 0.72 (3) | 6.75 |
| CBF, MTT, delay | (28) | 19.09 (20) | 0.67 (2) | 0.69 (21) | 17.75 |
| CBV, TTP, MTT | 1.10 (6) | 18.20 (18) | 0.64 (17) | 0.70 (17) | 14.5 |
| CBV, TTP, delay | 4.93 (18) | 15.63 (8) | 0.58 (27) | 0.68 (25) | 19.5 |
| CBV, MTT, delay | (7) | 20.38 (23) | 0.63 (22) | 0.69 (22) | 18.5 |
| TTP, MTT, delay | (17) | 16.51 (14) | 0.57 (29) | 0.64 (27) | 21.75 |
| CBF, CBV | 9.05 (25) | 15.05 (6) | 0.65 (14) | 0.74 (1) | 11.5 |
| CBF, TTP | 3.66 (13) | 20.12 (22) | 0.68 (1) | 0.72 (5) | 10.25 |
| CBF, MTT | 0.80 (4) | 18.62 (19) | 0.67 (3) | 0.71 (10) | 9 |
| CBF, delay | 3.96 (16) | 15.68 (9) | 0.66 (7) | 0.71 (15) | 11.75 |
| CBV, TTP | 10.62 (27) | 16.00 (12) | 0.60 (23) | 0.70 (18) | 20 |
| CBV, MTT | 7.60 (24) | 11.48 (2) | 0.65 (13) | 0.72 (7) | 11.5 |
| CBV, delay | 12.22 (29) | 21.79 (26) | 0.57 (28) | 0.66 (26) | 27.25 |
| TTP, MTT | 3.68 (14) | 28.28 (28) | 0.59 (26) | 0.68 (24) | 23 |
| TTP, delay | (23) | 16.84 (15) | 0.60 (24) | 0.63 (28) | 22.5 |
| MTT, delay | (26) | 24.36 (27) | 0.59 (25) | 0.63 (29) | 26.75 |
| Vitrea | 6.79 (21) | 15.28 (7) | 0.63 (20) | 0.72 (4) | 13 |
| RAPID | 2.26 (10) | 21.48 (25) | 0.63 (21) | 0.70 (20) | 19 |
| Sphere | 7.57 (22) | 17.74 (16) | 0.64 (18) | 0.70 (16) | 18 |
Median infarct difference, median absolute error, Dice coefficient, and PPVs for each combination of tested CTP parameters and commercially available software. Ranks for each metric are indicated in parentheses and weighted average ranks for overall performance are shown in the final column. Best results are in bold.
An infarct prediction when using CRF postprocessing is indicated in Fig. 17 and has the same input maps (CBF and MTT) as in Fig. 12. Following postprocessing, it is shown in the bottom right image that the infarct prediction from the CNN more accurately matches with the ground truth from DWI with a Dice coefficient of 0.80. The prediction no longer contains erroneous infarct segmentation around the ventricles compared with when postprocessing was not utilized. Since CRFs utilize intensity and spatial location to improve segmentation, the MTT map specifically indicates why the ventricles are no longer segmented as infarct due to their low parameter values compared with where infarct is actually located.
Fig. 17.
Network performance when using CBF and MTT maps with CRF postprocessing (bottom right) compared with no postprocessing (bottom left). Note the strong agreement between the ground truth infarct area (red outline) and predicted infarct without any erroneously segmented infarct around the ventricles.
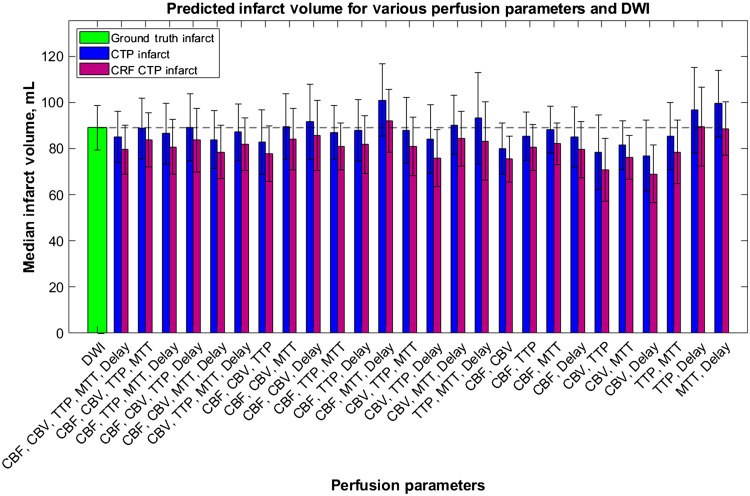
Figure 18 shows a comparison of median infarct volumes from the DWI, the original CNN perfusion combination predictions, and CNN predictions following CRF postprocessing. The green and blue bars again represent DWI and original CNN infarct predictions, respectively. Meanwhile, the maroon bars indicate the CNN infarct prediction volumes following CRF postprocessing. The dashed line allows for comparison with the ground truth DWI infarct volume and error bars indicate 95% confidence levels. Note the decrease in estimated volume for all median infarct volumes when using CRF postprocessing.
Fig. 18.
Predicted infarct volumes from the developed network prior to and after using CRF postprocessing. Both methods are compared with final infarct volumes from DWI with the dashed line allowing for the comparison across all tested parameter combinations.
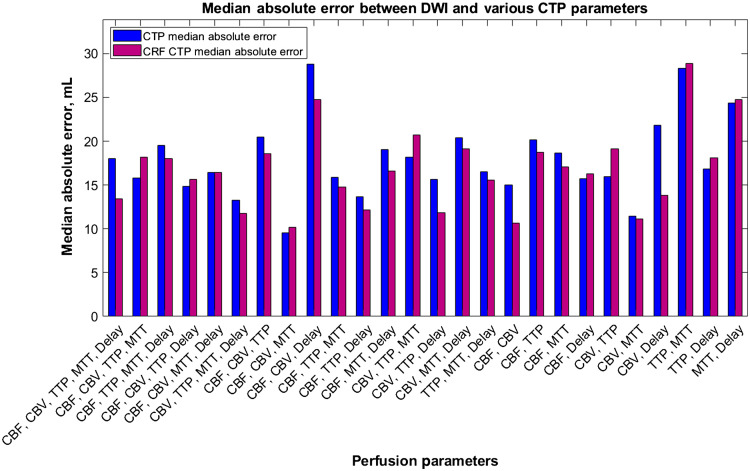
Median absolute error values for original CNN infarct predictions and postprocessing CRF predictions are indicated in Fig. 19. Original prediction median absolute errors are indicated in blue while CRF predictions are indicated in maroon. No clear pattern is indicated regarding an increase or decrease median absolute errors when using CRF postprocessing.
Fig. 19.
Median absolute error values for each perfusion parameter combination before and after CRF postprocessing. No direct pattern is seen as error values both increase and decrease when utilizing this postprocessing technique.
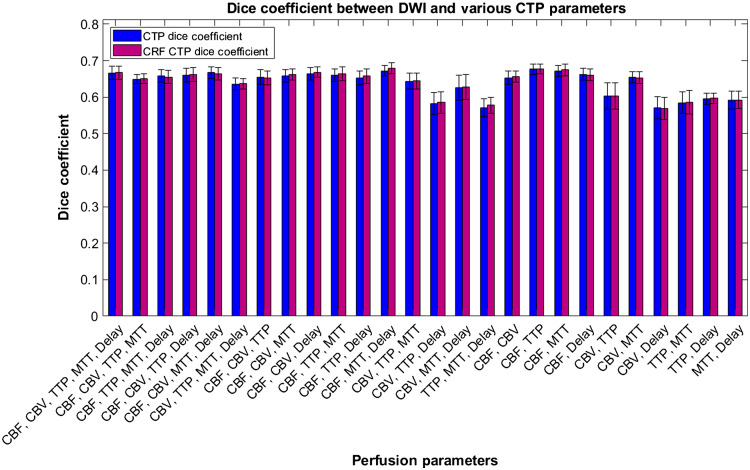
Figure 20 indicates Dice coefficients following CRF postprocessing. Error bars indicate 95% confidence levels. The majority of the Dice coefficient values are equal to or slightly higher when using CRF postprocessing, but not to a significant level as indicated by ANOVA testing.
Fig. 20.
Pre- and post-CRF processing Dice coefficients between DWI and perfusion parameter combinations tested with our network. All combinations of parameters show an increase in Dice coefficients when utilizing CRF postprocessing.
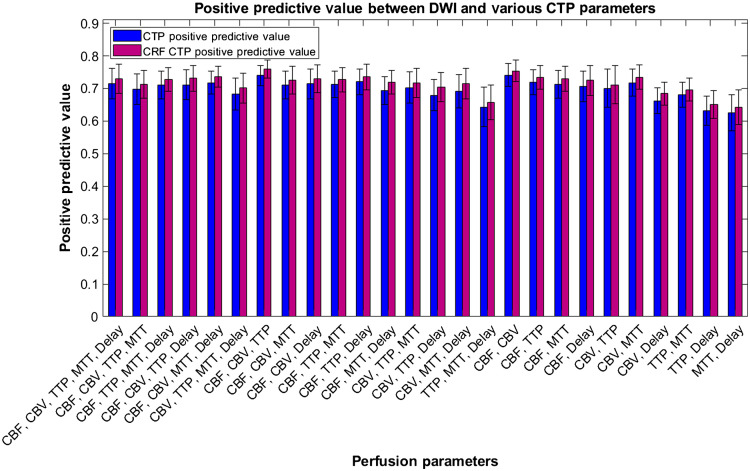
PPVs when utilizing postprocessing compared with just a CNN to segment infarct is indicated in Fig. 21. Note that all PPV values are higher when using CRF postprocessing. Ninety-five perfect confidence levels are indicated as error bars within the figure. An increase in PPV values indicates more of the predicted CTP infarct lesion is located within the ground truth DWI infarct lesion.
Fig. 21.
PPV comparisons between pre- and post-CRF processing for all utilized perfusion parameter combinations. Note the pattern of all PPVs increasing following this postprocessing leading to a greater percentage of the infarct lesion being in the final DWI infarct lesion.
Table 4 shows median infarct differences, median absolute error, Dice coefficient, and PPVs for all tested CTP parameter combinations following CRF postprocessing along with values for RAPID, Sphere, and Vitrea. Ranks for performance of each infarct estimation method are indicated in parentheses with 1 indicating the most accurate and 29 indicating the least accurate. Weighted average ranks are indicated in the last column by averaging all of the ranks from the four utilized metrics together. Lower overall weighted ranks indicate the combination of perfusion parameters or software provides a more accurate estimation and spatial location of infarct volumes. For this study, the CBF, CBV, and MTT parameters show the lowest weighted rank of 7.5 indicating they are the optimal combination for infarct assessment when using CRF post-processing.
Table 4.
Weighted rank calculation for CRF postprocessing CTP parameter combinations.
| CTP parameters | Median infarct difference, mL (rank) | Median absolute error, mL (rank) | Dice coefficient (rank) | PPV (rank) | Weighted rank |
|---|---|---|---|---|---|
| CBF, CBV, TTP, MTT, delay | 9.49 (21) | 13.44 (7) | 0.67 (5) | 0.73 (8) | 10.25 |
| CBF, CBV, TTP, MTT | 5.33 (9) | 18.16 (20) | 0.65 (16) | 0.71 (19) | 16 |
| CBF, TTP, MTT, delay | 8.31 (18) | 17.99 (18) | 0.66 (13) | 0.73 (11) | 15 |
| CBF, CBV, TTP, delay | 5.29 (8) | 15.68 (12) | 0.66 (8) | 0.73 (7) | 8.75 |
| CBF, CBV, MTT, delay | 10.55 (23) | 16.41 (14) | 0.66 (6) | 0.74 (3) | 11.5 |
| CBV, TTP, MTT, delay | 7.15 (13) | 11.74 (4) | 0.64 (18) | 0.70 (23) | 14.5 |
| CBF, CBV, TTP | 11.30 (24) | 18.60 (21) | 0.65 (15) | 0.76 (1) | 15.25 |
| CBF, CBV, MTT | 4.83 (7) | 10.14 (1) | 0.66 (9) | 0.73 (13) | 7.5 |
| CBF, CBV, delay | 3.48 (5) | 24.74 (28) | 0.67 (4) | 0.73 (10) | 11.75 |
| CBF, TTP, MTT | 8.14 (17) | 14.76 (9) | 0.66 (7) | 0.73 (12) | 11.25 |
| CBF, TTP, delay | 7.28 (14) | 12.13 (6) | 0.66 (11) | 0.74 (4) | 8.75 |
| CBF, MTT, delay | (4) | 16.63 (15) | 0.68 (1) | 0.72 (15) | 8.75 |
| CBV, TTP, MTT | 8.10 (16) | 20.71 (25) | 0.64 (17) | 0.72 (17) | 18.75 |
| CBV, TTP, delay | 13.24 (26) | 11.85 (5) | 0.59 (27) | 0.70 (22) | 20 |
| CBV, MTT, delay | 4.78 (6) | 19.14 (24) | 0.63 (21) | 0.72 (18) | 17.25 |
| TTP, MTT, delay | 5.80 (10) | 15.56 (11) | 0.58 (28) | 0.66 (27) | 19 |
| CBF, CBV | 13.59 (27) | 10.65 (2) | 0.66 (12) | 0.75 (2) | 10.75 |
| CBF, TTP | 8.50(19) | 18.76 22) | 0.68 (2) | 0.73 (6) | 12.25 |
| CBF, MTT | 6.92 (12) | 17.08 (16) | 0.68 (3) | 0.73 (9) | 10 |
| CBF, delay | 9.46 (20) | 16.31 (13) | 0.66 (10) | 0.72 (14) | 14.25 |
| CBV, TTP | 18.21 (28) | 19.12 (23) | 0.60 (23) | 0.71 (20) | 23.5 |
| CBV, MTT | 12.80 (25) | 11.13 (3) | 0.65 (14) | 0.74 (5) | 11.75 |
| CBV, delay | 19.99 (29) | 13.86 (8) | 0.57 (29) | 0.68 (26) | 23 |
| TTP, MTT | 10.49 (22) | 28.90 (29) | 0.59 (26) | 0.70 (24) | 25.25 |
| TTP, delay | (2) | 18.07 (19) | 0.60 (24) | 0.65 (28) | 18.25 |
| MTT, delay | 0.41 (1) | 24.73 (27) | 0.59 (25) | 0.64 (29) | 20.5 |
| Vitrea | 6.79 (11) | 15.28 (10) | 0.63 (20) | 0.72 (16) | 14.25 |
| RAPID | 2.26 (3) | 21.48 (26) | 0.63 (22) | 0.70 (25) | 19 |
| Sphere | 7.57 (15) | 17.74 (17) | 0.64 (19) | 0.70 (21) | 18 |
Median infarct difference, median absolute error, Dice coefficient, and PPVs for each combination of tested CTP parameters following CRF postprocessing and commercially available software. Ranks for each metric are indicated in parentheses and weighted average ranks for overall performance are shown in the final column. Best results are in bold.
4. Discussion
In this study, an assessment of whether a CNN can be used with multiple input CTP parameters to accurately segment and localize infarct tissue conducted. In addition, our results were compared with commercially available RAPID, Sphere, and Vitrea CTP software. Since commercially available software utilize contralateral hemisphere comparison thresholds to identify infarct tissue, there have been many different studies conducted showing which are the optimal thresholds in addition to which parameters should be used to identify infarct.14,15,32–34 However, since the optimal thresholds utilized rely on the computational algorithm utilized to generate the perfusion maps, optimal thresholds are not uniform across software.34 In addition, some patients have been known to have naturally low flow conditions in one hemisphere of the brain compared with the contralateral side. These baseline flow conditions could result in the misdiagnosis of infarct tissue when in fact the region of the brain with decreased perfusion has been functioning properly for the individual’s entire life. To address some of these challenges, we investigated a CNN data-driven approach where we used the golden standard for the infarct tissue imaging, DWI, and CTP images, which are the first line of imaging for patients presenting with brain ischemia.
From the result in Table 2, it can be seen that the two contraction/expansion process was the optimal number compared with three or four. This is evident since the median infarct difference was closest to 0 mL for two processes while most other metrics were very similar. These metrics being similar is likely due to all possible features already being extracted when using two processes meaning the additional of more processes has little impact on the network’s performance. Since little difference is seen between most of the metrics, having a shallower U-net also allows for improved computational efficiency.
Within Fig. 10, it can be seen that there is approximately a 0.08 difference in the calculated Dice coefficient between the training and validation sets when utilizing the testing weights. Although this difference may indicate slight overfitting by the network, the sample size of the validation set may have also created the separation in these curves. Even though thousands of images are used in the validation set, only six patients are included and each patient has their own specific hemodynamics. In the event the network has not seen a patient with similar hemodynamics, 1/6th of the results from the validation set will be impacted causing the performance in this set to decrease. Therefore, a larger dataset could decrease the separation seen between the curves in Fig. 10.
Results for using a CNN with multiple input maps indicate the following combinations of perfusion parameters were the most accurate in assessing infarct based on the weighted ranks in Table 3: (1) CBF, CBV, TTP, delay time, (2) CBF, TTP, delay time, (3) CBF, CBV, MTT. Although the use of CBF, CBV, TTP, and delay time as the input is the most accurate based on the ranks, this combination of parameters has been shown to overestimate the amount of infarct present. This overestimation of infarct can be dangerous as it can potentially lead to patient exclusion from endovascular reperfusion procedures, which could allow them to regain lost neurological function. For this reason, many clinical software will underestimate the amount of infarct present to give a patient the best change to be included in such procedures. It should be noted that underestimation of infarct does also come with the risk of hemorrhage in the form of reperfusion injury.32 Reperfusion injury occurs when regions of the brain have been deprived from oxygen for an extended period of time and are then reintroduced to oxygenated blood. This reintroduction results in oxidative damage and severe inflammation of the infarct region.35
This study demonstrated that utilization of a CNN with multiple perfusion parameter maps is an improvement over single input maps as indicated in a previously conducted study.17 Inclusion of multiple parameters aids in segmentation of infarct since the size of the infarct lesion has typically grown between initial CTP imaging and follow-up DWI imaging. Due to this increase in size from initial to follow-up imaging, a perfect Dice coefficient is impossible to achieve, which explains why our Dice coefficient are in the 0.6 range. This growth is usually due to the conversion of penumbra to infarct as the patient is waiting to be treated though thrombectomy or because the thrombectomy was not a complete success (i.e., TICI 2b). Therefore, utilization of the TTP parameter is seen in the most accurate combinations of parameters because TTP is typically used to estimate penumbra volumes in commercially available software such as Vitrea and Sphere.12,15 The network is likely able to estimate an original infarct volume from CBF and CBV, which are used in clinically available RAPID, Sphere, and Vitrea to assess infarct, and then increase of the size of the infarct lesion through inclusion of some penumbra from the TTP parameter. MTT can be said to have the same effect as regions of increased MTT indicate penumbra, which is likely why it is included in the third most accurate combination of perfusion parameters.12,14
Further assessment of the CNN also shows there may be instances in which the network has difficulties in differentiating between the ventricle region and infarct. This is evident in Fig. 12 by the segmentation of infarct over the front ventricles. This error in segmentation is likely due to the decrease in CBF and CBV in that region, which is commonly associated with infarct regions. In addition, parameters such as TTP will show an increase in time in both the ventricle and infarct regions meaning the network is relying more on spatial position as opposed to intensity values to prevent classification of the ventricles as infarct.12 One issue with the MTT parameter is that infarct can be represented as severely increased or decreased regions of flow. Typically, MTT will be very low in regions of infarct when the CT scan is not started at the proper time leading to truncation of the TDC.36 This fluctuation in what intensities should represent infarct from the MTT parameter may have negatively impacted the network’s ability to accurately assess infarct around the ventricle while utilizing this perfusion parameter map.
When comparing the segmentation of our network using multiple perfusion parameters with commercially available software, it can be seen that over 1/3 of the CNN tests resulted in more accurate infarct assessment than Vitrea when compared with DWI. In addition, of the CNN tests performed better than RAPID and Sphere based on the weighted ranks. This improved segmentation accuracy with our CNN compared to these software is likely influenced by our CNN using more perfusion parameters to segment infarct. Note that Vitrea performed the best compared with the other two commercially available software and it utilizes the most perfusion parameters to identify infarct. Although the inclusion of more parameters can introduce the curse of dimensionality, which can potentially hinder the accuracy of the model, the inclusion of more parameters in this instance allows for a greater description of the patient’s hemodynamics, which is essential in locating ischemic tissue.37 Furthermore, the CNN not using contralateral hemisphere thresholds likely increases segmentation accuracy as the network is not only solely relying on the opposite hemisphere values but also regions surrounding the ischemic tissue to identify infarct tissue. The ability of our network to predicted infarct location in additionally shows an improvement over commercial software in regards to clinical workflow. Due to RAPID sending raw CTP data offsite to be analyzed, it can take upwards of 15 min to receive infarct predictions, which is drastically longer than our network.14
The results from utilizing postprocessing CRFs indicate the following parameters to be the most accurate in assessing infarct tissue, with a three-way tie for second best: (1) CBF, CBV, MTT, (2) CBF, TTP, delay time, (3) CBF, MTT, delay time, (4) CBF, CBV, TTP, delay time. Of these optimal perfusion parameter combinations, all but CBF, MTT, and delay time were included in the optimal combinations when not utilizing CRF postprocessing. For all four of these combinations, it can be seen that the PPVs increase and Dice coefficients slightly increase when utilizing CRF postprocessing, indicating CRF postprocessing is limited. In addition, after CRF postprocessing, all infarct volume estimations decrease from the original CNN predictions. This leads to CRF postprocessing only having two median infarct overestimation compared with eight seen for the original network. This indicates fewer patients would be incorrectly deemed thrombectomy ineligible using the CRF postprocessing method. In addition, the increase in Dice coefficient, increase in PPV, and decrease in infarct volumes indicate the number of false positive labeled infarct voxels has decreased. Although this may appear as though the CTP volume measurements are less accurate because they may not be as close to the DWI infarct volume, the segmentation of infarct is actually more accurate as the degree of spatial overlap between CTP and DWI volumes has increased. Furthermore, CRF postprocessing provides a superior method compared with the original CNN since there is less variability in the infarct segmentation. This is evident by the median absolute error being less for 17 of the 26 possible perfusion parameter combinations.
The previous statement of the spatial segmentation being more accurate after using CRF postprocessing can be seen in Fig. 17. This figure shows the removal of false positive infarct regions around or near the ventricles when using CRF postprocessing (bottom right image) compared with no postprocessing (bottom left image). This removal of false positive regions likely occurs since the CRF method takes into account spatial location and similar intensity values when improving infarct segmentation. Since infarct cannot occur within the ventricles, the CRF prevents infarct segmentation within those regions, further improving the network segmentation and reducing the amount of variability seen compared with the original CNN. The removal of these false positive regions additionally will increase the Dice coefficient and PPVs due to more spatial overlap. Furthermore, the volume of infarct in this figure has decreased, which again supports CRF postprocessing aiding in accurate segmentation of infarct tissue even though the overall volume estimation may decrease leading to it being further from the ground truth DWI value than the original CNN estimated infarct volume. Results from our CRF network output were shown to two neurosurgeons at our comprehensive stroke center and were endorsed for use in stroke patient evaluation.
The results from our top three CRF networks, with infarct underestimation, tend to align very well with what is seen from commercially available RAPID, Vitrea, and Sphere. All three models and commercial software underestimate infarct, which is the preference in a clinical setting to enroll more patients in reperfusion procedures. In addition, it is seen that there is difference between the highest and lowest infarct estimation from our top three models and the commercial software. However, when examining weighted ranks, 2/5, 2/3, and 4/5 of the tested CRF models rank higher than Vitrea, Sphere, and RAPID, respectively. This is due to the lower degree of spatial overlap seen using the commercially available software, which can likely be attributed to the use of contralateral hemisphere comparisons that have shown erroneous infarct segmentation in the past.14
When comparing the results of this network with previously conducted studies, it was found that our network had superior performance metrics. Two previously conducted studies demonstrated Dice coefficients of 0.52 and 0.56 with the former having a PPV of 0.59.38,39 These studies likely had lower performance metrics due to the use of 3D segmentation compared with the 2D segmentation and volume reconstruction used in this study. When utilizing 3D segmentation, the network is faced with a more difficult task as the convolutional kernels are parsing through more data, leading to the extraction of more features, which may or may not be beneficial for the segmentation task. Furthermore, using 3D segmentation reduces the sample size of the dataset compared with using the 2D slices from each volume. Compared with a third study, which similarly used 2D segmentation to isolate infarct lesions, our network was superior in performance compared with a Dice coefficient of 0.55 and a PPV of 0.58.40 This network, however, only utilized one combination of CTP parameters (CBV, CBF, MTT, and Tmax) as opposed to testing different combinations of these parameters. Had this study utilized all combinations of the available parameters, their results may have improved.
Limitations of this study include the use of only Vitrea CTP generated maps as input for the utilized CNN. There are many other CTP software such as Sphere, RAPID, syngo.via (Siemens Healthcare, Erlangen, Germany), and IntelliSpace Portal (Philips Corporation, Amsterdam, Noord Holland, Netherlands), which all generate different perfusion maps based on the algorithm utilized. Such algorithms consist of Bayesian, standard singular value decomposition, circular singular value decomposition, and oscillar singular value decomposition. Of the listed algorithms, standard singular value decomposition is the only delay sensitive algorithm, while oscillar singular value decomposition is semiadaptive and Bayesian is adaptive.34,41,42 These parameters influence the final calculation of each perfusion map indicating our trained CNN will only wok when testing Bayesian algorithm Vitrea maps. The use of only 63 patients within the study is a further limitation. Although we utilized slices from each patient’s CTP volume to increase the dataset, increasing the number of patients in the study would increase the generalizability of the network as it would see a greater variability in cases overall. Another limitation to this study is it was not investigated whether other CNN multiple input methods allowed for a more accurate infarct segmentation. For our CNN, we only utilized multiple channels to input the CTP data as opposed to essentially training separate networks on each parameter and concatenating the results prior to the final prediction layer. In addition, our study only focused on the segmentation of infarct tissue and did not include segmentation of penumbral regions to utilize defuse 3 criteria for identifying thrombectomy eligible patients. A future study should be conducted to segment penumbral regions using CTP and assess the performance of this method.
Further study limitations, which can be addressed but are beyond the purpose of this initial report, include the use of a watershed method to isolate the largest infarct lesion from the predicted volume. Although this watershed method allows for the elimination of small, erroneously segmented infarcts, it prevents the inclusion of multiple lesions in the volume in the event there are two or more true infarct lesions. Therefore, in the event a bilateral infarction is present, the postprocessing method would eliminate one of the bilateral lesions. A potential way to solve this issue would be to include second lesions above the average size of a typical infarct lesion. An additional limitation to the study is a clinical interobserver study was not conducted to determine if the limited differences seen between each model would result in different clinical decisions being made. A future prospective study should be conducted to determine how many patients would be correctly deemed thrombectomy eligible for each model. An additional prospective study should be conducted to determine how many of the patient treatments resulted in a good clinical outcome when each model’s infarct prediction deemed a patient to be thrombectomy eligible. A further limitation is the method for segmenting the infarct ground truth is mostly automated, and labels were only reviewed by one individual, indicating they may not supply as perfect a segmentation as manually segmenting infarcts from DWI. This could influence results of the study if the training labels are not a perfect representation of what the ground truth infarct should be.
A nonperfect registration of the CTP and DWI volumes could have also limited the accuracy of the results for this study. Since the overlap of ventricles between CTP and DWI volumes has a Dice coefficient of , this could have resulted in some of the ground truth infarct regions not aligning with the specific regions they should when training the CNN with CTP parameter maps. This is to be expected however since the slice thicknesses of DWI and CTP images are 5 and 0.5 mm, respectively, indicating a high degree of interpolation for the DWI images. This would then lead to training of the network not being as optimal as it could be, which would decrease the accuracy of the results. A final limitation to this study is that all cases used were from the same comprehensive stroke center and no outside cases were included from other centers.
5. Conclusion
Utilization of CNNs with multiple input perfusion parameter maps has proven to be just as accurate in segmenting infarct tissue compared with commercially available CTP software, such as RAPID, Sphere, and Vitrea. The use of CNNs to segment infarcts allows for the elimination of nonuniversal contralateral hemisphere comparison thresholds when using commercially available software. This is beneficial as this method accounts for both hemodynamic parameters and spatial locations when determining infarct volumes. This could potentially improve the rate of clinical workflow and allow for more accurate diagnosis of patients eligible for endovascular intervention procedures.
Acknowledgments
This research was partially funded by a research grant provided by Canon Medical Systems USA, Inc. The company was not involved in the collection, analysis, interpretation, or drafting of this manuscript.
Biography
Biographies of the authors are not available.
Disclosures
Kenneth V. Snyder- Consulting and teaching for Canon Medical Systems Corporation, Penumbra Inc., Medtronic, and Jacobs Institute. Cofounder: Neurovascular Diagnostics, Inc. Elad I. Levy- Shareholder/ownership interests: NeXtGen Biologics, RAPID Medical, Claret Medical, Cognition Medical, Imperative Care (formerly the Stroke Project), Rebound Therapeutics, StimMed, Three Rivers Medical; National Principal Investigator/Steering Committees: Medtronic (merged with Covidien Neurovascular) SWIFT Prime and SWIFT Direct Trials; Honoraria: Medtronic (training and lectures); consultant: Claret Medical, GLG Consulting, Guidepoint Global, Imperative Care, Medtronic, Rebound, StimMed; advisory board: Stryker (AIS Clinical Advisory Board), NeXtGen Biologics, MEDX, Cognition Medical, Endostream Medical; site principal investigator: CONFIDENCE study (MicroVention), STRATIS Study—Sub I (Medtronic). Jason M. Davies- Research grant: National Center for Advancing Translational Sciences of the National Institutes of Health under award number KL2TR001413 to the University at Buffalo. Speakers’ bureau: Penumbra; Honoraria: Neurotrauma Science, LLC; shareholder/ownership interests: RIST Neurovascular. Adnan H. Siddiqui- Research grant: NIH/NINDS 1R01NS091075 as a coinvestigator for “Virtual Intervention of Intracranial Aneurysms”; financial interest/investor/stock options/ownership: Amnis Therapeutics, Apama Medical, Blink TBI Inc., Buffalo Technology Partners Inc., Cardinal Consultants, Cerebrotech Medical Systems, Inc. Cognition Medical, Endostream Medical Ltd., Imperative Care, International Medical Distribution Partners, Neurovascular Diagnostics Inc., Q’Apel Medical Inc, Rebound Therapeutics Corp., Rist Neurovascular Inc., Serenity Medical Inc., Silk Road Medical, StimMed, Synchron, Three Rivers Medical Inc., Viseon Spine Inc.; Consultant/advisory board: Amnis Therapeutics, Boston Scientific, Canon Medical Systems USA Inc., Cerebrotech Medical Systems Inc., Cerenovus, Corindus Inc., Endostream Medical Ltd., Guidepoint Global Consulting, Imperative Care, Integra LifeSciences Corp., Medtronic, MicroVention, Northwest University–DSMB Chair for HEAT Trial, Penumbra, Q’Apel Medical Inc., Rapid Medical, Rebound Therapeutics Corp., Serenity Medical Inc., Silk Road Medical, StimMed, Stryker, Three Rivers Medical, Inc., VasSol, W.L. Gore & Associates; principal investigator/steering comment of the following trials: Cerenovus NAPA and ARISE II; Medtronic SWIFT PRIME and SWIFT DIRECT; MicroVention FRED & CONFIDENCE; MUSC POSITIVE; and Penumbra 3D Separator, COMPASS, and INVEST. Ciprian N. Ionita-Equipment grant from Canon Medical Systems, Cummings Foundation support.
Contributor Information
Ryan A. Rava, Email: ryanrava@buffalo.edu.
Alexander R. Podgorsak, Email: arpodgor@buffalo.edu.
Muhammad Waqas, Email: mwaqas@ubns.com.
Kenneth V. Snyder, Email: ksnyder@ubns.com.
Maxim Mokin, Email: mokin@health.usf.edu.
Elad I. Levy, Email: elevy@ubns.com.
Jason M. Davies, Email: jdavies@ubns.com.
Adnan H. Siddiqui, Email: asiddiqui@ubns.com.
Ciprian N. Ionita, Email: cnionita@buffalo.edu.
References
- 1.Benjamin E. J., Muntner P., Bittencourt M. S. J. C., “Heart disease and stroke statistics-2019 update: a report from the American Heart Association,” Circulation 139(10), e56–e528 (2019). 10.1161/CIR.0000000000000659 [DOI] [PubMed] [Google Scholar]
- 2.Benjamin E. J., et al. , “Heart disease and stroke statistics—2017 update: a report from the American Heart Association,” Circulation 135(10), e146 (2017). 10.1161/CIR.0000000000000485 [DOI] [PMC free article] [PubMed] [Google Scholar]
- 3.Krupinski J., et al. , “Role of angiogenesis in patients with cerebral ischemic stroke,” Stroke 25(9), 1794–1798 (1994). 10.1161/01.STR.25.9.1794 [DOI] [PubMed] [Google Scholar]
- 4.Dani K. A., et al. , “Computed tomography and magnetic resonance perfusion imaging in ischemic stroke: definitions and thresholds,” Ann. Neurol. 70(3), 384–401 (2011). 10.1002/ana.22500 [DOI] [PubMed] [Google Scholar]
- 5.Heldner M. R., et al. , “Clinical prediction of large vessel occlusion in anterior circulation stroke: mission impossible?” J. Neurol. 263(8), 1633–1640 (2016). 10.1007/s00415-016-8180-6 [DOI] [PubMed] [Google Scholar]
- 6.Turk A., et al. , “Use of self-expanding stents in distal small cerebral vessels,” Am. J. Neuroradiol. 28(3), 533–536 (2007). [PMC free article] [PubMed] [Google Scholar]
- 7.Guenego A., et al. , “Hypoperfusion ratio predicts infarct growth during transfer for thrombectomy,” Ann. Neurol. 84(4), 616–620 (2018). 10.1002/ana.25320 [DOI] [PubMed] [Google Scholar]
- 8.Mokin M., et al. , “Endovascular treatment of acute ischemic stroke: the end or just the beginning?” Neurosurg. Focus 36(1), E5 (2014). 10.3171/2013.10.FOCUS13374 [DOI] [PubMed] [Google Scholar]
- 9.Long J., Qin H., Zhang H., “Evaluation of recanalisation treatment on posterior circulation ischemic stroke by Solitaire device—a multicenter retrospective study,” Neurol. Neurochir. Pol. 51(3), 208–213 (2017). 10.1016/j.pjnns.2017.02.004 [DOI] [PubMed] [Google Scholar]
- 10.Lansberg M. G., Bluhmki E., Thijs V. N., “Efficacy and safety of tissue plasminogen activator 3 to 4.5 hours after acute ischemic stroke: a metaanalysis,” Stroke 40(7), 2438–2441 (2009). 10.1161/STROKEAHA.109.552547 [DOI] [PMC free article] [PubMed] [Google Scholar]
- 11.Perfusion Imaging, Regents of the University of California, San Diego, California: (2019). [Google Scholar]
- 12.Miles K., Eastwood J. D., Konig M., Multidetector Computed Tomography in Cerebrovascular Disease: CT Perfusion Imaging, CRC Press; (2007). [Google Scholar]
- 13.Rava R. A., et al. , “Feasibility of locating infarct core with 2D angiographic parametric imaging (API) using computed tomography perfusion data,” Proc. SPIE 10948, 109485T (2019). 10.1117/12.2511980 [DOI] [Google Scholar]
- 14.Rava R., et al. , “Assessment of a Bayesian Vitrea CT perfusion analysis to predict final infarct and Penumbra volumes in patients with acute ischemic stroke: a comparison with RAPID,” Am. J. Neuroradiol. 41, 206–212 (2020). 10.3174/ajnr.A6395 [DOI] [PMC free article] [PubMed] [Google Scholar]
- 15.Rava R., et al. , “Assessment of computed tomography perfusion software in predicting spatial location and volume of infarct in acute ischemic stroke patients: a comparison of sphere, Vitrea, and RAPID,” J. Neurointerv. Surg. 13, 130–135 (2020). [DOI] [PubMed] [Google Scholar]
- 16.Graves A., et al. , “A novel connectionist system for improved unconstrained handwriting recognition,” IEEE Trans. Anal. Mach. Intell. 31(5), 855–868 (2009). 10.1109/TPAMI.2008.137 [DOI] [PubMed] [Google Scholar]
- 17.Rava R., et al. , “Use of a convolutional neural network to identify infarct core using computed tomography perfusion parameters,” SPIE Med. Imaging (2021). [DOI] [PMC free article] [PubMed] [Google Scholar]
- 18.Chavez J. C., et al. , “Pharmacologic interventions for stroke: looking beyond the thrombolysis time window into the penumbra with biomarkers, not a stopwatch,” Stroke 40(10), 558–563 (2009). 10.1161/STROKEAHA.109.559914 [DOI] [PubMed] [Google Scholar]
- 19.Desai S. M., et al. , “Thrombectomy 24 hours after stroke: beyond DAWN,” J. Neurointerv. Surg. 10(11), 1039–1042 (2018). 10.1136/neurintsurg-2018-013923 [DOI] [PubMed] [Google Scholar]
- 20.Visser F., et al. , “High‐resolution magnetization‐prepared 3D‐FLAIR imaging at 7.0 Tesla,” Magn. Reson. Med. 64(1), 194–202 (2010). 10.1002/mrm.22397 [DOI] [PubMed] [Google Scholar]
- 21.Rinaldi P., et al. , “DWI in breast MRI: role of ADC value to determine diagnosis between recurrent tumor and surgical scar in operated patients,” Eur. J. Radiol. 75(2), e114–e123 (2010). 10.1016/j.ejrad.2010.01.018 [DOI] [PubMed] [Google Scholar]
- 22.Kamran S., et al. , “Significance of hyperintense vessels on FLAIR MRI in acute stroke,” Neurology 55(2), 265–269 (2000). 10.1212/WNL.55.2.265 [DOI] [PubMed] [Google Scholar]
- 23.Ho C. Y., et al. , “Accuracy of CT cerebral perfusion in predicting infarct in the emergency department: lesion characterization on CT perfusion based on commercially available software,” Emerg. Radiol. 20(3), 203–212 (2013). 10.1007/s10140-012-1102-8 [DOI] [PMC free article] [PubMed] [Google Scholar]
- 24.Madai V. I., et al. , “DWI intensity values predict FLAIR lesions in acute ischemic stroke,” PLoS One 9(3), e92295 (2014). 10.1371/journal.pone.0092295 [DOI] [PMC free article] [PubMed] [Google Scholar]
- 25.Hu H. H., et al. , “Assessment of cerebral blood perfusion reserve with acetazolamide using 3D spiral ASL MRI: preliminary experience in pediatric patients,” Magn. Reson. Imaging 35, 132–140 (2017). 10.1016/j.mri.2016.08.019 [DOI] [PubMed] [Google Scholar]
- 26.Maknojia S., et al. , “Visualization of brain shift corrected functional magnetic resonance imaging data for intraoperative brain mapping,” World Neurosurg. X 2, 100021 (2019). 10.1016/j.wnsx.2019.100021 [DOI] [PMC free article] [PubMed] [Google Scholar]
- 27.Muthukumaran D., Sivakumar M., “Medical image registration: a matlab based approach,” Int. J. Sci. Res. Comput. Sci. Eng. Inf. Technol. 2(1), 29–34 (2017). [Google Scholar]
- 28.Mattes D., et al. , “PET-CT image registration in the chest using free-form deformations,” IEEE Trans. Med. Imaging 22(1), 120–128 (2003). 10.1109/TMI.2003.809072 [DOI] [PubMed] [Google Scholar]
- 29.Qassim H., Verma A., Feinzimer D., “Compressed residual-VGG16 CNN model for big data places image recognition,” in IEEE 8th Annu. Comput. and Commun. Workshop and Conf. (CCWC), pp. 169–175 (2018). 10.1109/CCWC.2018.8301729 [DOI] [Google Scholar]
- 30.Burman P., “A comparative study of ordinary cross-validation, v-fold cross-validation and the repeated learning-testing methods,” Biometrika 76(3), 503–514 (1989). 10.1093/biomet/76.3.503 [DOI] [Google Scholar]
- 31.Zheng S., et al. , “Conditional random fields as recurrent neural networks,” in Proc. IEEE Int. Conf. Comput. Vision, pp. 1529–1537 (2015). 10.1109/ICCV.2015.179 [DOI] [Google Scholar]
- 32.Mokin M., et al. , “Predictive value of RAPID assessed perfusion thresholds on final infarct volume in SWIFT PRIME (Solitaire with the intention for thrombectomy as primary endovascular treatment),” Stroke 48(4), 932–938 (2017). 10.1161/STROKEAHA.116.015472 [DOI] [PubMed] [Google Scholar]
- 33.Jovin T. G., et al. , “Diffusion-weighted imaging or computerized tomography perfusion assessment with clinical mismatch in the triage of wake up and late presenting strokes undergoing neurointervention with Trevo (DAWN) trial methods,” Int. J. Stroke 12(6), 641–652 (2017). 10.1177/1747493017710341 [DOI] [PubMed] [Google Scholar]
- 34.Rava R., et al. , “Effect of computed tomography perfusion post-processing algorithms on optimal threshold selection for final infarct volume prediction,” Neuroradiol. J. 33, 273–285 (2020). 10.1177/1971400920934122 [DOI] [PMC free article] [PubMed] [Google Scholar]
- 35.Pan J., et al. , “Reperfusion injury following cerebral ischemia: pathophysiology, MR imaging, and potential therapies,” Neuroradiology 49(2), 93–102 (2007). 10.1007/s00234-006-0183-z [DOI] [PMC free article] [PubMed] [Google Scholar]
- 36.Kudo K., et al. , “Differences in CT perfusion maps generated by different commercial software: quantitative analysis by using identical source data of acute stroke patients,” Radiology 254(1), 200–209 (2009). 10.1148/radiol.254082000 [DOI] [PubMed] [Google Scholar]
- 37.Rust J., “Using randomization to break the curse of dimensionality,” Econ.: J. Econ. Soc. 65, 487–516 (1997). [Google Scholar]
- 38.Hu X., et al. , “StrokeNet: 3D local refinement network for ischemic stroke lesion segmentation,” in Int. MICCAI Brainlesion Workshop (2018). [Google Scholar]
- 39.Song T., “3D multi-scale U-net with atrous convolution for ischemic stroke lesion segmentation,” in Proc. MICCAI ISLES 2018 Challenge (2018). [Google Scholar]
- 40.Clèrigues A., et al. , “Acute ischemic stroke lesion core segmentation in CT perfusion images using fully convolutional neural networks,” Comput. Biol. Med. 115, 103487 (2019). 10.1016/j.compbiomed.2019.103487 [DOI] [PubMed] [Google Scholar]
- 41.Hou P., et al. , “TH‐C‐L100J‐01: investigation of quantitative cerebral blood flow measurement from dynamic‐susceptibility contrast perfusion MR imaging on 3T system,” Med. Phys. 34(6Part22), 2621–2621 (2007). 10.1118/1.2761639 [DOI] [Google Scholar]
- 42.Ulas S. T., et al. , “Perfusion in hand arthritis on dynamic contrast-enhanced computed tomography: a randomized prospective study using MRI as a standard of reference,” Skeletal Radiol. 50, 59–68 (2020). 10.1007/s00256-020-03526-5 [DOI] [PMC free article] [PubMed] [Google Scholar]


