Abstract
In the present study, an antibacterial biomedical magnesium (Mg) alloy with a low biodegradation rate was designed, and ZK30-0.2Cu-xMn (x = 0, 0.4, 0.8, 1.2, and 1.6 wt%) was produced by selective laser melting, which is a widely applied laser powder bed fusion additive manufacturing technology. Alloying with Mn evidently influenced the grain size, hardness, and biodegradation behavior. On the other hand, increasing Mn content to 0.8 wt% resulted in a decrease of biodegradation rate which is attributed to the decreased grain size and relatively protective surface layer of manganese oxide. Higher Mn contents increased the biodegradation rate attributed to the presence of the Mn-rich particles. Taken together, ZK30-0.2Cu-0.8Mn exhibited the lowest biodegradation rate, strong antibacterial performance, and good cytocompatibility.
Keywords: Magnesium alloy, Selective laser melting, Biodegradation, Antibacterial activity, Grain refinement
1. Introduction
Magnesium (Mg) alloy is a new metal implant material that has suitable rates of biodegradation and good biocompatibility[1-4]. The further research is the development of antibacterial Mg alloys, such as Cu-containing Mg alloys. These are promising biodegradable antibacterial implant materials[5-7] because Cu can provide an antibacterial effect which can resolve clinical infection in bone regeneration and in other orthopedic applications. However, the degradation rate of Cu-containing Mg alloys is very rapid because the Cu-containing intermetallic compounds cause microgalvanic corrosion[5-7]. Alloying has been widely used to ameliorate the degradation rate of Mg alloys.
Alloying with Mn may refine the grain size and decrease the corrosion rate[8-10]. Moreover, Mn is an essential trace element in the human body and the Mn that is released during Mg alloy degradation is non-toxic to human body[11]. Appropriate Mn level can promote the growth and development of bones and improve hematopoietic function of the body[12]. However, the uniform dispersion of Mn in Mg alloys remains a big challenge in conventional casting process because Mn reduces the fluidity of Mg alloys which facilitates Mn segregation[13]. Hence, it is necessary to develop a method to produce homogeneous Mn-containing Mg alloys.
Selective laser melting (SLM) as a widely applied laser powder bed fusion metallic additive manufacturing technology[14-22] can rapidly melt mixed powders of Mn and Mg alloys and cause rapid solidification in the melt pool, resulting in a homogenous microstructure with fine grains. Therefore, SLM can produce homogeneous Mn-containing Mg alloys that are expected to have a refined grain size and a lower corrosion rate. Furthermore, grain refinement can increase the mechanical properties.
As stated above, alloying Mn into a antibacterial Cu-containing Mg alloy using SLM was suggested and investigated in this article to decrease the corrosion rate and retain the antibacterial activity of the Cu-containing Mg alloy. This method can produce antibacterial Mg-based alloys with the desired lower corrosion rate. Furthermore, mechanical properties may be improved by alloying and grain refinement. Previous work indicated that ZK30 (Mg-3Zn-0.5Zr) had good mechanical properties and biodegradation resistance[13,23]. When Cu was added to ZK30 by SLM, SLMed ZK30-0.2Cu had a uniform microstructure, good cytocompatibility, and antibacterial performance[23].
In this study, SLM was used to produce antibacterial Mg alloys from Cu powder (0.2 wt.% Cu), Mn powder (0, 0.4, 0.8, 1.2, and 1.6 wt.% Mn), and ZK30 powder. The microstructure, hardness, biodegradation, antibacterial performance, and cytotoxicity of these alloys were investigated. This proposed method is a new approach for the composition design and the manufacturing process to develop novel antibacterial Mg-based biodegradable alloys.
2. Materials and methods
2.1. Materials preparation
Gas atomized spherical ZK30 powder, pure Cu powder (99.9%), and irregularly shaped pure Mn powder (99.9%) were used. The composition of ZK30 powder is presented in Table 1. The ZK30 powder was mechanically mixed with 0.2 wt% Cu powder and different content of Mn powder (0, 0.4, 0.8, 1.2, and 1.6 wt%) was added by ball milling[14] at a rotation rate of 150 rpm in the atmosphere of SF6 (1 vol%) and CO2 (balance) for 180 min. ZK30-0.2Cu-xMn alloys (x = 0, 0.4, 0.8, 1.2, and 1.6) were produced using a self-regulating SLM system[24] in a chamber filled with high purity argon. The fiber laser had an output power of 500 W and a wavelength of 1064 nm. The minimum focused spot diameter of laser beam was 50 μm. The parameters of the process are as follows: The spot size was 150 μm, scanning speed was at 200 mm/min, laser power was 80 W, and the specimen size is 8 mm × 8 mm × 5 mm.
Table 1.
The composition of the ZK30 powder (wt%)
| Powder | Mg | Zn | Zr | Al | Cu | Fe | Mn | Ni | Si |
|---|---|---|---|---|---|---|---|---|---|
| ZK30 | 96.34 | 3.16 | 0.48 | 0.002 | 0.002 | 0.01 | 0.0068 | 0.0036 | 0.01 |
2.2. Microstructural and mechanical characterizations
The specimens of the SLMed ZK30-0.2Cu-xMn alloys were metallurgically ground and polished and etched in a solution of nitric acid and alcohol (4 mL nitric acid and 96 mL ethanol) for 5 – 10 s. The microstructures were characterized using optical microscopy (OM, Leica DMI 3000 L) and scanning electron microscopy (SEM, JSM-5600LV, JEOL Co., Tokyo, Japan) equipped with energy dispersive spectroscopy (EDS, JSM-5910LV, JOEL Ltd., Japan). Intermetallic second phases were analyzed using X-ray diffraction (XRD) monochromatic Cu-Kα radiation at 15 mA and 30 kV, with scattering angles ranging from 10° to 80°, step size 0.02° and scanning speed 8°/min. The hardness was measured using a microhardness tester for 10 s under 2.942 N load.
2.3. Electrochemical tests
The electrochemical behavior of SLMed ZK30-0.2Cu-xMn alloys at room temperature in simulated body fluid (SBF) was characterized by potentiodynamic polarization curves, measured using an electrochemical workstation (MULTI AUTOLAB M204). The ionic concentrations of the standardized SBF solution that corresponds to the concentration of the ions in the blood are shown in Table 2. The specimen with the exposed area of 0.8 mm × 0.8 mm was encapsulated with epoxy resin and a Cu wire was used as the conducting wire. The polarization curve was measured by a three-electrode configuration. The specimen was the working electrode (WE), a platinum gauze (25 mm × 25 mm; 60 mesh) was the counter electrode (CE). A saturated Ag/AgCl electrode (in saturated KCl) was the reference electrode (RE). Potentiodynamic polarization curves were measured at a scan rate of 5 mV/s after the specimen was immersed for 2500 s at the open circuit potential and steady corrosion conditions had been established. The biodegradation rate (Pi, mm year−1) was calculated from the corrosion current density (icorr, mA cm−2), using[25,26]:
Table 2.
The ion concentrations of SBF and human blood plasma according to the ISO standard (10−3 mol/L)
| Ion | SBF (pH 7.40) | Blood plasma (pH 7.2–7.4) |
|---|---|---|
| Na+ | 142 | 142 |
| K+ | 5.0 | 5.0 |
| Mg2+ | 1.5 | 1.5 |
| Ca2+ | 2.5 | 2.5 |
| Cl− | 148 | 103 |
| HCO3− | 4.2 | 27 |
| HPO42− | 1.0 | 1.0 |
| SO42− | 0.5 | 0.5 |

2.4. Immersion tests
Immersion tests were conducted on the basis of ASTM G31-72 (the ratio of the solution volume [mL] to specimen surface area [cm2] was 30:1) in SBF solution for 168 h. The initial weight of specimen was recorded before immersion, the degradation solution was refreshed every 24 h to keep the pH value at about 7.4. Funnels were used to collect the evolved hydrogen by covering the samples. The specimen was cleaned using acetone and water to remove the corrosion products and then weighed. The biodegradation rate (Ph, mm y−1) was calculated from hydrogen evolution rate (Vh, ml/cm2 day) and the biodegradation rate (Pw, mm year−1) was calculated from the weight loss rate (DW, mg cm−2 d−1) using[25,26]:

The surface morphologies and corrosion products of the specimens after immersion were characterized by SEM with EDS and X-ray photoelectron spectroscopy (XPS). The XPS measurements were achieved using an X-ray source of Mg Kα (1253.6 eV). The binding energy of the measurement was corrected by the binding energy of C1s of hydrocarbons (284.6 eV) absorbed on the surface.
2.5. Antibacterial properties
Staphylococcus aureus (S. aureus, ATCC 25923) is one of the most common bacteria causing infection and was, therefore, used as a model bacterium. The preparation method of SLMed ZK30-0.2Cu-xMn alloy extracts for antibacterial test was as follows. After disinfection by ultraviolet radiation, all the samples and control groups were cultured in SBF solution with S. aureus in three replicates and placed in a 12-well untreated polystyrene plate. Each well contained sample and S. aureus suspension with a concentration of with a concentration of 1–10 × 105 colony-forming unit (CFU)/ml prepared using sterile SBF solution. The ratio of the specimen surface are (cm2) to the solution volume (mL) were 1.25 cm2/mL. The plates were kept at constant temperature for 4, 12, 48, 72, and 96 h at 37 ± 0.5°C. Bacterial cell density in the SBF solution was evaluated by bacterial counting after each culture period. Before calculating the number of colonies, the suspension was diluted to 1–10 × 103 CFU/ml, and 0.05 ml suspension was added to the LB nutrient agar plate, which was carefully spread and plated and then incubated for 24 h at 37 ± 0.5°C.
2.6. Cytocompatibility
Cell compatibility, which is essential for biomedical implant materials, was studied using the MG63 osteosarcoma cells. The cytocompatibility was evaluated by carrying out cell proliferation assay and fluorescence live/dead staining assay. The extracts of SLMed ZK30-0.2Cu-xMn alloys were extracted in the humidified atmosphere containing 5% CO2 at 37°C for 24 h using Dulbecco’s Modified Eagle’s Medium as extraction medium with an extraction rate of 1.25 cm2/ml. The supernatant was extracted, centrifuged, and filtered to produce the extract. The extract was refrigerated at 4°C to prepare for cell viability test. CCK-8 assays were used to examine the proliferation of MG63 cells cultured in SLMed ZK30-0.2Cu-xMn and Ti extracts. The fluorescence live/dead staining assay was performed based on the following procedures. Cells were cultured on a 96-well plate at the density of 5 × 10³ cells per 100 ml for 24 h to ensure cell adherence. The medium was then replaced by 100 mL extract. After 1 day and 3 days of incubation, the cell viability was determined by live/dead staining.
3. Results
3.1. Microstructure
Figure 1 shows optical microstructures of the SLMed ZK30-0.2Cu-xMn alloys. The microstructures of all the alloys consist of fine equiaxed grains. The grain size decreased with increasing Mn content. The grain size of SLMed ZK30-0.2Cu was about 5 μm, as shown in Figure 1A, which was smaller than that obtained by traditional casting[27]. Increasing Mn contents decreased the grain size, as shown in Figure 1B through Figure 1E. The grain size of SLMed ZK30-0.2Cu-1.6Mn alloy was about 3 μm. This indicates that the incorporation of Mn into SLMed ZK30-0.2 Cu refines grain size. The small grain size produced by SLM is attributed to the rapid solidification of the melt pool. The additional grain refinement by alloying Mn is attributed to additional nucleation sites and grain boundary pinning effect provided by Mn, which can inhibit grain growth.
Figure 1.
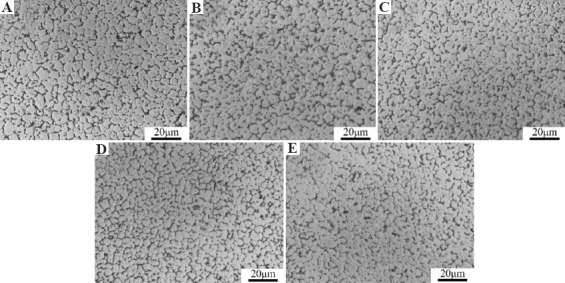
Optical microstructures of SLMed ZK30-0.2Cu-xMn. (A) x = 0, (B) x = 0.4, (C) x = 0.8, (D) x = 1.2, (E) x = 1.6.
Figure 2 shows the XRD patterns of the SLMed ZK30-0.2Cu-xMn alloys. The XRD patterns for SLMed ZK30-0.2Cu, SLMed ZK30-0.2Cu-0.4Mn, and SLMed ZK30-0.2Cu-0.8Mn included peaks of α-Mg, MgZnCu, and MgZn2 phases. For a Mn content higher than 0.8 wt.%, SLMed ZK30-0.2Cu-xMn alloys (x = 1.2 and 1.6) also produced diffraction peaks of the α-Mn phases.
Figure 2.
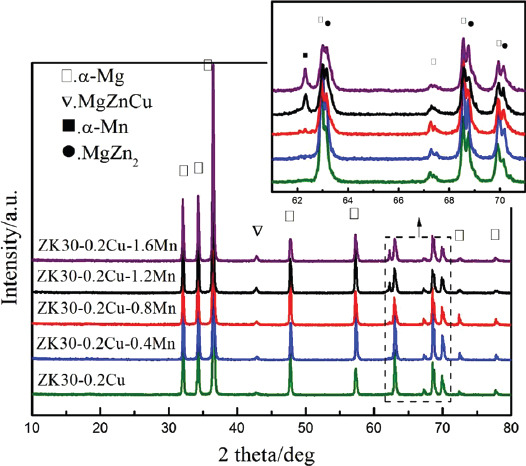
X-ray diffraction spectra of SLMed ZK30-0.2Cu-xMn.
The microstructure of SLMed ZK30-0.2Cu-1.6Mn is presented at a higher magnification SEM micrograph in Figure 3A. Numerous irregularly shaped intermetallic phases were distributed inside the grains and along grain boundaries. The composition of the intermetallic phases at Point 1, Point 2, and Point 3 in Figure 3A is presented in Figure 3B determined from the EDS spectra. Point 1 (bright granular precipitate distributed along the grain boundaries) was composed of Zn and Mg; Point 2 (short bar-shaped precipitate distributed along the grain boundaries) was composed of Zn, Mg, and Cu; and Point 3 (spheroidal precipitate scattered along grain boundaries and inside the grains) was composed of Mg and Mn. There was good agreement between the composition results determined respectively by EDS spectra and XRD patterns. This indicates the presence of MgZn2, MgZnCu, and α-Mn phases in SLMed ZK30-0.2Cu-1.6Mn.
Figure 3.
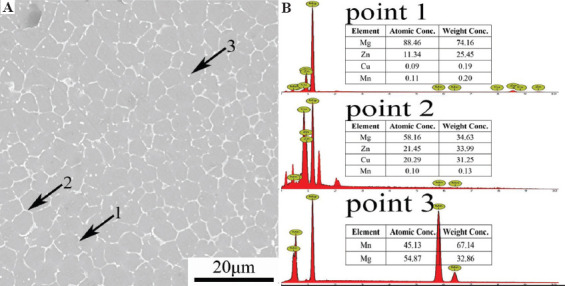
(A) Scanning electron microscopy microstructure and (B) energy-dispersive spectroscopy spectra of points 1~3 of SLMed ZK30-0.2Cu-1.6Mn.
3.2. Hardness
Figure 4 presents the Vickers hardness values measured on the polished surface of the SLMed ZK30-0.2Cu-xMn. The hardness of the SLMed ZK30-0.2Cu was 92 ± 3 HV, while a typical hardness of cast Mg alloys is ~70 HV[28]. This indicates that SLM significantly enhances the hardness of the Mg alloys which is attributed to the grain refinement introduced by rapid solidification during the SLM process.
Figure 4.
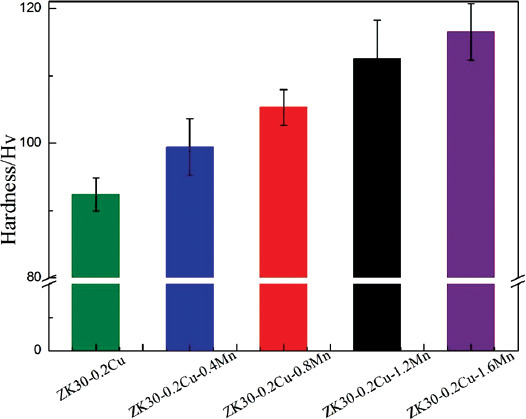
Hardness of SLMed ZK30-0.2Cu-xMn.
The incorporation of Mn into ZK30-Cu by SLM further increased the hardness. The hardness increased with the Mn content to a maximum hardness of 117 ± 4 HV for the Mn content of 1.6 wt%. This hardness increase is attributed to grain refinement, solid solution strengthening, and second-phase strengthening due to the Mn incorporation. This indeed verifies that Mn is an effective reinforcement for Mg alloys and hardening is attained through the incorporation of Mn into the Mg alloy through SLM.
3.3. Biodegradation
Figure 5 shows potentiodynamic polarization curves for SLMed ZK30-0.2Cu-xMn tested at 37 ± 0.5°C in the SBF solution. The incorporation of Mn into ZK30-0.2Cu by SLM resulted in a change in the corrosion potential (Ecorr) and the corrosion current density (icorr). The Ecorr increased with Mn content, which was attributed to the more positive electrochemical potential of Mn, compared to Mg. The icorr values were derived from the linear part of the cathodic branch of the polarization potential curves using Tafel extrapolation. The incorporation of Mn into ZK30-0.2Cu by SLM first decreased the icorr values. The icorr values of SLMed ZK30-0.2Cu and SLMed ZK30-0.2Cu-0.4Mn were 29 mA/cm2 and 18 mA/cm2, respectively. The icorr had the minimum value of 12 mA/cm2, while Mn content was 0.8 wt.%. Thereafter, with Mn content increased to 1.2 wt% and 1.6 wt%, the icorr increased to 32 mA/cm2 and 40 mA/cm2, respectively, and was even higher than that for the SLMed ZK 30-0.2Cu without Mn. Using Equation 1, the biodegradation rates were calculated from the icorr values and are presented in Table 3.
Figure 5.
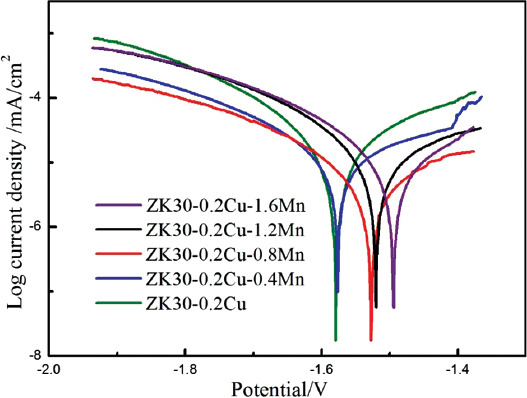
Potentiodynamic polarization curves of SLMed ZK30-0.2Cu-xMn.
Table 3.
Corrosion rate of SLMed ZK30-0.2Cu-xMn
| Materials | ZK30-0.2Cu | ZK30-0.2 Cu-0.4Mn | ZK30-0.2 Cu-0.8Mn | ZK30-0.2 Cu-1.2Mn | ZK30-0.2 Cu-1.6Mn |
|---|---|---|---|---|---|
| Vh (ml [cm2 day]−1) | 0.67±0.03 | 0.56±0.03 | 0.48±0.06 | 0.71±0.04 | 0.93±0.04 |
| Ph (mm year−1) | 1.53±0.07 | 1.28±0.07 | 1.09±0.14 | 1.62±0.09 | 2.12±0.09 |
| ΔW (mg [cm2 day]−1) | 0.68±0.01 | 0.59±0.02 | 0.47±0.01 | 0.73±0.02 | 0.8±0.02 |
| Pw (mm/year) | 1.43±0.02 | 1.24±0.04 | 0.99±0.02 | 1.53±0.04 | 1.68±0.04 |
| Icorr (μA cm−2) | 29 | 18 | 12 | 32 | 40 |
| Pi (mm year−1) | 0.7 | 0.4 | 0.3 | 0.7 | 0.9 |
Figure 6 shows hydrogen evolution data (Figure 6A) and weight loss data (Figure 6B) of the SLMed specimens immersed in SBF for 168 h (i.e., 7 days). All the SLMed alloys exhibited an increase in hydrogen evolution volume with immersion time increased, but the rate of hydrogen evolution was fast at the initial 120 h period and then slowed down when immersion time increased, which might be attributed to a slightly increased protectiveness of corrosion layers, which could prevent the corrosion from penetrating into the Mg matrix and thus decrease the corrosion rate. The incorporation of Mn into ZK30-0.2Cu by SLM significantly influenced the hydrogen evolution. The hydrogen evolution volume first decreased, reached a minimum the content of Mn increased to 08 wt%, and hereafter increased when Mn content further increased. There was a direct correlation of the influence of the Mn content on the hydrogen evolution volume and the weight loss rate, that is, the weight loss rate first decreased and had the minimum with Mn content that was increased to 0.8 wt.% and hereafter decreased when Mn content further increased. The biodegradation rates, calculated from hydrogen evolution rate and weight loss rate using Equation 2 and Equation 3 respectively, are listed in Table 3.
Figure 6.
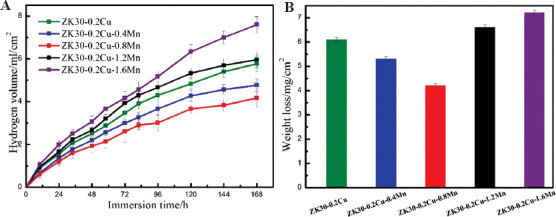
Biodegradation behaviors: (A) Hydrogen evolution, (B) weight loss.
The biodegradation rate determined by weight loss and hydrogen evolution showed generally good agreement, whereas the biodegradation rate derived from the polarization curves was apparently lower, which is commonly observed[29,30]. However, these methods showed the same trends. In view of the above, SLMed ZK30-0.2Cu-0.8Mn had the lowest biodegradation rate, and the biodegradation rates of SLMed ZK30-0.2Cu-xMn alloys in a decreasing order are shown as follows: SLMed ZK30-0.2Cu-1.6Mn >SLMed ZK30-0.2Cu-1.2Mn >SLMed ZK30-0.2Cu >SLMed ZK30-0.2Cu-0.4Mn > SLMed ZK30-0.2Cu-0.8Mn.
Figure 7 shows the surface appearances of the SLMed ZK30-0.2Cu-xMn specimens after immersion in the SBF solution for 48 h. Figure 7A shows that numerous loose corrosion products covered the entire surface of the SLMed ZK30-0.2Cu specimen. The Mn-containing alloys did not have these loose corrosion products, but contained some discontinuous white products distributed as a continuous mud-cracked film, as shown in Figure 7B-E. The corrosion products on SLMed ZK30-0.2Cu-0.4Mn and SLMed ZK30-0.2Cu-0.8Mn were intact and compact, and there were no loose corrosion products (Figure 7B and C), which implied that the corrosion of SLMed ZK30-0.2Cu-0.4Mn and SLMed ZK30-0.2Cu-0.8Mn was relatively slight, compared to SLMed ZK30-0.2Cu. The surface of the alloy containing a Mn content of 1.2 wt.% contained microcracks (Figure 7D). With the Mn content further increased to 1.6 wt%, the microcracks became larger and deeper (Figure 7E). The compositions of corrosion layers on the corroded surfaces were analyzed using EDS. The EDS spectra in Point 1 and Point 2 in Figure 7C confirmed that the regular corrosion layers and the discontinuous white products on the corroded surface of SLMed ZK30-0.2Cu-0.8Cu specimens contained “O, Mg, Ca, and P” and “O and Mg,” respectively. The Ca and P elements were present on the corroded surface, indicating that Ca-P compounds precipitated on the surface of the hydroxide corrosion layers as the corrosion continued[31]. The EDS spectra of Point 3 in Figure 7A confirmed that the corrosion products on the corroded surface of SLMed ZK30-0.2Cu contained “O and Mg,” similar to the EDS spectra of Point 2.
Figure 7.
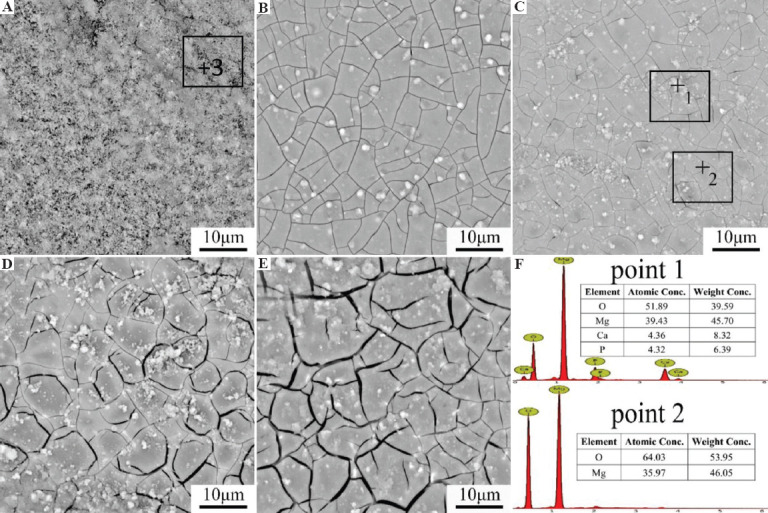
Scanning electron microscopy appearance of corroded surfaces of SLMed ZK30-0.2Cu-xMn (A) x = 0, (B) x = 0.4, (C) x = 0.8, (D) x = 1.2, (E) x = 1.6 and (F) energy-dispersive spectroscopy spectra of points 1~2.
3.4. Antibacterial activity against S. aureus
Figure 8 shows the colonies of S. aureus cultured on the blank control, on pure Mg and on SLMed ZK30-0.2Cu-0.8Mn for 24 h and 72 h. There were a large number of colonies on the blank control. There were fewer colonies on the pure Mg. There were very few colonies on the SLMed ZK30-0.2Cu-0.8Mn after 24 h and almost no colonies after 72 h.
Figure 8.
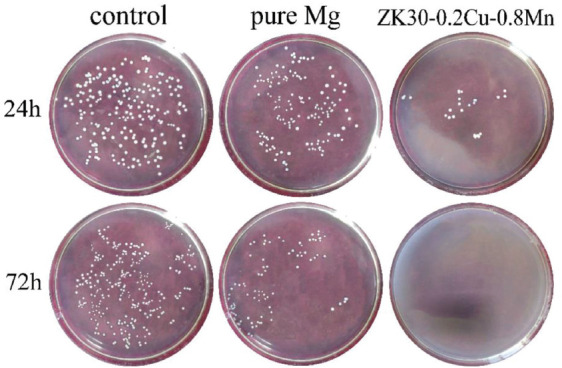
The growth of bacteria colonies on agar plates cocultured with Staphylococcus aureus at 37°C for 24 h and 72 h.
Figure 9A shows the number of S. aureus CFU/ml in extracts of the blank control, the pure Mg, and the SLMed ZK30-0.2Cu-0.8Mn at different time intervals without adjusting pH. The number of the colonies of S. aureus in the control group did not change significantly with increasing time, while the number of colonies on pure Mg and SLMed ZK30-0.2Cu-0.8Mn decreased gradually. Particularly, the colonies on SLMed ZK30-0.2Cu-0.8Mn decreased to zero after 72 h. The colonies in the neutral environments (at pH 7.4) are shown in Figure 9B. The colonies of the control and pure Mg did not change significantly with increasing time, while that on SLMed ZK30-0.2Cu-0.8Mn declined gradually, dropping sharply after 72 h and to zero after 96 h. This demonstrated the good antibacterial efficacy of SLMed ZK30-0.2Cu-0.8Mn.
Figure 9.
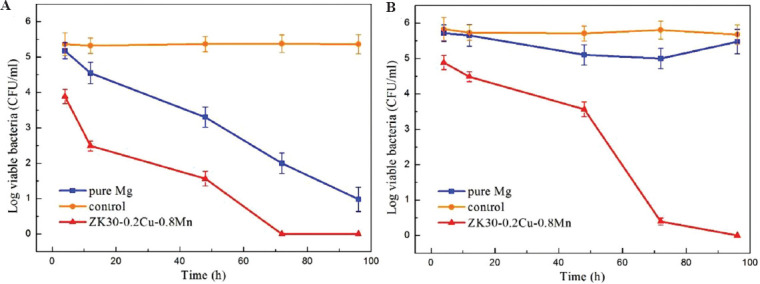
Number of colony-forming units/mL of Staphylococcus aureus after incubation with different samples at (A) uncontrolled pH values and (B) neutral pH of 7.4.
3.5. Cytocompatibility
Figure 10 shows the results of CCK-8 assay of MG63 cells, which were cultured on the samples for 1, 4, and 7 days. The number of live cells was proportional to the absorbance (or optical density). This indicates that the number of live cells on all the samples gradually increases with the increase of culture time, suggesting that they are all cytocompatible. From the 1st day to the 7th day, the relative proliferation rate of the MG63 cells in the six extract groups showed a similar growth trend. There was no apparent difference in the cell proliferation number between SLMed ZK30-0.2Cu-xMn and Ti extracts at different time points. This indicates that SLMed ZK30-0.2Cu-xMn is suitable for cell growth without cytotoxicity as well as Ti extract.
Figure 10.
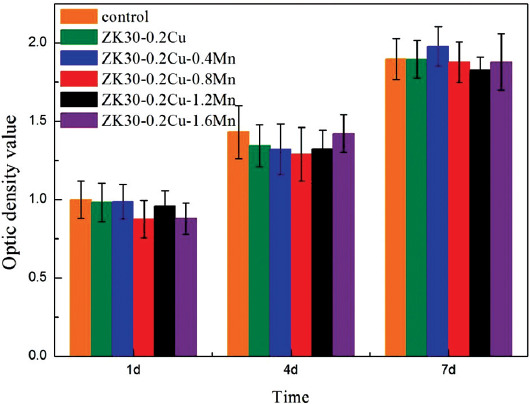
Optical density values for MG63 cells incubated in Ti and SLMed ZK30-0.2Cu-xMn extracts for 1, 4, and 7 days.
Figure 11 shows the fluorescence live/dead staining results of MG63 cells, which were cultured after 1 and 3 days. Live cells were indicated by green fluorescence staining with calcein-AM, while dead cells by red staining with EthD-1. There was no evident indication of dead cells. The cells cultured on all the SLMed alloys had a well spread morphology, exhibiting no apparent difference among them and MG63 cells cultured in the extract had a morphology with spindle and round shapes which was in accordance with the morphology of normal cells. The cells showed good growth patterns and the number of cells increased obviously as incubation time increased.
Figure 11.

The live (green)-dead (red) staining of the MG63 cells cultured for 1 day and 3 days in the presence of (A) and (F) SLMed ZK30-0.2Cu; (B) and (G) SLMed ZK30-0.2Cu-0.4Mn; (C) and (H) SLMed ZK30-0.2Cu-0.8Mn; (D) and (I) SLMed ZK30-0.3Cu-1.2Mn; (E) and (J) SLMed ZK30-0.3Cu-1.6Mn.
The results of the cell proliferation assays and the fluorescence staining imaging indicated that SLMed ZK30-0.2Cu-xMn has suitable cytocompatibility as expected, because all elements in the SLMed alloys are cytocompatible.
4. Discussion
This current study successfully used SLM to fabricate ZK30-0.2Cu-xMn with various Mn concentrations (0.4, 0.8, 1.2, and 1.6 wt%), which exhibited strong antibacterial ability and good cytocompatibility. Mg-based alloys are attractive candidates for metallic implant biodegradable materials if the rate of the biodegradation can be decreased. The decrease of the biodegradation rate was examined by adding Mn by SLM for antibacterial Cu-containing Mg alloys in this study.
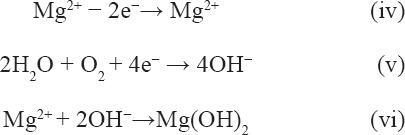
After the SLMed ZK30-0.2Cu-xMn specimens were immersed in the SBF solution, the corrosion reactions given by Equation 4, Equation 5, and Equation 6 in the following occurred and the surface hydroxide layer formed. The hydroxide layer was loose (Figure 7A) and provided little corrosion protection. As corrosion continued, hydroxyapatite formed due to the reaction between hydroxide in the corrosion product, HPO42- (or PO43-) and Ca2+ in the SBF, which resulted in the precipitation of Ca/P hydroxide on the surface of the hydroxide layer according to Equation vii[32]. This was substantiated by the EDS spectra shown in Figure 7F, which indicated that the corrosion products are mainly composed of O, Mg, Ca, and P.

The results from the polarization curves (Figure 5), hydrogen evolution (Figure 6A), and weight loss (Figure 6B) showed that alloying with Mn had a significant effect on the biodegradation of SLMed ZK30-0.2Cu-xMn. With increasing Mn concentration, the biodegradation rate first decreased and reached a minimum value at a Mn content of 0.8 wt%. These results were consistent with the literature[33,34], which reported that small additions of Mn to Mg alloys decreased the corrosion rate by refining the microstructure. Figure 1 shows that the incorporation of Mn substantially decreased the grain size. The fine-grained microstructure contained more grain boundaries and acted as a physical corrosion barrier to prevent corrosion[35]. In addition, the grain refinement reduced the mismatch stress between the surface layer and the Mg substrate to inhibit pitting initiation[36]. Therefore, grain refinement due to Mn addition can significantly decrease the biodegradation rate of SLMed ZK30-0.2Cu-xMn.
The surface corrosion appearances (Figure 7) showed that the addition of Mn promoted the formation of an intact compact layer of surface corrosion products, thereby providing better corrosion protection. However, Mn was not detected in the corrosion products on the corroded surface of SLMed ZK30-0.2Cu-xMn by the EDS, as shown in Figure 7F. The corrosion products were further examined by XPS. Figure 12 shows the results of XPS analysis of the chemical compositions of Mg, Mn, and O in the corrosion products on SLMed ZK30-0.2Cu-0.8Mn by an analysis of the Mg 1s, Mn 2p, and O 1s peaks. The wide Mg 1s peak was composed of Mg(OH)2 at 523.4 eV and MgO at 530.4 eV. The two constituent peaks of Mn 2p1/2 at 654.2 eV and Mn 2p3/2 at 641.9 eV in the Mn 2p indicated the existence of MnO and MnO2, respectively. The O 1s peak was composed of three constituent peaks of MnOx at 529.4 eV, MgO at 530.4 eV, and Mg(OH)2 at 532.4 eV. Consequently, in addition to Mg(OH)2 and MgO, manganese oxides were certainly present in the corrosion products. Manganese oxides in the corrosion products were detected by XPS but could not be detected by EDS. One of the most likely reasons was that the manganese oxide layer was attached to the substrate and was covered by loose Mg(OH)2 and accordingly the thickness of the corrosion layer exceeded the limit of EDS detection. In addition, there was probably only Mn oxide layer. When Mg alloys were immersed in SBF, the biodegradation of Mg was severe due to easy penetration of the oxide/hydroxide products by destructive Cl- ions and the formation of a chloride salt (MgCl2), that is, the destructive Cl− ions existing in the SBF transformed Mg(OH)2 into the more soluble MgCl2 as given by Equation 8.
Figure 12.
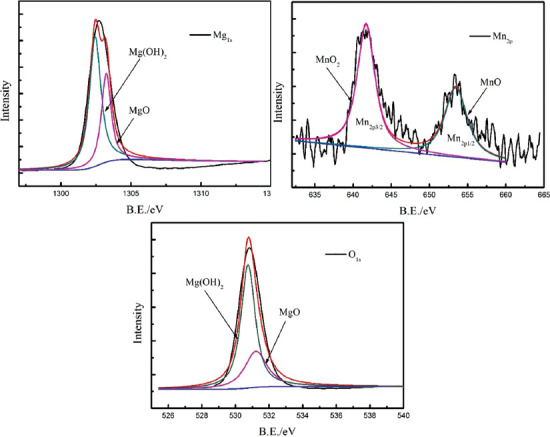
X-ray photoelectron spectroscopy analysis of corrosion products on SLMed ZK30-0.2Cu-0.8Mn.

Nam et al. demonstrated that in 0.6 M NaCl solution, Mn alloying into a Mg-5Al-based alloy inhibited the penetration of Cl- ions[37]. Metalnikov et al. further proposed that in 3.5 wt% NaCl solution saturated with Mg(OH)2, Mn alloying into a Mg-5Al-based alloy could cause the formation of a relatively protective oxide film[38]. Therefore, in the present work, the formation of a manganese oxide layer on SLMed ZK30-0.2Cu-xMn was also expected to significantly decrease the biodegradation rate in SBF containing Cl− ions. This was supported by the results of the surface corrosion morphologies (Figure 7) and biodegradation rate from electrochemical tests and immersion tests (Figure 6), in which the SLMed ZK30-0.2Cu-0.8Mn specimens had an intact compact corroded surface layer and the lowest biodegradation rate.
The SLMed ZK30-0.2Cu-xMn is a multiphase alloy, in which different microconstituents, that is, the Mg matrix and the second phases may cause strong micro galvanic corrosion. As shown in Figure 2, the diffraction peaks of the Mn phase could be identified only when the Mn content was >0.8 wt.%. This indicates that the Mn element could completely dissolve in Mg matrix if the Mn content was less than 0.8wt%, due to the rapid solidification by the SLM processing and formed supersaturated solid solutions. In contrast, a Mn content >0.8 wt% resulted in the formation of a small amount of Mn phase, which could not dissolve in the Mg matrix and precipitated after the rapid solidification. The precipitated Mn phase served as a cathode and the Mg matrix as anode formed a galvanic couple, which increased the biodegradation rate. Consequently, the biodegradation rate first decreased, with Mn content increased and reached a minimum while Mn content was 0.8 wt% and then increased with the Mn content. Furthermore, the precipitated Mn phase formed a weak interface with the adjacent Mg where the cracks were easily initiated. Figure 7D and 7E shows some microcracks on the corroded surfaces of SLMed ZK30-0.2Cu-1.2Mn and SLMed ZK30-0.2Cu-1.6Mn, which were generated due to the dehydration of the corrosion product layer by drying[39]. The existence of microcracks caused the matrix to contact the SBF directly and accelerated the corrosion. The microcracks of the corroded surfaces became larger and deeper when Mn content increased from 1.2 wt% to 1.6 wt%, accompanied by an increased biodegradation rate. Even so, for SLMed ZK30-0.2Cu-1.6Mn, some local areas presented microcracks, while some other areas were still covered by an integrated compact surface corrosion layer (Figure 7E), which was formed due to the Mn content as described above. As a consequence, for SLMed ZK30-0.2Cu-xMn, the influence of grain refinement and the relatively protective manganese oxide layer on the increase of the biodegradation resistance counteracted the influence of the undissolved Mn phase on the decrease of biodegradation resistance; therefore, SLMed ZK30-0.2Cu-0.8Mn has the lowest biodegradation rate.
5. Conclusion
Novel antibacterial ZK30-0.2Cu-xMn alloys with fine equiaxed grains were successfully fabricated by SLM. Alloying with Mn has an evident influence on grain size, hardness, and biodegradation rate of SLMed ZK30-0.2Cu-xMn alloys. Alloying with Mn decreases the grain size and produces a relatively protective manganese oxide film, which significantly decreases the biodegradation rate of SLMed ZK30-0.2Cu-xMn alloys. Undissolved Mn increases the biodegradation rate of SLMed ZK30-0.2Cu-xMn. The optimum Mn content is 0.8 wt.%. SLMed ZK30-0.2Cu-0.8Mn has the lowest biodegradation rate. SLMed ZK30-0.2Cu-0.8Mn exhibits strong antibacterial ability and good cytocompatibility, indicating their future prospects for bone implants.
Conflict of interest
There are no conflicts of interest to declare.
References
- 1.Johnston S, Shi Z, Venezuela J, et al. Investigating Mg Bio-corrosion In Vitro:Lessons Learned and Recommendations. JOM. 2019;71(4):1406–13. https://doi.org/10.1007/s11837-019-03327-9. [Google Scholar]
- 2.Zheng Z, Zhao MC, Tan L, et al. Corrosion Behavior of a Self-Sealing Coating Containing CeO2 Particles on Pure Mg Produced by Micro-Arc Oxidation. Surf Coat Technol. 2020;386:125456. https://doi.org/10.1016/j.surfcoat.2020.125456. [Google Scholar]
- 3.Lopes DR, Silva CL, Soares RB, et al. Cytotoxicity and Corrosion Behavior of Magnesium and Magnesium Alloys in Hank's Solution after Processing by High-Pressure Torsion. Adv Eng Mater. 2019;21(8):1900391. https://doi.org/10.1002/adem.201900391. [Google Scholar]
- 4.Rua JM, Zuleta AA, Ramirez J, et al. Micro-Arc Oxidation Coating on Porous Magnesium foam and its Potential Biomedical Applications. Surf Coat Technol. 2019;360:213–21. https://doi.org/10.1016/j.surfcoat.2018.12.106. [Google Scholar]
- 5.Yan X, Zhao M, Yang Y, et al. Improvement of Biodegradable and Antibacterial Properties by Solution Treatment and Micro-Arc Oxidation (MAO) of a Magnesium Alloy with a Trace of Copper. Corros Sci. 2019;156:125–38. https://doi.org/10.1016/j.corsci.2019.05.015. [Google Scholar]
- 6.Liu C, Fu X, Pan H, et al. Biodegradable Mg-Cu Alloys with Enhanced Osteogenesis, Angiogenesis, and Long-Lasting Antibacterial Effects. Sci Rep. 2016;6:27374. doi: 10.1038/srep27374. https://doi.org/10.1038/srep27374. [DOI] [PMC free article] [PubMed] [Google Scholar]
- 7.Yan X, Wan P, Tan L, et al. Influence of Hybrid Extrusion and Solution Treatment on the Microstructure and Degradation Behavior of Mg-0.1Cu Alloy. Mater Sci Eng B. 2018;229:105–17. [Google Scholar]
- 8.Gu X, Zheng Y, Cheng Y, et al. In Vitro Corrosion and Biocompatibility of Binary Magnesium Alloys. Biomaterials. 2009;30:484–98. doi: 10.1016/j.biomaterials.2008.10.021. https://doi.org/10.1016/j.biomaterials.2008.10.021. [DOI] [PubMed] [Google Scholar]
- 9.Ha HY, Kim HJ, Baek SM, et al. Improved Corrosion Resistance of Extruded Mg-8Sn-1Zn-1Al Alloy by Microalloying with Mn. Scr Mater. 2015;109:38–43. https://doi.org/10.1016/j.scriptamat.2015.07.013. [Google Scholar]
- 10.Yang Y, Wu P, Wang Q, et al. The Enhancement of Mg Corrosion Resistance by Alloying Mn and Laser-Melting. Materials. 2016;9:216. doi: 10.3390/ma9040216. https://doi.org/10.3390/ma9040216. [DOI] [PMC free article] [PubMed] [Google Scholar]
- 11.Leach RM, Muenster AM, Wien EM. Studies on the Role of Manganese in Bone Formation:II. Effect upon Chondroitin Sulfate Synthesis in Chick Epiphyseal Cartilage. Arch Biochem Biophys. 1969;133(1):22–8. doi: 10.1016/0003-9861(69)90483-4. [DOI] [PubMed] [Google Scholar]
- 12.Liu Y, Koltick D, Byrne P, et al. Development of a Transportable Neutron Activation Analysis System to Quantify Manganese in Bone In Vivo:Feasibility and Methodology. Physiol Meas. 2013;34(12):1593. doi: 10.1088/0967-3334/34/12/1593. https://doi.org/10.1088/0967-3334/34/12/1593. [DOI] [PMC free article] [PubMed] [Google Scholar]
- 13.Li WX. Magnesium and its Alloys. Central South University Press, Changsha 2005 [Google Scholar]
- 14.Yu WH, Sing SL, Chua CK, et al. Particle-Reinforced Metal Matrix Nanocomposites Fabricated by Selective Laser Melting:A State of the Art Review. Prog Mater Sci. 2019;104:330–79. https://doi.org/10.1016/j.pmatsci.2019.04.006. [Google Scholar]
- 15.Li X, Tan Y, Willy H, et al. Heterogeneously Tempered Martensitic High Strength Steel by Selective Laser Melting and its Micro-Lattice:Processing, Microstructure, Superior Performance and Mechanisms. Mater Des. 2019;178:107881. https://doi.org/10.1016/j.matdes.2019.107881. [Google Scholar]
- 16.Zhao Y, Tang Y, Zhao M, et al. Graphene Oxide Reinforced Iron Matrix Composite with Enhanced Biodegradation Rate Prepared by Selective Laser Melting. Adv Eng Mater. 2019;21(8):1900314. https://doi.org/10.1002/adem.201900314. [Google Scholar]
- 17.Gao C, Yao M, Li S, et al. Highly Biodegradable and Bioactive Fe-Pd-Bredigite Biocomposites Prepared by Selective Laser Melting. J Adv Res. 2019;20:91–104. doi: 10.1016/j.jare.2019.06.001. https://doi.org/10.1016/j.jare.2019.06.001. [DOI] [PMC free article] [PubMed] [Google Scholar]
- 18.Sing SL, Huang S, Yeong WY. Effect of Solution Heat Treatment on Microstructure and Mechanical Properties of Laser Powder Bed Fusion Produced Cobalt-28Chromium-6Molybdenum. Mater Sci Eng A. 2020;769:138511. https://doi.org/10.1016/j.msea.2019.138511. [Google Scholar]
- 19.Tan JH, Sing SL, Yeong WY. Microstructure Modelling for Metallic Additive Manufacturing:A Review. Virtual Phys Prototyp. 2020;15(1):87–105. https://doi.org/10.1080/17452759.2019.1677345. [Google Scholar]
- 20.Li X, Tan Y, Wang P, et al. Metallic Microlattice and Epoxy Interpenetrating Phase Composites:Experimental and Simulation Studies on Superior Mechanical Properties and their Mechanisms. Compos Part A Appl Sci Manuf. 2020;135:105934. https://doi.org/10.1016/j.compositesa.2020.105934. [Google Scholar]
- 21.Nie XJ, Chen Z, Qi Y, et al. Effect of Defocusing Distance on Laser Powder Bed Fusion of High Strength Al-Cu-Mg-Mn Alloy. Virtual Phys Prototyp. 2020;15(3):325–39. https://doi.org/10.1080/17452759.2020.1760895. [Google Scholar]
- 22.Huang S, Sing SL, Looze G, et al. Laser Powder Bed Fusion of Titanium-Tantalum Alloys:Compositions and Designs for Biomedical Applications. J Mech Behav Biomed Mater. 2020;108:103775. doi: 10.1016/j.jmbbm.2020.103775. https://doi.org/10.1016/j.jmbbm.2020.103775. [DOI] [PubMed] [Google Scholar]
- 23.Xu R, Zhao M, Zhao Y, et al. Improved Biodegradation Resistance by Grain Refinement of Novel Antibacterial ZK30-Cu Alloys Produced Via Selective Laser Melting. Mater Lett. 2019;237:253–7. https://doi.org/10.1016/j.matlet.2018.11.071. [Google Scholar]
- 24.Zhao YC, Tang Y, Zhao MC, et al. Study on Fe-xGO Composites Prepared by Selective Laser Melting:Microstructure, Hardness, Biodegradation and Cytocompatibility. JOM. 2020;72:1163–74. https://doi.org/10.1007/s11837-019-03814-z. [Google Scholar]
- 25.Zhao Y, Zhao M, Xu R, et al. Formation and Characteristic Corrosion Behavior of Alternately Lamellar Arranged a and b in As-Cast AZ91 Mg Alloy. J Alloys Compd. 2019;770:549–58. https://doi.org/10.1016/j.jallcom.2018.08.103. [Google Scholar]
- 26.Zhao MC, Liu M, Song GL, et al. Influence of the b-Phase Morphology on the Corrosion of the Mg Alloy AZ91. Corros Sci. 2008;50:1939–53. [Google Scholar]
- 27.Li Z, Chen M, Li W, et al. The Synergistic Effect of Trace Sr and Zr on the Microstructure and Properties of a Biodegradable Mg-Zn-Zr-Sr Alloy. J Alloys Compd. 2017;702:290–302. https://doi.org/10.1016/j.jallcom.2017.01.178. [Google Scholar]
- 28.Zhang X, Hua L, Liu Y. FE simulation and Experimental Investigation of ZK60 Magnesium Alloy with Different Radial Diameters Processed by Equal Channel Angular Pressing. Mater Sci Eng A. 2012;535:153–63. https://doi.org/10.1016/j.msea.2011.12.057. [Google Scholar]
- 29.Zhao MC, Schmutz P, Brunner S, et al. An Exploratory Study of the Corrosion of Mg Alloys During Interrupted Salt Spray Testing. Corros Sci. 2009;51(6):1277–92. https://doi.org/10.1016/j.corsci.2009.03.014. [Google Scholar]
- 30.Tao JX, Zhao M, Zhao Y, et al. Influence of Graphene Oxide (GO) on Microstructure and Biodegradation of ZK30-xGO Composites Prepared by Selective Laser Melting. J Magnes Alloys. 2020;8(3):952–62. https://doi.org/10.1016/j.jma.2019.10.004. [Google Scholar]
- 31.Zhao MC, Zhao YC, Yin DF, et al. Biodegradation Behavior of Coated As-Extruded Mg-Sr Alloy in Simulated Body Fluid. Acta Metall Sin (Engl Lett) 2019;32:1195–206. https://doi.org/10.1007/s40195-019-00892-5. [Google Scholar]
- 32.Atrens AD, Gentle I, Atrens A. Possible Dissolution Pathways Participating in the Mg Corrosion Reaction. Corros Sci. 2015;92:173–81. https://doi.org/10.1016/j.corsci.2014.12.004. [Google Scholar]
- 33.Song GL, Atrens A. Corrosion Mechanisms of Magnesium Alloys. Adv Eng Mater. 1999;1:11–33. https://doi.org/10.1002/(sici)1527-2648(199909)1:1<11::aid-adem11>3.0.co;2-n. [Google Scholar]
- 34.Esmaily M, Svensson JE, Fajardo S, et al. Fundamentals and Advances in Magnesium Alloy Corrosion. Prog Mater Sci. 2017;89:92–193. https://doi.org/10.1016/j.pmatsci.2017.04.011. [Google Scholar]
- 35.Zhang W, Tan LL, Li DR, et al. Effect of Grain Refinement and Crystallographic Texture Produced by Friction Stir Processing on the Biodegradation Behavior of a Mg-Nd-Zn Alloy. J Mater Sci Technol. 2019;35(5):777–83. https://doi.org/10.1016/j.jmst.2018.11.025. [Google Scholar]
- 36.Kirkland NT, Waterman J, Birbilis N, et al. Buffer-Regulated Bio-corrosion of Pure Magnesium. J Mater Sci Mater Med. 2012;23(2):283–91. doi: 10.1007/s10856-011-4517-y. [DOI] [PubMed] [Google Scholar]
- 37.Nama ND, Mathesh M, Forsyth M, et al. Effect of Manganese Additions on the Corrosion Behavior of an Extruded Mg-5Al Based Alloy. J Alloys Compd. 2012;542:199–206. https://doi.org/10.1016/j.jallcom.2012.07.083. [Google Scholar]
- 38.Metalnikov P, Ben-Hamua G, Templeman Y, et al. The Relation between Mn Additions, Microstructure and Corrosion Behavior of New Wrought Mg-5Al Alloys. Mater Charact. 2018;145:101–15. https://doi.org/10.1016/j.matchar.2018.08.033. [Google Scholar]
- 39.Baril G, Pebere N. The Corrosion of Pure Magnesium in Aerated and Deaerated Sodium Sulphate Solutions. Corros Sci. 2001;43(3):471–84. https://doi.org/10.1016/s0010-938x(00)00095-0. [Google Scholar]


