

Abstract
Purpose:
Glucose and its analogs can be detected by chemical exchange saturation transfer (CEST) and spin-lock (CESL) MRI techniques, but sensitivity is still a bottleneck for human applications. Here CESL and CEST sensitivity and the effect of injection on baseline physiology were evaluated for a glucose analog, xylose.
Methods:
CEST and CESL sensitivity were evaluated at 9.4 T in phantoms and by in vivo rat experiments with 0.5 and 1 g/kg xylose injections. Arterial blood glucose level was sampled before and after 1 g/kg xylose injection. The effect of injection on baseline neuronal activity was measured by electrophysiology data during injections of saline, xylose, and 2-deoxy-D-glucose (2DG).
Results:
In phantoms, xylose shows similar chemical exchange sensitivity and pH-dependence with that of glucose. In rat experiments with a bolus injection, CESL shows higher sensitivity in the detection of xylose than CEST, and the sensitivity of xylose is much higher than glucose. Injection of xylose does not significantly affect blood glucose level and baseline neural activity for 1 g/kg and 0.6 g/kg doses, respectively.
Conclusion:
Due to its relatively high sensitivity and safety, xylose is a promising contrast agent for the study of glucose uptake.
Keywords: CEST, CESL, xylose, glucose uptake, neuronal activity
Introduction
Glucose, the body’s primary fuel, is a key biomarker of cellular function, and thus assessment of disease-altered glucose uptake holds great promise for diagnosis and prognosis in many fields of medicine1. The MR imaging of glucose uptake can be achieved with CEST2–4, where off-resonance irradiation is applied to selectively saturate glucose hydroxyl protons; the ensuing fast chemical exchange between these protons and bulk water effectively attenuates water signal5, providing a sensitivity enhancement of 2 orders of magnitude over measuring glucose directly with MRS2. Although glucose is a natural contrast agent for chemical exchange sensitive MRI and can readily be applied to human studies, it is quickly metabolized by the body and is difficult to maintain concentrations in tissue high enough for detection. Thus, sensitivity is still a bottleneck, especially for the clinical field strengths. Besides CEST, glucose can be detected with CESL where the chemical exchange process is sensitized by an irradiation applied at the water resonance frequency6,7. Both techniques have been applied in animals as well as in pilot human studies8,9, and recent studies have suggested that CESL offers higher sensitivity than CEST6,7. An on-resonance Variable Delay Multiple Pulse approach has been used where an irradiation pulse is also applied at the water frequency, similar to on-resonance CESL, and has also demonstrated higher sensitivity than CEST in a pilot animal study10.
Besides the improvement in acquisition approaches, another way of enhancing the sensitivity of glucose uptake MRI is to choose a glucose analog which can stay in the vasculature/tissue for a longer time. Previous CESL and CEST studies have shown that 2-Deoxy-glucose (2DG) has a much higher sensitivity than Glc because its phosphorylated form3,11, 2DG-6-phosphate, can remain in the intracellular space for up to several hours, but it is well-known that 2DG has strong toxicity and can only be applied to a limited patient population with low doses. 3-O-Methyl-D-Glucose (3OMG) is a non-metabolizable glucose analog and has been used as a specific tracer for studying glucose transport12,13. It is generally assumed to be non-toxic and there have been no behavioral effects for rats with injections of 4 g/kg of 3OMG14, but its safety has yet to be thoroughly evaluated and has not been approved for routine human use12.
Xylose, also named “wood sugar”, is a pentose sugar widely distributed in plants and has been used as a diabetic sweetener in food and beverage. Although it has a few possible metabolism pathways, it is poorly utilized by monogastric animals15. In fact, the slow metabolism of xylose in mammalian tissue forms the basis of the xylose absorption test for the intestinal disease in humans16–18. Because xylose can be transported across the BBB and there is minimal metabolism in the brain19, it may be a good candidate for the study of brain glucose uptake. Compared to 3OMG, which is a synthetic sugar, the distinct advantage of xylose is that it has already been approved by the FDA for human use, and the cost is much lower. In this work, we measured the sensitivity and time characteristics of xylose uptake in the rat brain using CESL and CEST MRI. In order to evaluate whether a pharmacological dose of xylose injection will affect normal physiology, we also examined the effect of xylose injection on blood glucose level and brain neuronal activity.
Methods
Animal Preparation
Male Sprague-Dawley rats were studied with approval by the Institutional Animal Care and Use Committee at the University of Pittsburgh. The animals were anesthetized with isoflurane (5% for induction and 2% during surgery) in a mixture of O2 and air gases with O2 concentration kept at about 30% throughout the experiment. The right femoral vein or the tail vein was catheterized for the delivery of maintenance fluid and the injection of xylose, and the femoral artery was catheterized to monitor arterial blood pressure in terminal experiments. End-tidal isoflurane level was reduced to 1.2–1.5 % during MRI scans. End-tidal CO2 was monitored and kept within 3.0 ‒ 4.0% and the rectal temperature was maintained at 37.5 ± 1.0°C using a feedback-controlled heating pad.
MRI experiments:
All experiments were performed on a 9.4 T Bruker system. For phantom experiments, a 4-cm ID volume coil was used for both excitation and reception. For in vivo studies, an 86-mm volume coil was used for excitation and a surface array coil was used for reception. In order to reach stable animal conditions, CEST or CESL experiments were performed with a waiting period of at least 0.5 hours for animal conditions (e.g., body temperature and anesthesia) to stabilize inside the magnet.
Phantom experiments:
Xylose was dissolved in phosphate-buffered saline (PBS) for phantom preparation and phantoms were measured at 37°C. (i) To study concentration dependence, 10, 20, 30 and 50 mM of xylose were titrated to pH = 7.0 and 0.15 mM of MnCl2 was added to reduce the water T1 and T2 to approximate in vivo values. (ii) To study pH-dependence, 100 mM of xylose was titrated to pH = 6.2, 6.6, 7.0, and 7.4.
CESL signals are quantified by R1ρ, the spin-lattice relaxation rate in the rotating frame. For all phantoms, R1ρ values were measured for eleven γB1 values between 125 and 4000 Hz20. CEST signal was measured by a Z-spectrum with continuous wave saturation from an RF offset range of −6 to 6 ppm; the saturation power was 1.6 μT and the duration was 7 s. For both CESL and CEST, the images were acquired immediately after the irradiation pulse by single-shot spin-echo echo planar imaging (EPI) with a 64 × 64 matrix size, 4 × 4 cm2 field of view (FOV), 5-mm slice thickness, echo time (TE) = 25 ms, and repetition time (TR) = 14 s.
In vivo experiments:
To reduce the effect of B0 drift during the long scan, both CESL and CEST experiments were separated into multiple runs of 10-min each, and the carrier frequency was adjusted before each run. In in vivo xylose-CESL experiments, images with different R1ρ-weighting (i.e., different TSL values) were acquired before and after the intravenous bolus injection of xylose in 30% weight/volume solution. Specifically, spin-lock MRI images were acquired during a 30 min pre-injection and 60 min post-injection period, where 0.5 g/kg (n = 5) and 1 g/kg of xylose (n = 5) was administered to determine the sensitivity and temporal characteristics of xylose-CESL. In addition, a high-resolution study (n = 4) was also performed with a 1 g/kg xylose dose. A spin-lock module with a 50-ms spin-lock irradiation was used. Immediately after spin-lock preparation, MR images were acquired by EPI6. Images with (i) TSL = 0 (without averages) and (ii) TSL = 50 ms and γB1 = 500 Hz (3 averages) were acquired in an interleaved manner as in our previous studies6,14,21, with FOV = 32 mm × 32 mm, 2 slices with 2 mm thickness, and repetition time (TR) = 3 s. The matrix size is 64 × 64 for low-resolution experiments, and 96 × 96 for high-resolution experiments.
Xylose-CEST experiments were performed with a 1 g/kg dose (n = 7) including a 20-min pre-injection and 40-min post-injection period. Three images were interleaved with an irradiation pulse applied at a hydroxyl frequency of Ω = 1.2 ppm, a reference frequency of −1.2 ppm and a control frequency of 300 ppm. Continuous wave saturation used a power of 1.6 μT as reported by other groups2, a duration of 3 s, and a TR of 3 s.
In vivo data analysis
Data were analyzed with in-house Matlab® programs and STIMULATE software22. For CESL, a time series of images with the same spin-lock duration was first extracted from each run, and time series of R1ρ maps were calculated by ln (STSL=0 / STSL=50 ms) / 50 ms where STSL=0 and STSL=50 ms is the signal intensity of TSL = 0 and 50 ms, respectively. For CEST, images with the same RF offset were extracted from each run, and a time series of MTRasym map was calculated according to the following:
The changes of Ssat(−1.2 ppm)/Ssat(300 ppm) and Ssat(+1.2 ppm)/Ssat(300 ppm) were also obtained to determine the contribution from each of these frequencies. Time-dependent series of ΔR1ρ and ΔMTRasym(1.2 ppm) maps are presented as averages over 15-minute and 10-min intervals before subtraction from the pre-injection baseline average, respectively.
To obtain statistical maps, the Students’ t-test was performed to compare pre- vs. post-injection images on a pixel-by-pixel basis. The pre-injection baseline images were defined as the data spanning the 20 or 30 minutes before the start of injection while post-injection images were from data starting 15 minutes post-injection until the end of acquisition. The R1ρ percent change or t-value maps were obtained where a threshold of p < 0.05 and a minimum cluster size of 3 pixels were applied. Quantitative analyses were performed in ROIs from the whole brain slices.
Electrical Physiology experiments
Baseline neuronal activity recording
A tungsten microelectrode (TM33A10; World Precision Instruments, Sarasota, FL, USA) was placed at a depth of 0.7 mm below the cortical surface and local field potentials (LFPs, 3 – 90 Hz) were recorded outside of the magnet with an electrophysiological data acquisition system (MAP; Plexon, Dallas, TX, USA). After intravenous administration of either saline, xylose or 2DG, LFPs were recorded for 10 min. For xylose and 2DG, recording was started 15 min after their administration.
Baseline neuronal activity assessment
In each rat, power spectra were computed from a 1-s period every minute during a 10-min long recording period for each injection condition (i.e., saline, xylose, 2DG) using a multi-taper method with a time-bandwidth product of 3 and 5 tapers found in the Chronux MATLAB toolbox (http://chronux.org). 60-Hz line noise was removed with the Chronux rmlinesc function. Then, ten spectra from each condition were averaged. The averaged spectra were then divided into delta (1 – 4 Hz), theta (4 – 8 Hz), alpha (8 – 13 Hz), beta (13 – 30 Hz), low-gamma (30 – 50 Hz) and high-gamma bands (50 – 90 Hz) and the sum of the powers was obtained for each band. All of the frequency bands were then compared across different conditions using two-way repeated measures ANOVAs with Fisher LSD post-hoc tests (Origin Pro 9, OriginLab Corporation, Northampton, MA). P‐values of less than 0.05 were considered statistically significant. All data are expressed as mean ± SEM unless otherwise specified.
Results
Fig. 1A shows the chemical structure of Glc and 3 of its analogs. While Glc has 5 hydroxyl groups, 3OMG, 2DG and xylose all have 4 hydroxyl groups. Being a pentose, xylose has the lowest molecular weight being ~23% less than 3OMG. This would indicate that with the same material injection dosage by weight (e.g., 1 g/kg), more xylose molecules or hydroxyl groups will be injected. The chemical exchange effect of xylose can be measured by the concentration and pH-dependences of the R1ρ dispersion, i.e., the change of R1ρ as a function of γB1, the spin-lock frequency. R1ρ decreases as a Lorentzian function with increasing γB120,23, and the chemical exchange effect, as indicated by the difference between R1ρ measured at low and high γB1 values, is linearly dependent on concentration (Fig. 1B). A linear fit of R1ρ with a spin-lock frequency of 500 Hz yields an exchange-mediated relaxivity of 0.059 s−1 per mM of xylose. Fig. 1C shows the R1ρ dispersion of xylose at different pH values. Theoretically, the peak of R1ρ measured by a small spin-lock frequency occurs at the intermediate exchange regime when the chemical shift of the hydroxyl proton equals the exchange rate (i.e., δ = k)20, indicating that the exchange rate of the phantom with pH = 7.0 is closest to the averaged chemical shift δ of ~1.5 ppm (i.e., 3800 rad·s−1). Note that R1ρ values have contributions from both chemical exchange and non-exchange mediated relaxation effects. While MnCl2 in the phantoms in Fig. 1B contributed to a large baseline value of ~12 s−1 which is much larger than the baseline value for PBS only (<0.5 s−1), the R1ρ dispersion (e.g., the difference between R1ρ values at 125 Hz and 4000 Hz) is linearly dependent on xylose concentration.
Fig. 1. CESL R1ρ dispersion data of xylose phantoms.
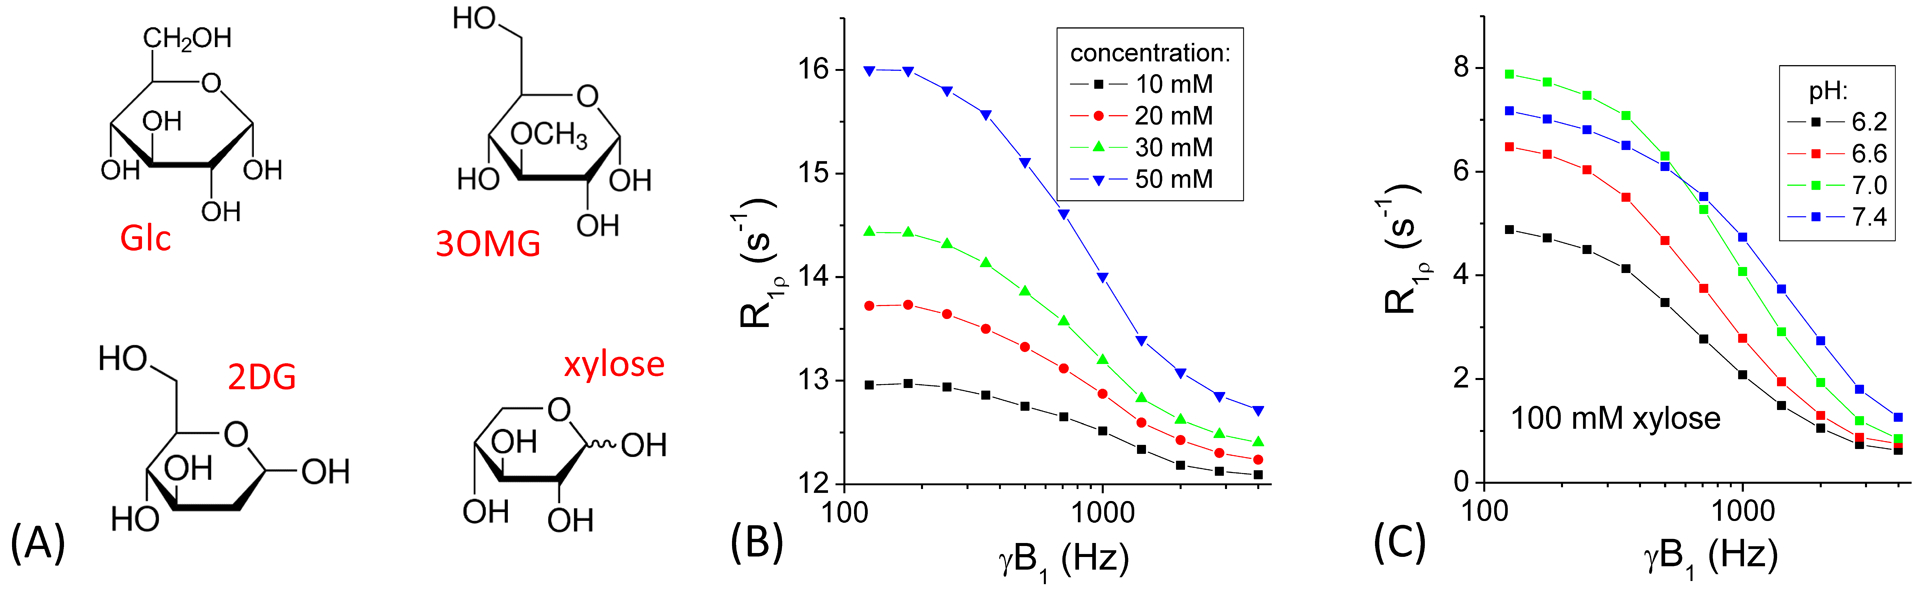
(A) Chemical structure of glucose, 3-O-methyl-glucose, 2-deoxy-glucose, and xylose. (B) R1ρ increases linearly with xylose concentration and decreases with spin-lock power. (C) pH-dependence data shows the highest R1ρ values at lower spin-lock powers for pH = 7, indicating that the exchange rate of pH = 7 is closest to the intermediate exchange regime.
The CEST signal of xylose can be detected in the Z-spectra as a drop in signal at ~1.2 ppm, which is larger for lower pH (Fig. 2A). The MTRasym spectra show that the highest peak at ~1.2 ppm occurs for pH = 6.2 (Fig. 2B), because CEST signal with a typical low saturation power (e.g., < 3 μT) is more sensitive to slow chemical exchange in contrast with CESL which is more sensitive to intermediate chemical exchange20. Note that the peak shifts toward the water resonance for higher pH values with faster exchange rates. The concentration-dependence of MTRasym spectra show that for phantoms in PBS with MnCl2, the peak appears at ~1.2 ppm and the magnitude almost linearly increases with xylose concentration (Fig. 2C and 2D), i.e., ~0.11% (of S0) per mM of xylose. However, the peak frequency is different from the phantom in PBS only at the same pH (7.0, in Fig. 2B), and the magnitude is also much smaller (~25% for 100 mM). These discrepancies are due to the fact that MTRasym is an index of CEST sensitivity which is related to the coalescence of the hydroxyl and water signals in the intermediate exchange regime20, and is also dependent on other relaxation effects such as T1 and T2.
Fig. 2. CEST MRI data of xylose phantoms.
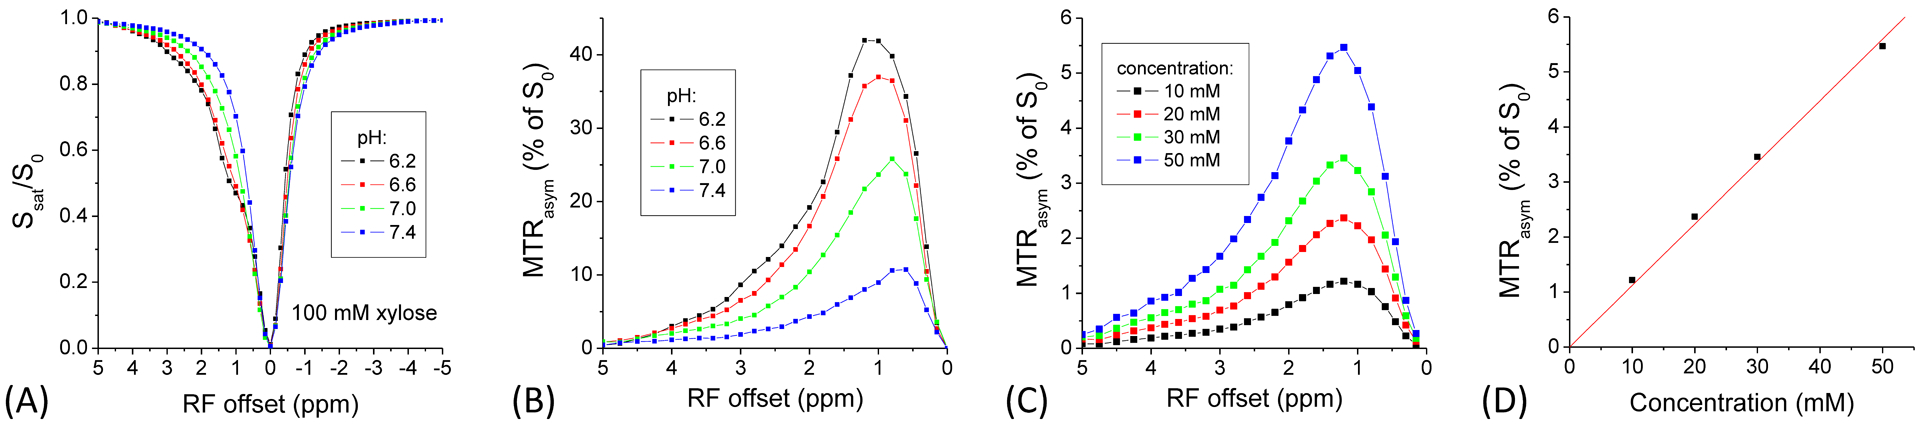
The pH-dependence of (A) the Z-spectra and (B) MTRasym spectra shows, for phantoms in PBS only, the CEST effect is smaller and the peak shifts closer to the water frequency for lower pH values. In phantoms with MnCl2, the MTRasym signal peaks at ~1.2 ppm (C), and the peak magnitude increases almost linearly with xylose concentration (D).
Fig. 3A shows time-dependent maps of ΔR1ρ measured with a 0.5 g/kg dose at low resolution (upper row), 1 g/kg at low resolution (middle row), and 1 g/kg at high resolution (bottom row), where the largest changes appear at 15–30 min. The percent change in R1ρ induced by xylose injection shows a wide-spread increase across most of the brain in all 3 data sets, and the change at the corpus callosum appears smaller than that of the cortex at the higher resolution (Fig. 3B). The t-map confirms that CESL sensitivity is higher for a 1 g/kg dose than the 0.5 g/kg and is lower at the higher resolution (Fig. 3C). The cortical area shows much higher t-values because a surface coil was used for detection, and the averaged cortical t-value for the 1 g/kg dose with low-resolution is 14.3 ± 2.1 (n = 5). Fig. 3D shows the averaged time course of the R1ρ change obtained from the voxels of the whole slice except the CSF region. For both the 0.5 g/kg and the 1 g/kg dose, R1ρ increases and reaches a peak at ~20 minutes post injection and then gradually decreases to about 50–60% of the peak value at ~60 minutes post injection. The magnitude of the R1ρ change for a 0.5 g/kg dose is nearly half of that for 1 g/kg, suggesting a linear dose-dependence.
Fig. 3. CESL R1ρ data from rat brain with xylose administration.
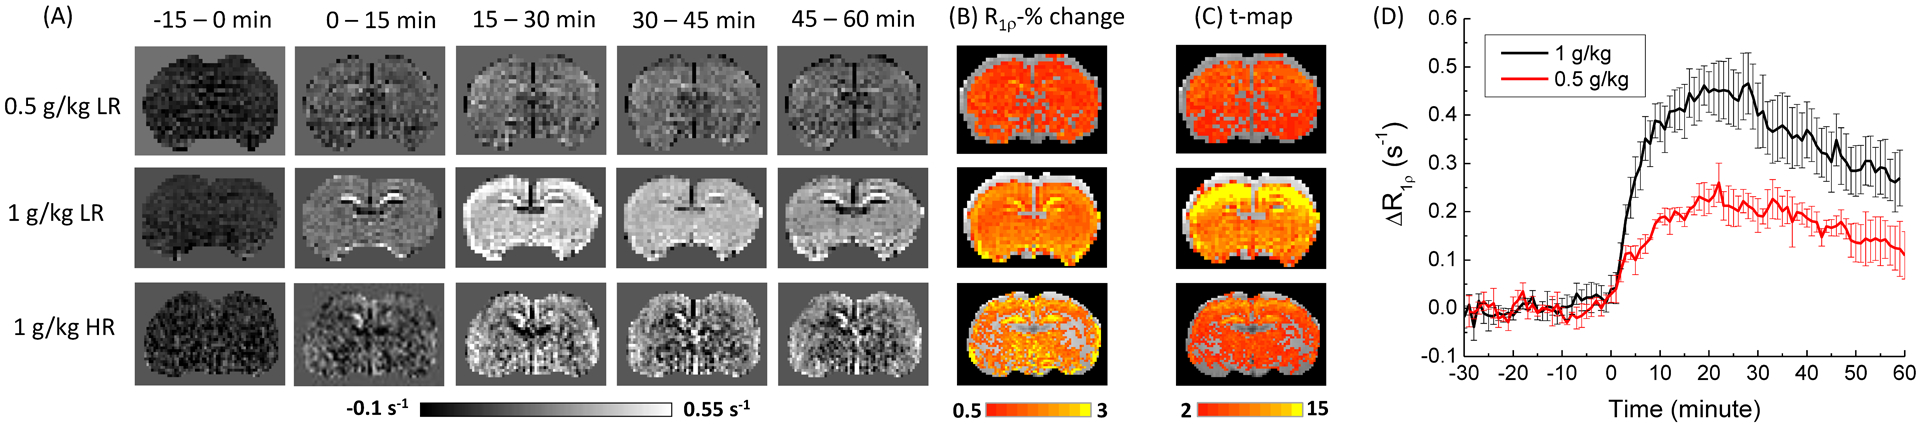
(A) The time-resolved R1ρ change map, (B) the R1ρ percent change map, and (C) the t-map of rat brain. The 0.5 g/kg injection data were measured with low-resolution (LR) and 1 g/kg xylose injection data were measured with both low and high-resolution (HR). In contrast to a relatively homogeneous R1ρ percent change, the t-value is much higher near the cortical surface which is closer in proximity to the surface array coil and thus, the sensitivity is the highest. (D) The time course of R1ρ change from the whole slice ROI show that xylose-CESL signal reaches a peak at ~20 min post injection, and drops to ~60% of the peak at 60 min post injection.
The time-dependent maps of ΔMTRasym from 2 representative rats show the highest change at 10–20 min (Fig. 4A). Compared to ΔR1ρ changes in Fig. 3A, there is much larger spatial heterogeneity, as evidenced by the subcortical voids (red arrows). In the t-map, only part of the brain shows significant change of MTRasym after the 1 g/kg xylose injection i.e., pixels of the cortical and part of the subcortical region which is closer to the surface coil. The average t-value in the cortical region is 3.0 ± 1.2 (n = 7), about 4.8 times smaller than that from the low-resolution CESL data with the same dose. The averaged time course of ΔMTRasym (black) change from the whole slice ROI shows that the glucoCEST signal reach a peak of 0.34% at ~15 minutes post injection, and then gradually decrease, similar to that of the CESL data. The averaged time course of Ssat(1.2 ppm)/Ssat(300 ppm) and Ssat(−1.2 ppm)/Ssat(300 ppm) both showed change induced by the xylose injection, and the averaged change between 15–20 min is 0.51% and 0.22%, respectively.
Fig. 4. CEST MRI data from rat brain with xylose administration.
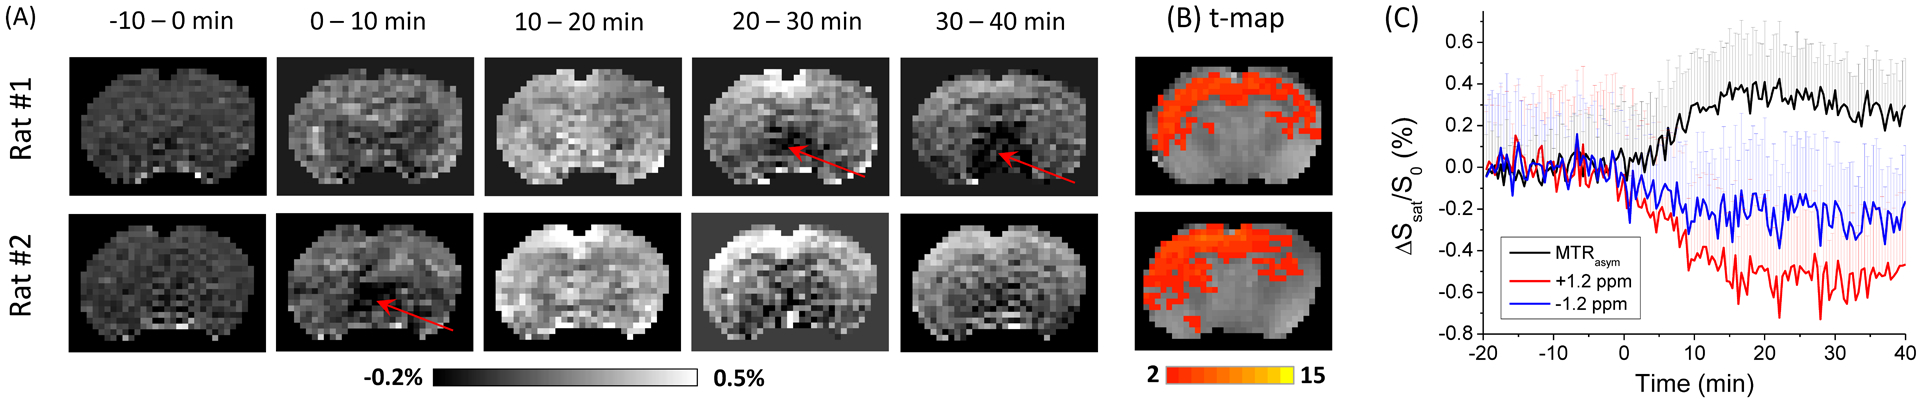
(A) The time-resolved MTRasym change map, and (B) the t-maps of rat brain with 1 g/kg of xylose injection from 2 representative rats. There is clear spatial heterogeneity, especially the void regions indicated by the red arrows. The xylose-CEST contrast detected is relatively weak and mostly in the cortical area. (C) The averaged time courses of MTRasym and the saturated signals from 1.2 ppm and −1.2 ppm from whole slice ROIs show that the CEST signal reaches a peak contrast at ~15 min post injection. For clarity, only half of the error bars were shown.
In order to examine the physiological change induced by the xylose injection, we measured the arterial blood glucose level (Fig. 5). The change of blood glucose level is very small and there is no significant difference from the baseline value for 2-h after 1 g/kg of xylose injection. Fig. 6 show the results of the cortical neuronal activity measurement obtained from six rats. There was a significant difference in mean LFP powers [F(2,10) = 9.8426, p = 0.00433] between the drugs. Post hoc comparisons using the Fisher LSD test were carried out. LFPs after xylose administration did not significantly differed from those after saline, and the averaged power spectra from the two data overlap. In contrast, the averaged LFP spectrum after 2DG administration is lower than those of the saline and xylose injection (Fig. 6A). LFPs significantly (p < 0.01) differed from those after saline injection at beta, low-gamma, and high-gamma band frequencies (Fig. 6B).
Fig. 5. Blood glucose measurement after xylose injection.
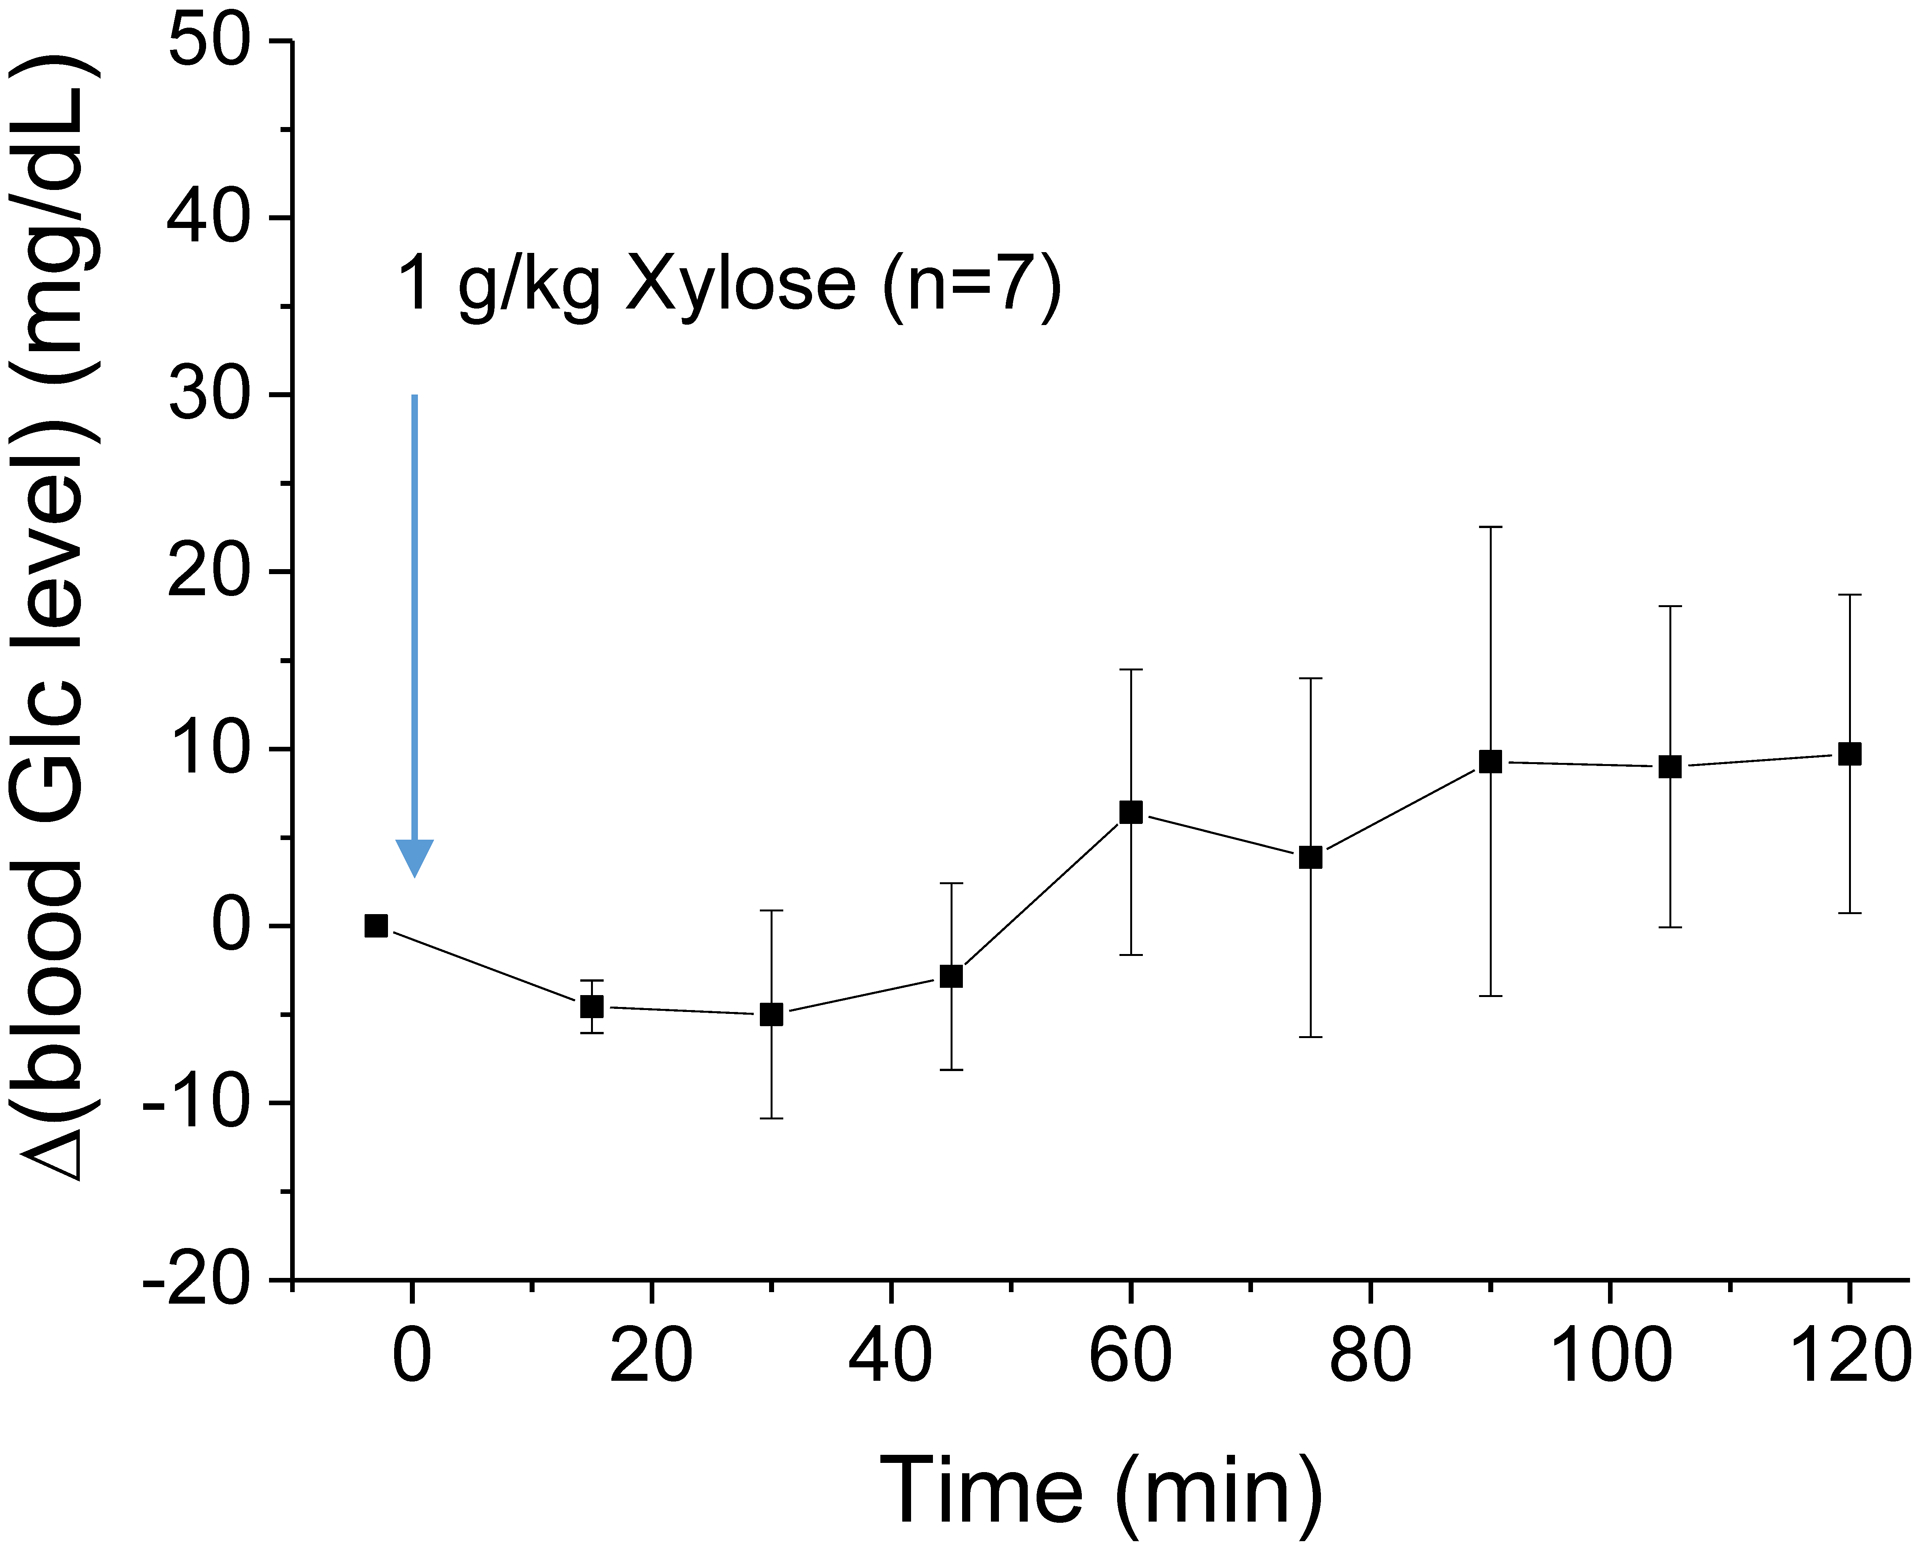
Injection of 1 g/kg xylose does not cause a significant change in blood glucose level for 2 hours.
Fig. 6. Electrical physiology measurements of rat brain cortex.
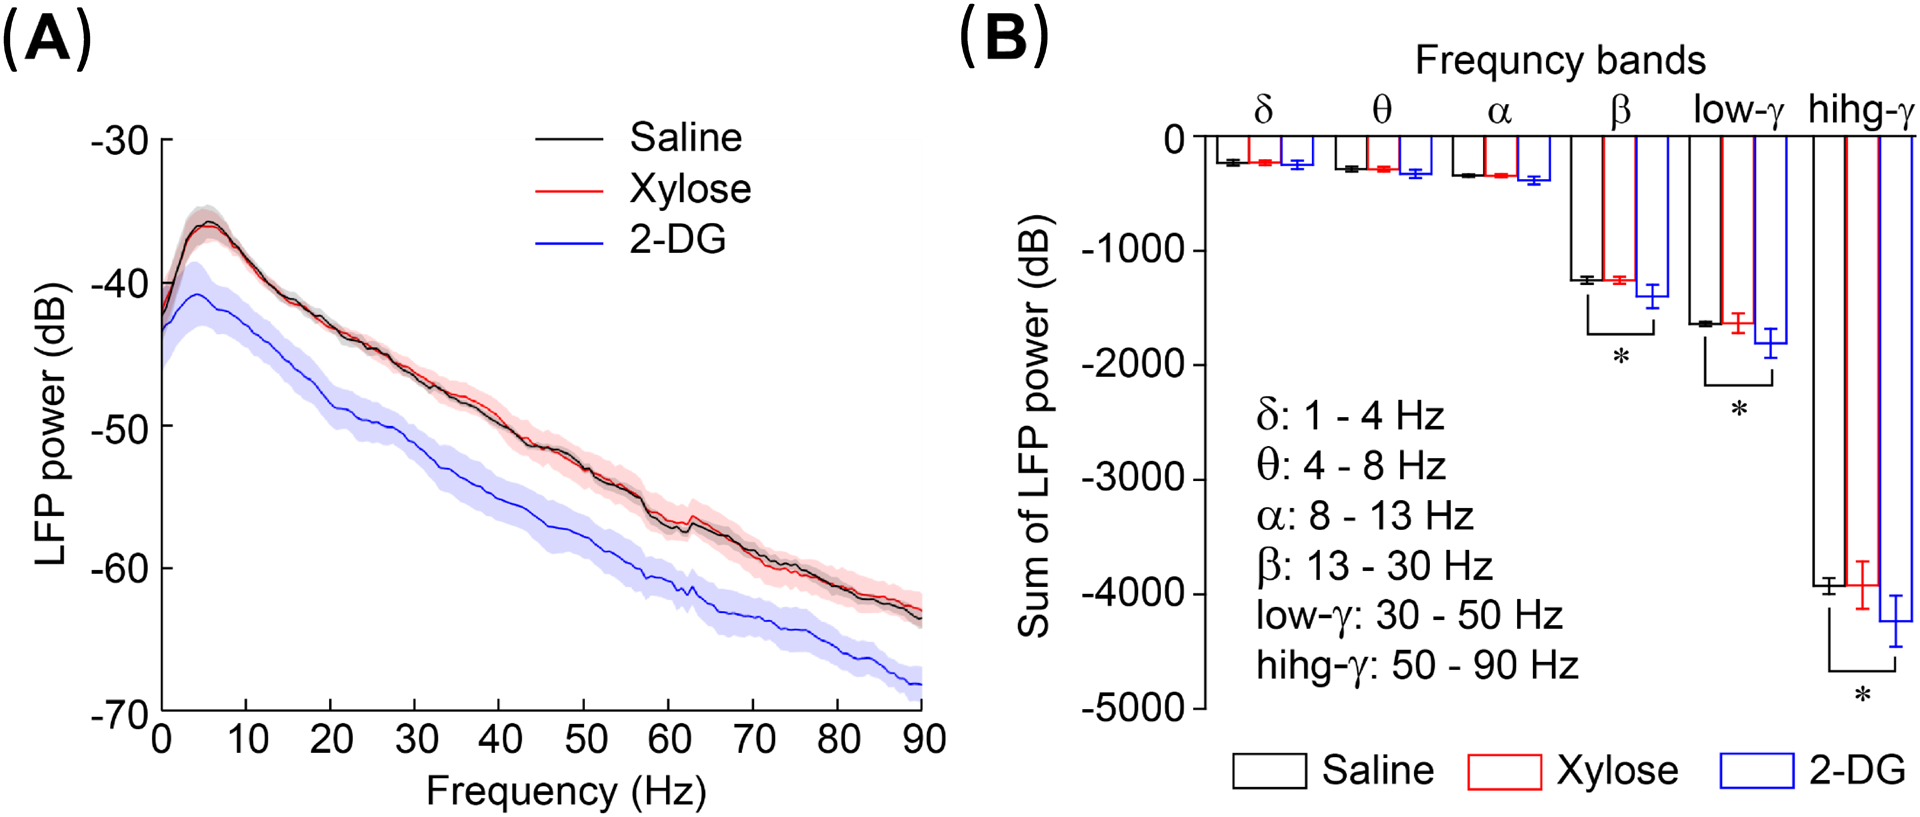
Both the LFP power spectra (A) and Summation of power (B) indicate that the results of xylose injection are close to those of saline injection and does not significantly affect neuronal activity. In contrast, 0.6 g/kg 2DG injection significantly (*, p < 0.01) reduces neuronal activity.
Discussions
Our results show that xylose has relatively high CESL sensitivity. The exchange-mediated relaxivity of 0.059 s−1/mM is only slightly smaller than those of glucose and 3OMG6,14. The peak R1ρ change after an injection of 1 g/kg dose is ~0.45 s−1, about 50% higher than Glc at the same dose6. Moreover, the decrease after the peak is much slower than Glc because of it slower metabolism and clearance from body. Compared to 3OMG, the overall sensitivity of xylose is comparable because it has a higher peak than 3OMG (0.4 s−1) but a faster decrease after the peak. Thus, xylose can be more advantageous than 3OMG i) for studies which does not require an extensive scanning time (e.g., <30 min post injection), ii) because its safety is already established and has been approved for human malabsorption test, and iii) it is a natural glucose analog and the price is much cheaper.
Our results confirmed previous studies which reported a higher sensitivity in CESL than CEST for the detection of glucose and analogs, which can be attributed to its higher sensitivity to intermediate exchange6,7. CESL acquisition also has a higher temporal resolution than CEST, allowing more data averaging or higher power for statistical analysis. Moreover, it is clear that baseline signal variation is much higher in CEST than CESL (as shown by the large relative error bar in Fig. 4). This is probably caused by the susceptibility of CEST signal to the magnetic field fluctuation induced by breathing. Recent simulation study suggested that off-resonance spin-lock imaging may offer further sensitivity enhancement compared to on-resonance spin-lock24,25, and further experiments are necessary to validate this expected sensitivity enhancement. It should also be noted that CEST acquisition is more sensitive to B0 drift6,26. Although we corrected the global B0 drift by adjusting the carrier frequency every 10-min, the significant spatial heterogeneity in Fig. 4A suggests that the B0 drift may be spatial-dependent for our in vivo study, and thus, a B0 map based voxel-by-voxel correction of B0 drift may be necessary for future CEST-based studies.
One limit of on-resonance CESL is that it has numerous non-specific contributions such as osmolality6,14 or vascular effects23, whereas in CEST these non-specific effects are suppressed in MTRasym due to the subtraction of images acquired at reference and label frequencies. Our previous results suggest that the osmolality effect increases super-linearly with dose, and the effect is more severe at larger doses14. Dynamic glucose enhanced (DGE) imaging has been proposed to acquire images only at the label frequency at 1.2 ppm and thus avoid asymmetry analysis27, i.e., the red curve in Fig. 4C which has a peak contrast of ~50% higher than MTRasym. The DGE method enhances the sensitivity for glucose detection but without a reference scan, non-specific effects such as a change of osmolality would remain, similar to CESL14. These non-specific effects may change the water T2 relaxation time and hence, the direct saturation effect and the CEST signal. In CESL study they can be alleviated by a dispersion measurement, i.e., acquiring CESL data at different spin-lock powers where R1ρ at a high power is used as a reference because it suppresses only the chemical exchange effect but not non-specific effects14. However, a very high power of >2000 Hz to provide enough dispersion will likely increase the specific absorption rate and limit human application.
Given the low sensitivity of glucose for chemical exchange sensitive MRI, there has been increasing interest in finding molecules which can be used in humans with relatively large doses, with slower clearance in the body or inside the tissue of interest due to phenomena like metabolism. Several molecules, such as dextran and sucrose28,29, have been examined. Although these molecules have limited uptake to cells before breakdown, they can enter the extracellular space, and thus, can be applied to diseases such as tumors or to detect BBB leakage. Glucosamine, an amino monosaccharide, can be transported to cells and thus is used for the study of glucose uptake30. Its metabolism is much slower than glucose and showed similar sensitivity with 3OMG, but the approved dosage for human use is typically ~1 g, which is an order of magnitude smaller than those approved for Glc and xylose. Note that the approved dose for xylose is typically 25 g in the malabsorption test, and it has been used with an oral dose up to 1.5 g/kg in infants31,32. A combination of a 25-g oral dose and 10-g IV injection of xylose has also been used32,33.
Injection with a pharmacological dose of glucose or glucose analog may induce insulin responses and change systematic physiology, and thus, complicate data and interpretation. Specifically, there is concern that the injection of a non-metabolizable glucose analog may lead to hypoglycemic conditions or trigger a late glycolytic stress response and affect brain function13. Our results in Fig. 5 show that an intravenous bolus injection of xylose has a minimal effect on blood glucose level for 2 hours post injection. This agrees with a previous report where the change of blood glucose only slightly increased from 4.6 mM to 5.2 mM at 1 hour after an injection of 1.5 g/kg xylose injection and returns to the pre-injection baseline in 1 to 4 hours19. A previous study of electrophysiology and functional MRI has suggested that a 0.5 g/kg fluorodeoxyglucose injection can be tolerated with minimal effects on baseline cerebral physiology and on brain function during neural stimulation34. Our electrophysiology measurements with a dose of 0.6 g/kg indicates that xylose has a much milder effect than 2DG and does not affect baseline brain function. Thus, it can potentially be applied to wider patient populations than glucose, such as diabetic patients. In fact, it has already shown benefits in regulating blood glucose levels in diabetic patients35,36 and patients with postprandial hyperglycemia37. Particularly, xylose may be a good candidate for studies of glucose uptake when hyperglycemia may be particularly detrimental to tissue health, such as in acute stroke or traumatic brain injury38–43.
Given the capability of CESL for the detection of impaired glucose uptake, our recent rat studies at 9.4 T have highlighted brain tumors with 0.5 g/kg of glucose21, and in ischemic tissues with 0.6 g/kg of 3OMG14. However, the high rate of hydroxyl-water exchange hinders CESL and CEST application of glucose and analogs at lower fields. Recent studies at 3 T have shown that it is difficult to detect tumor contrast in human patients by using 25 g of glucose with CEST44, and the sensitivity is weak with CESL45. Compared to glucose, xylose-CESL has about ~70% higher area under the curve (AUC) using the same dosage. While this enhancement may still not be enough to resolve the sensitivity bottleneck, it promises progress toward helping achieve this goal together with research in other technical developments, including hardware and post-processing methods.
Conclusions
Our results show that xylose has high sensitivity for CESL imaging, while CESL provides higher sensitivity than CEST in normal conditions. Xylose is also safe to use within pharmacological doses of ~1 g/kg. In summary, xylose may be a good alternative to glucose for the imaging of glucose uptake, especially in situations where high glucose doses are not recommended.
Acknowledgments
This work is supported by NIH grants NS100703 and EB003324.
References
- 1.Shah K, DeSilva S, Abbruscato T. The Role of Glucose Transporters in Brain Disease: Diabetes and Alzheimer’s Disease. International Journal of Molecular Sciences. 2012;13(10):12629–12655. [DOI] [PMC free article] [PubMed] [Google Scholar]
- 2.Chan KWY, McMahon MT, Kato Y, et al. Natural D-glucose as a biodegradable MRI contrast agent for detecting cancer. Magn Reson Med. 2012;68(6):1764–1773. [DOI] [PMC free article] [PubMed] [Google Scholar]
- 3.Nasrallah FA, Pages G, Kuchel PW, Golay X, Chuang KH. Imaging brain deoxyglucose uptake and metabolism by glucoCEST MRI. J Cereb Blood Flow Metab. 2013;33(8):1270–1278. [DOI] [PMC free article] [PubMed] [Google Scholar]
- 4.Walker-Samuel S, Ramasawmy R, Torrealdea F, et al. In vivo imaging of glucose uptake and metabolism in tumors. Nat Med. 2013;19(8):1067–1072. [DOI] [PMC free article] [PubMed] [Google Scholar]
- 5.Zhou JY, van Zijl PCM. Chemical exchange saturation transfer imaging and spectroscopy. Progress in Nuclear Magnetic Resonance Spectroscopy. 2006;48(2–3):109–136. [Google Scholar]
- 6.Jin T, Mehrens H, Hendrich K, Kim SG. Mapping brain glucose uptake with chemical exchange-sensitive spin-lock magnetic resonance imaging. J Cereb Blood Flow Metab. 2014;34(8):1402–1410. [DOI] [PMC free article] [PubMed] [Google Scholar]
- 7.Zu Z, Spear J, Li H, Xu J, Gore JC. Measurement of regional cerebral glucose uptake by magnetic resonance spin-lock imaging. Magn Reson Imaging. 2014;32(9):1078–1084. [DOI] [PMC free article] [PubMed] [Google Scholar]
- 8.Schuenke P, Paech D, Koehler C, et al. Fast and Quantitative T1 rho-weighted Dynamic Glucose Enhanced MRI. Sci Rep. 2017;7,42093. [DOI] [PMC free article] [PubMed] [Google Scholar]
- 9.Schuenke P, Koehler C, Korzowski A, et al. Adiabatically prepared spin-lock approach for T1ρ-based dynamic glucose enhanced MRI at ultrahigh fields. Magn Reson Med. 2016. [DOI] [PubMed]
- 10.Xu X, Xu JD, Chan KWY, et al. GlucoCEST imaging with on-resonance variable delay multiple pulse (onVDMP) MRI. Magn Reson Med. 2019;81(1):47–56. [DOI] [PMC free article] [PubMed] [Google Scholar]
- 11.Jin T, Mehrens H, Wang P, Kim SG. Glucose metabolism-weighted imaging with chemical exchange-sensitive MRI of 2-deoxyglucose (2DG) in brain: Sensitivity and biological sources. Neuroimage. 2016;143:82–90. [DOI] [PMC free article] [PubMed] [Google Scholar]
- 12.Rivlin M, Tsarfaty I, Navon G. Functional Molecular Imaging of Tumors by Chemical Exchange Saturation Transfer MRI of 3-O-Methyl-D-Glucose. Magn Reson Med. 2014;72(5):1375–1380. [DOI] [PubMed] [Google Scholar]
- 13.Sehgal AA, Li YG, Lal B, et al. CEST MRI of 3-O-methyl-D-glucose uptake and accumulation in brain tumors. Magn Reson Med. 2019;81(3):1993–2000. [DOI] [PMC free article] [PubMed] [Google Scholar]
- 14.Jin T, Mehrens H, Wang P, Kim SG. Chemical exchange-sensitive spin-lock MRI of glucose analog 3-O-methyl-d-glucose in normal and ischemic brain. J Cereb Blood Flow Metab. 2017. [DOI] [PMC free article] [PubMed]
- 15.Huntley NF, Patience JF. Xylose: absorption, fermentation, and post-absorptive metabolism in the pig. Journal of Animal Science and Biotechnology. 2018;9:4. [DOI] [PMC free article] [PubMed] [Google Scholar]
- 16.Zilva JF, Pannall PR. Clinical Chemistry in Diagnosis and Treatment. London: Lloyd-Luke; 1984. [Google Scholar]
- 17.Christiansen PA, Kirsner JB, Ablaza J. D-XYLOSE AND ITS USE IN THE DIAGNOSIS OF MALABSORPTIVE STATES. Am J Med. 1959;27(3):443–453. [DOI] [PubMed] [Google Scholar]
- 18.Fordtran JS, Clodi PH, Ingelfinger FJ, Soergel KH. SUGAR ABSORPTION TESTS, WITH SPECIAL REFERENCE TO 3–0-METHYL-D-GLUCOSE AND D-XYLOSE. Ann Intern Med. 1962;57(6):883-+. [DOI] [PubMed] [Google Scholar]
- 19.Lefevre PG, Peters AA. EVIDENCE OF MEDIATED TRANSFER OF MONOSACCHARIDES FROM BLOOD TO BRAIN IN RODENTS. J Neurochem. 1966;13(1):35-&. [DOI] [PubMed] [Google Scholar]
- 20.Jin T, Autio J, Obata T, Kim SG. Spin-locking versus chemical exchange saturation transfer MRI for investigating chemical exchange process between water and labile metabolite protons. Magn Reson Med. 2011;65(5):1448–1460. [DOI] [PMC free article] [PubMed] [Google Scholar]
- 21.Jin T, Iordanova B, Hitchens TK, et al. Chemical exchange-sensitive spin-lock (CESL) MRI of glucose and analogs in brain tumors. Magn Reson Med. 2018;80(2):488–495. [DOI] [PMC free article] [PubMed] [Google Scholar]
- 22.Strupp JP. Stimulate: A GUI based fMRI analysis software package. Neuroimage. 1996;3:S607. [Google Scholar]
- 23.Jin T, Kim SG. Characterization of non-hemodynamic functional signal measured by spin-lock fMRI. Neuroimage. 2013;78:385–395. [DOI] [PMC free article] [PubMed] [Google Scholar]
- 24.Zaiss M, Anemone A, Goerke S, et al. Quantification of hydroxyl exchange of D-Glucose at physiological conditions for optimization of glucoCEST MRI at 3, 7 and 9.4 Tesla. NMR Biomed. 2019;32(9):e4113. [DOI] [PMC free article] [PubMed] [Google Scholar]
- 25.Jin T, Kim SG. Advantages of chemical exchange-sensitive spin-lock (CESL) over chemical exchange saturation transfer (CEST) for hydroxyl–and amine-water proton exchange studies. NMR Biomed. 2014;27:1313–1324. [DOI] [PMC free article] [PubMed] [Google Scholar]
- 26.Zaiss M, Herz K, Deshmane A, et al. Possible artifacts in dynamic CEST MRI due to motion and field alterations. J Magn Reson. 2019;298:16–22. [DOI] [PubMed] [Google Scholar]
- 27.Xu X, Chan KW, Knutsson L, et al. Dynamic glucose enhanced (DGE) MRI for combined imaging of blood-brain barrier break down and increased blood volume in brain cancer. Magn Reson Med. 2015;74(6):1556–1563. [DOI] [PMC free article] [PubMed] [Google Scholar]
- 28.Li YG, Qiao Y, Chen HW, et al. Characterization of tumor vascular permeability using natural dextrans and CEST MRI. Magn Reson Med. 2018;79(2):1001–1009. [DOI] [PMC free article] [PubMed] [Google Scholar]
- 29.Bagga P, Haris M, D’Aquilla K, et al. Non-caloric sweetener provides magnetic resonance imaging contrast for cancer detection. J Transl Med. 2017;15:119. [DOI] [PMC free article] [PubMed] [Google Scholar]
- 30.Rivlin M, Navon G. Glucosamine and N-acetyl glucosamine as new CEST MRI agents for molecular imaging of tumors. Sci Rep. 2016;6. [DOI] [PMC free article] [PubMed] [Google Scholar]
- 31.Abraham JM, Levin B, Oberholzer VG, Russell A. GLUCOSE-GALACTOSE MALABSORPTION. Arch Dis Child. 1967;42(226):592–597. [DOI] [PMC free article] [PubMed] [Google Scholar]
- 32.Carlson S, Craig RM. D-XYLOSE HYDROGEN BREATH TESTS COMPARED TO ABSORPTION KINETICS IN HUMAN PATIENTS WITH AND WITHOUT MALABSORPTION. Dig Dis Sci. 1995;40(10):2259–2267. [DOI] [PubMed] [Google Scholar]
- 33.Worwag EM, Craig RM, Jansyn EM, Kirby D, Hubler GL, Atkinson AJ. D-XYLOSE ABSORPTION AND DISPOSITION IN PATIENTS WITH MODERATELY IMPAIRED RENAL-FUNCTION. Clin Pharmacol Ther. 1987;41(3):351–357. [DOI] [PubMed] [Google Scholar]
- 34.Coman D, Sanganahalli BG, Cheng D, McCarthy T, Rothman DL, Hyder F. Mapping phosphorylation rate of fluoro-deoxy-glucose in rat brain by F-19 chemical shift imaging. Magn Reson Imaging. 2014;32(4):305–313. [DOI] [PMC free article] [PubMed] [Google Scholar]
- 35.Wu TZ, Bound MJ, Zhao BYR, et al. Effects of a D-Xylose Preload With or Without Sitagliptin on Gastric Emptying, Glucagon-Like Peptide-1, and Postprandial Glycemia in Type 2 Diabetes. Diabetes Care. 2013;36(7):1913–1918. [DOI] [PMC free article] [PubMed] [Google Scholar]
- 36.Goodwin NC, Mabon R, Harrison BA, et al. Novel L-Xylose Derivatives as Selective Sodium-Dependent Glucose Cotransporter 2 (SGLT2) Inhibitors for the Treatment of Type 2 Diabetes. J Med Chem. 2009;52(20):6201–6204. [DOI] [PubMed] [Google Scholar]
- 37.Bae YJ, Bak YK, Kim B, Kim MS, Lee JH, Sung MK. Coconut-derived D-xylose affects postprandial glucose and insulin responses in healthy individuals. Nutrition Research and Practice. 2011;5(6):533–539. [DOI] [PMC free article] [PubMed] [Google Scholar]
- 38.Capes SE, Hunt D, Malmberg K, Pathak P, Gerstein HC. Stress hyperglycemia and prognosis of stroke in nondiabetic and diabetic patients - A systematic overview. Stroke. 2001;32(10):2426–2432. [DOI] [PubMed] [Google Scholar]
- 39.Combs DJ, Reuland DS, Martin DB, Zelenock GB, Dalecy LG. Glycolytic inhibition by 2-deoxyglucose reduces hyperglycemia-associated mortality and morbidity in the ischemic rat. Stroke. 1986;17(5):989–994. [DOI] [PubMed] [Google Scholar]
- 40.Martini SR, Kent TA. Hyperglycemia in acute ischemic stroke: a vascular perspective. J Cereb Blood Flow Metab. 2007;27(3):435–451. [DOI] [PubMed] [Google Scholar]
- 41.Parsons MW, Barber PA, Desmond PM, et al. Acute Hyperglycemia Adversely Affects Stroke Outcome: A Magnetic Resonance Imaging and Spectroscopy Study. Ann Neurol. 2002;52:20–28. [DOI] [PubMed] [Google Scholar]
- 42.Rovlias A, Kotsou S. The influence of hyperglycemia on neurological outcome in patients with severe head injury. Neurosurgery. 2000;46(2):335–342. [DOI] [PubMed] [Google Scholar]
- 43.Robinson TG, Potter JF. POSTPRANDIAL AND ORTHOSTATIC CARDIOVASCULAR CHANGES AFTER ACUTE STROKE. Stroke. 1995;26(10):1811–1816. [DOI] [PubMed] [Google Scholar]
- 44.Kim M, Torrealdea F, Adeleke S, et al. Challenges in glucoCEST MR body imaging at 3 Tesla. Quantitative Imaging in Medicine and Surgery. 2019;9(10):1628-+. [DOI] [PMC free article] [PubMed] [Google Scholar]
- 45.Herz K, Lindig T, Deshmane A, et al. T1 rho-based dynamic glucose-enhanced (DGE rho) MRI at 3 T: method development and early clinical experience in the human brain. Magn Reson Med. 2019;82(5):1832–1847. [DOI] [PubMed] [Google Scholar]