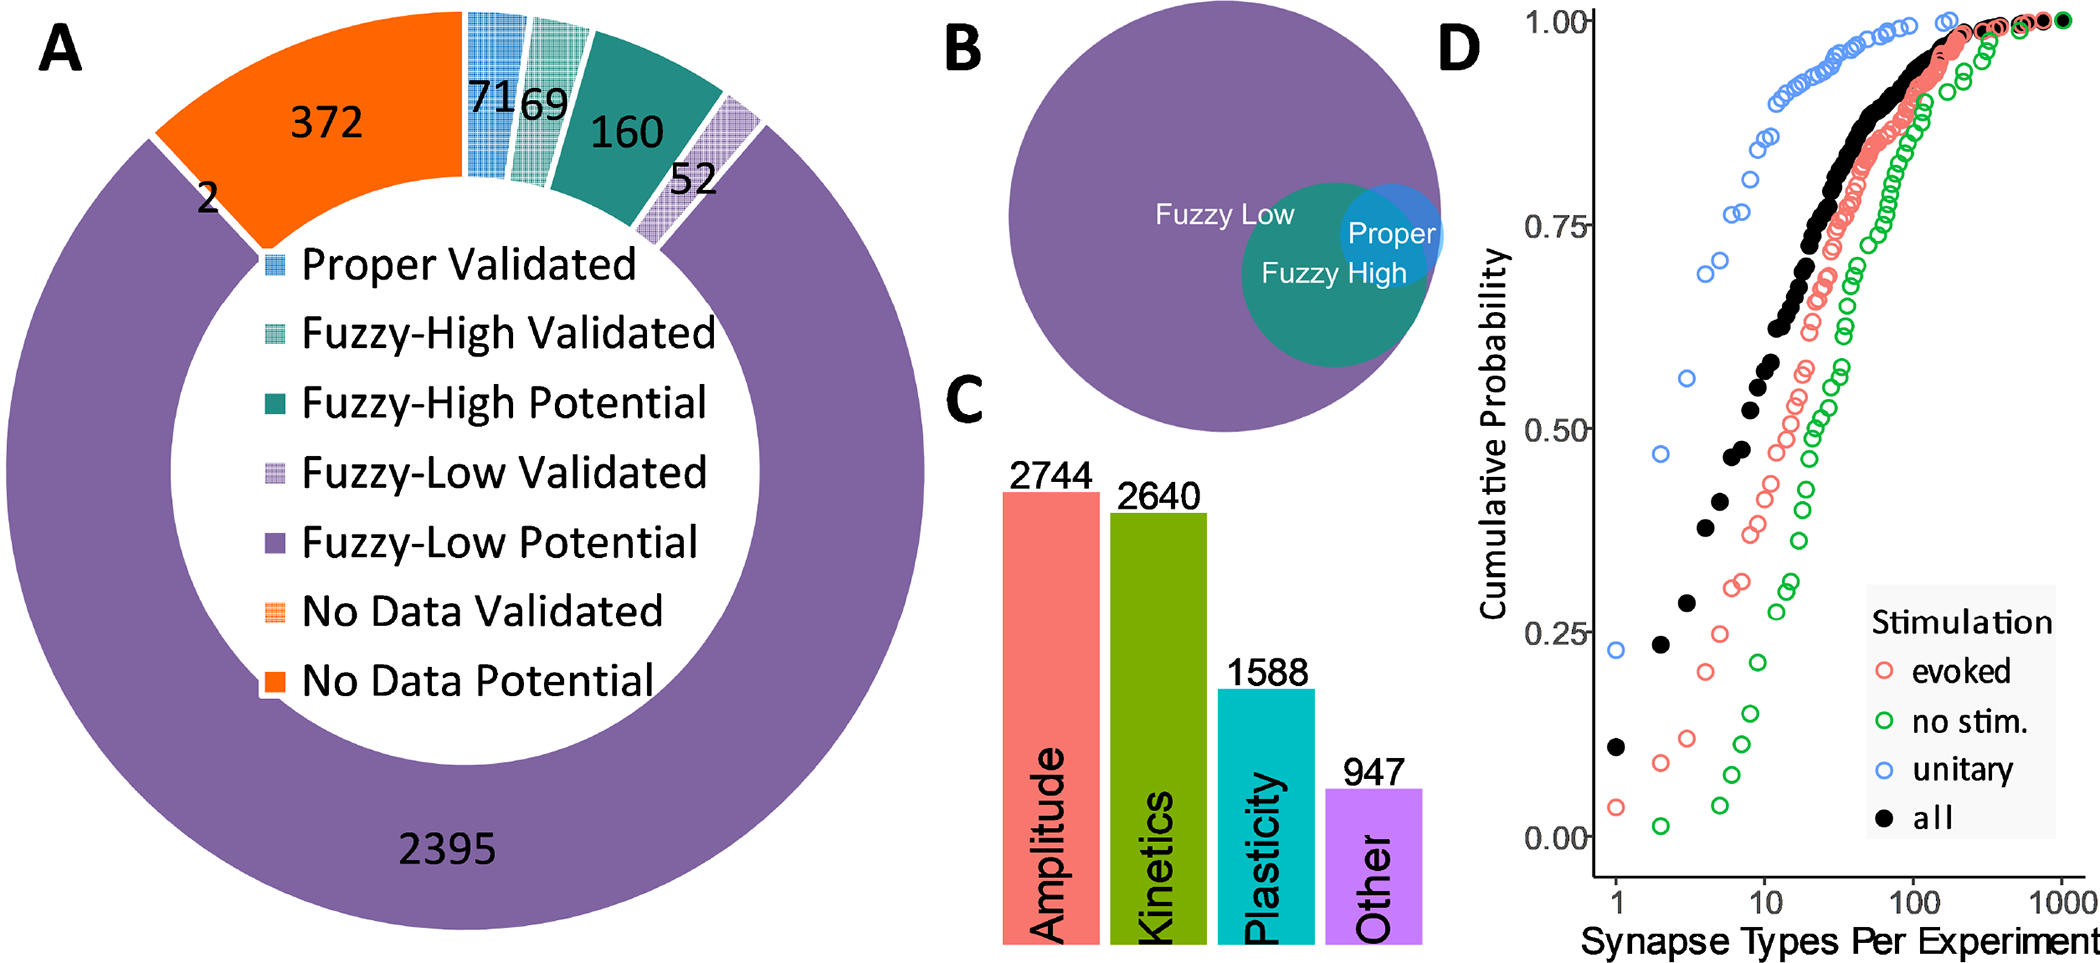
Figure 3. Mapping summary.

(A) Integrated knowledge mapping (clockwise from top): “proper” (blue), “high-confidence fuzzy” (green), and “low-confidence fuzzy” (purple). Grid patterns indicate validated (as opposed to potential) connections. (B) An individual synapse type may be linked to multiple experiments with variable mapping confidence. (C) Amplitude and kinetics are the most prevalently reported synaptic electrophysiology properties. (D) Mapping degeneracy by stimulation method: unitary signals (mostly paired recording), evoked (extracellular) and spontaneous. Filled circles represent all methods together.
