

Abstract
This paper presents an approach to the real-time, label-free, specific, and sensitive monitoring of insulin using a graphene aptameric nanosensor. The nanosensor is configured as a field-effect transistor, whose graphene-based conducting channel is functionalized with a guanine-rich IGA3 aptamer. The negatively charged aptamer folds into a compact and stable antiparallel or parallel G-quadruplex conformation upon binding with insulin, resulting in a change in the carrier density, and hence the electrical conductance, of the graphene. The change in the electrical conductance is then measured to enable the real-time monitoring of insulin levels. Testing has shown that the nanosensor offers an estimated limit of detection down to 35 pM and is functional in Krebs–Ringer bicarbonate buffer, a standard pancreatic islet perfusion medium. These results demonstrate the potential utility of this approach in label-free monitoring of insulin and in timely prediction of accurate insulin dosage in clinical diagnostics.
Keywords: affinity sensing, aptamer, G-quadruplex, graphene field-effect transistor (GFET), insulin
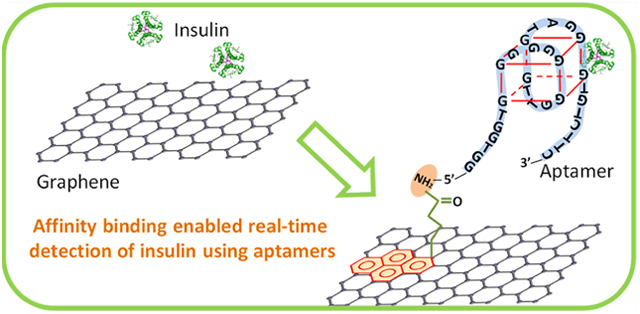
Graphical Abstract
1. INTRODUCTION
Control of glucose levels in blood is critical for patients suffering from both type 1 and 2 diabetes.1 Most of the therapeutic options for glucose control require the administration of insulin, an endocrine peptide hormone promoting absorption of blood sugar. Although insulin can be injected or inhaled by patients, it remains challenging to choose a correct dose schedule, as the effective durations and strengths of different types of insulins vary significantly.2,3 Blood sugar levels are usually measured to assist in determining the dosage of insulin injection. This lacks accuracy because there is a lag from insulin introduction to effective glucose regulation.4 Therefore, the correct and timely use of insulin is strongly dependent on accurate predictions of insulin levels in the human body.
Conventional antigen–antibody-based methods to quantify insulin concentrations, such as the radioimmunoassay and enzyme-linked immunosorbent assay, are time-consuming and not amenable to real-time monitoring.5 Electrochemical or optical sensors have been developed to reduce the required detection time (<2 h).4,6–9 However, because of the low molecular mass (5807.57 g/mol) and weak electric charge of insulin, the sensitivities (1.34 nM) obtained using these methods have not allowed for label-free detection of insulin at physiologically relevant levels (lower than 270 pM)3 without pretreatment of samples.
In this paper, we developed an aptameric nanosensor for the real-time monitoring of insulin levels. The nanosensor is based on a graphene field-effect transistor (GFET) and exploits the affinity binding between insulin and its specific aptameric receptor IGA3 (Figure 1). The short time required for monolayer aptamer–insulin binding and the rapid response of graphene to external stimuli allow the nanosensor to respond to changes in the insulin level within 260 s. Furthermore, physiologically relevant levels of insulin, as low as 35 pM, can be detected. This is attributable to the high sensitivity of the GFET to the changes in the charge distribution on and in the immediate vicinity of the graphene surface, which is offered by the high mobility and large surface-to-volume ratio of graphene. Moreover, as aptamers can discriminate between insulin and other closely related analogues on the basis of subtle structural differences, the aptameric nanosensor showed significant improvements in the specificity to insulin over devices based on the antigen–antibody binding.10 The aptameric nanosensor can hence potentially enable real-time monitoring of insulin in clinical applications.
Figure 1.
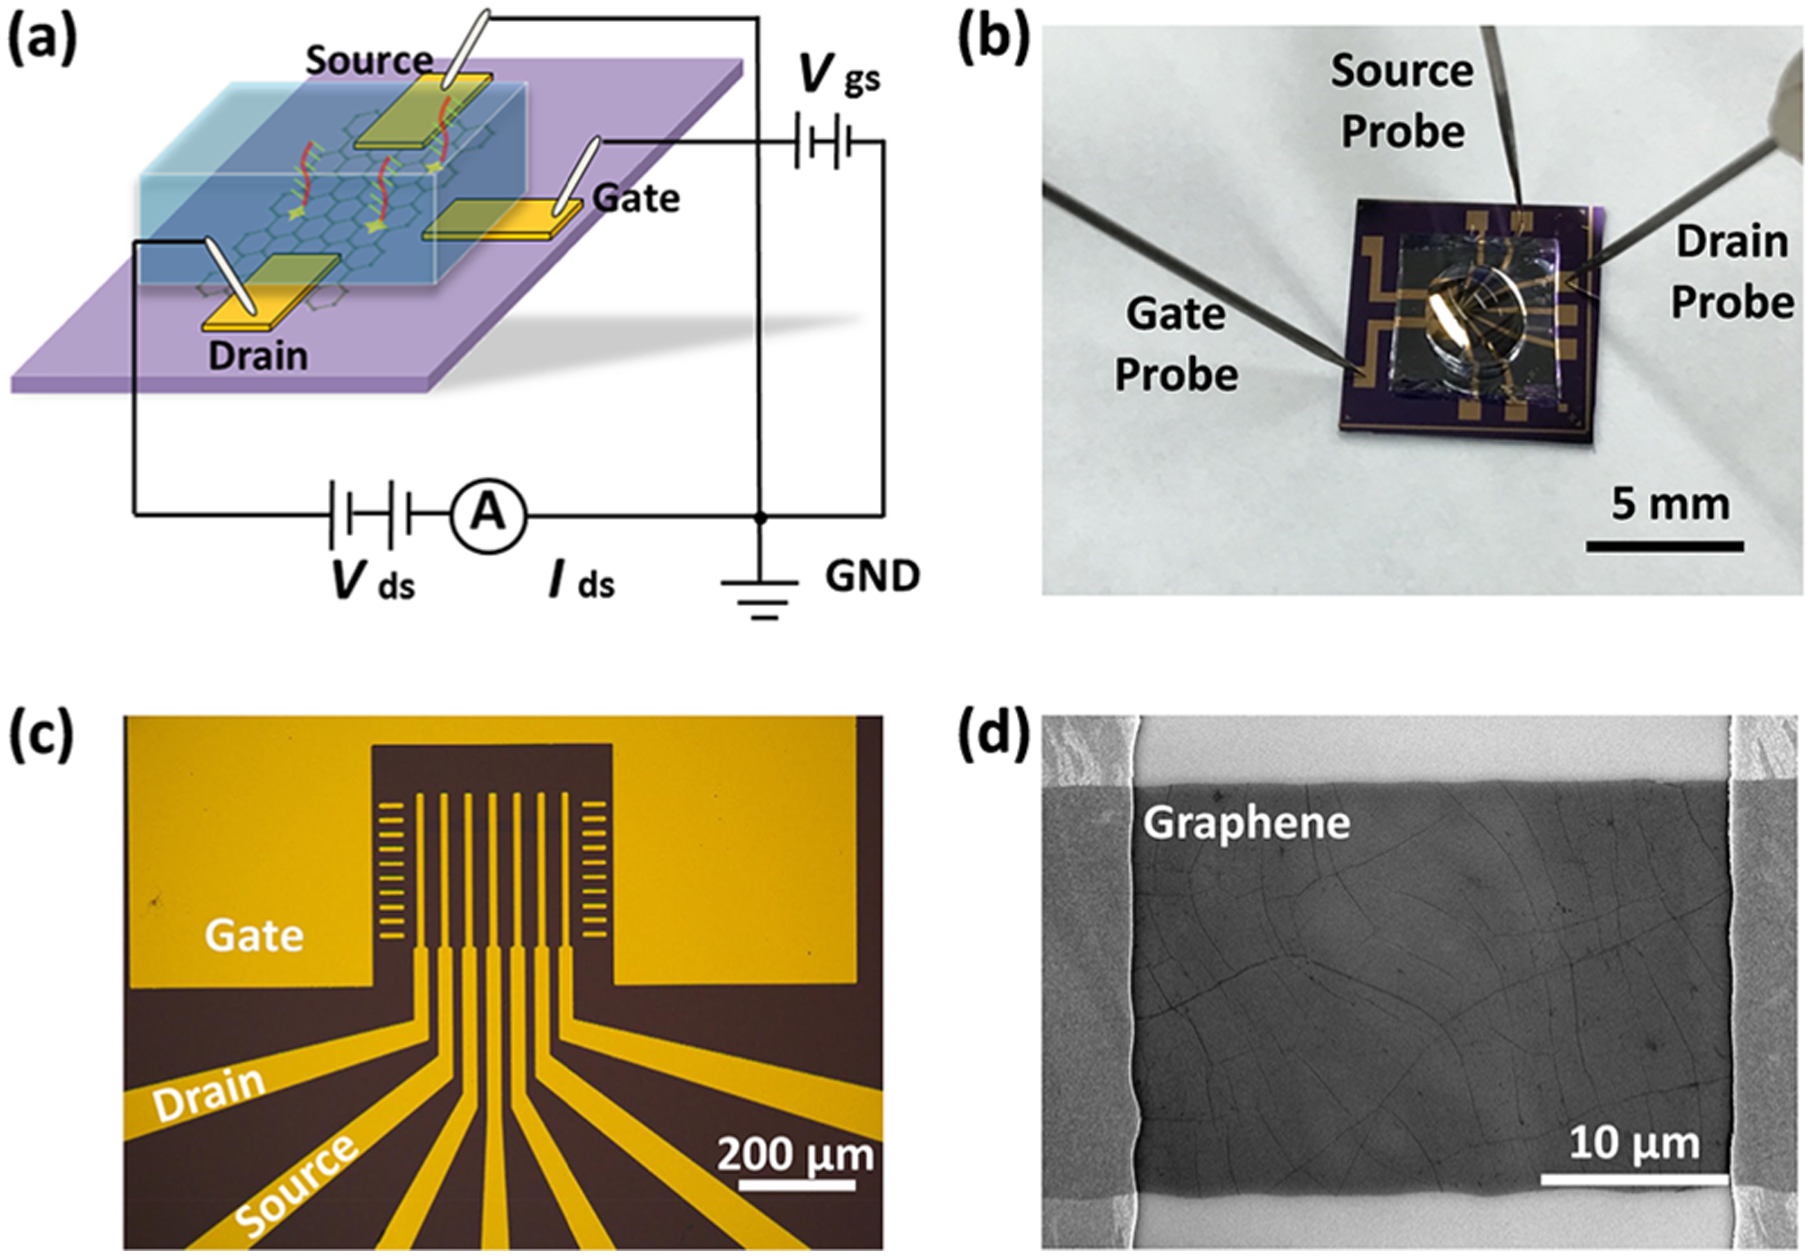
Graphene nanosensor. (a) Schematic of the nanosensor configured as a solution-gated GFET. (b) Nanosensor is packaged in a PDMS chamber for liquid handling. (c) Optical micrograph of a fabricated nanosensor. (d) Scanning electron micrograph of the single-layer graphene-conducting channel in the nanosensor.
2. METHODS
2.1. Principle.
The nanosensor is configured as a graphene-based FET (Figure 1a). The electrical double layer at the interface of the graphene and electrolytes serves as a gate dielectric.11 A drain–source bias Vds generates a current Ids through the graphene channel, as a function of applied gate voltage Vg.12,13
Detection of insulin was allowed by the structural change of the insulin-specific aptamer (IGA3) when interacting with insulin (Figure 2). IGA3 is a guanine-rich oligonucleotide strand, in which G-quartet planes can form via Hoogsteen base pairing, consisting of four hydrogen-bonded guanine bases.14 G-quadruplexes can then be generated by stacking of two or more G-quartet structures. These structural changes of the aptamer in the close vicinity of graphene cause disturbances to the charge carriers in graphene and result in detectable changes in the measured Ids.
Figure 2.
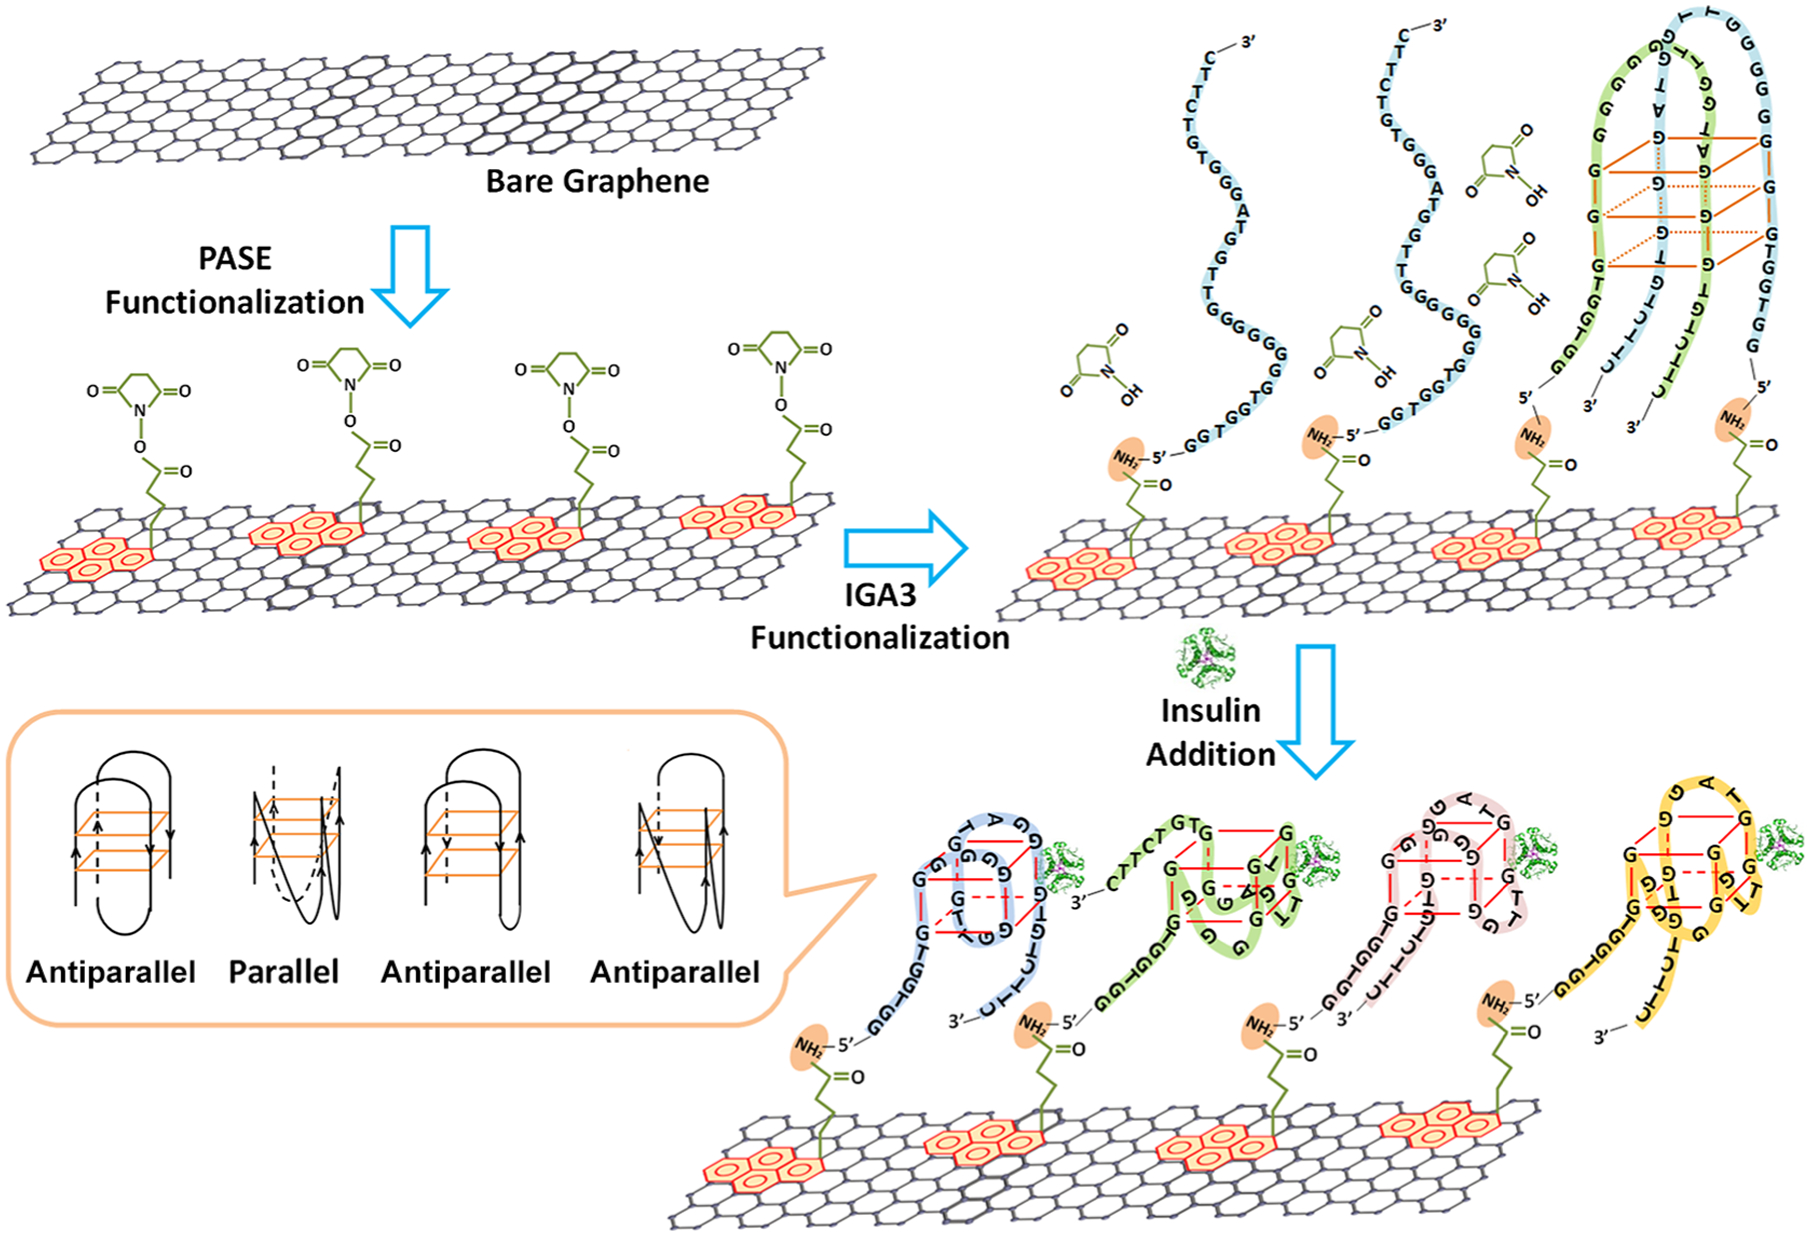
Principle of the graphene nanosensor for insulin detection. The sensing surface is prepared through Schiff-base reaction between aptamer IGA3 and the graphene-immobilized PASE linker. The aptamer specifically binds to insulin in the sample solution, promoting the formation of both parallel and antiparallel G-quadruplexes, which brings negatively charged insulin and DNA strands to the close vicinity of the graphene surface, causing disturbances to the carrier concentration in the bulk of graphene and yielding detectable signals.
2.2. Materials.
Chemical vapor deposition graphene was grown on an annealed copper (Cu) foil (99.9%, 25 μm thick). Polydimethylsiloxane (PDMS, SYLGARD-184) was purchased from Dow Corning (Midland, MI) for the PDMS chamber. 1-Pyrenebutanoic acid succinimidyl ester (PASE), phosphate buffered saline (PBS), human insulin, human glucagon, and human somatostatin were purchased from Sigma-Aldrich (St. Louis, MO). Insulin-specific aptamer (IGA3, sequence 5′-NH2-GGT GGT GGG GGG GGT TGG TAG GGT GTC TTC-3′) was synthesized and purified by Integrated DNA Technologies (Coralville, IA).
2.3. Fabrication, Surface Functionalization, and Measurement Methods.
Graphene was transferred onto 285 nm SiO2/Si substrate. Gate, drain, and source electrodes (Cr/Au) were subsequently fabricated using E-beam evaporation and lift-off techniques.15 The graphene was then patterned to define the conducting channel using photolithography and oxygen plasma etching.16
The graphene channel was then biochemically functionalized. PASE was noncovalently coupled to graphene via π−π interaction, after which the IGA3 aptamer was immobilized on the surface via the reaction of an amine group on the aptamer with the N-hydroxysuccinimide ester on PASE. Further details of the device fabrication and surface functionalization can be found in the Supporting Information.
For the GFET-based electrical measurements, both the drain and gate voltages were supplied by digital sourcemeters (Keithley 2400, Tektronix) and the current Ids was simultaneously measured using a custom-designed LabVIEW program.
3. RESULTS AND DISCUSSION
3.1. Control Experiment.
To examine the inertness of graphene to insulin, measurements were carried out by exposing the nanosensor to insulin solutions without prior biochemical functionalization of graphene (Figure 3a). We reason that thanks to the low molecular weight of insulin,17–20 at low concentrations, insulin is more likely not to adsorb to bare graphene in only a few minutes (<10 min) or the adsorption does not introduce significant variation in the graphene conductivity.21–23 Therefore, graphene is appropriate for insulin detection.
Figure 3.
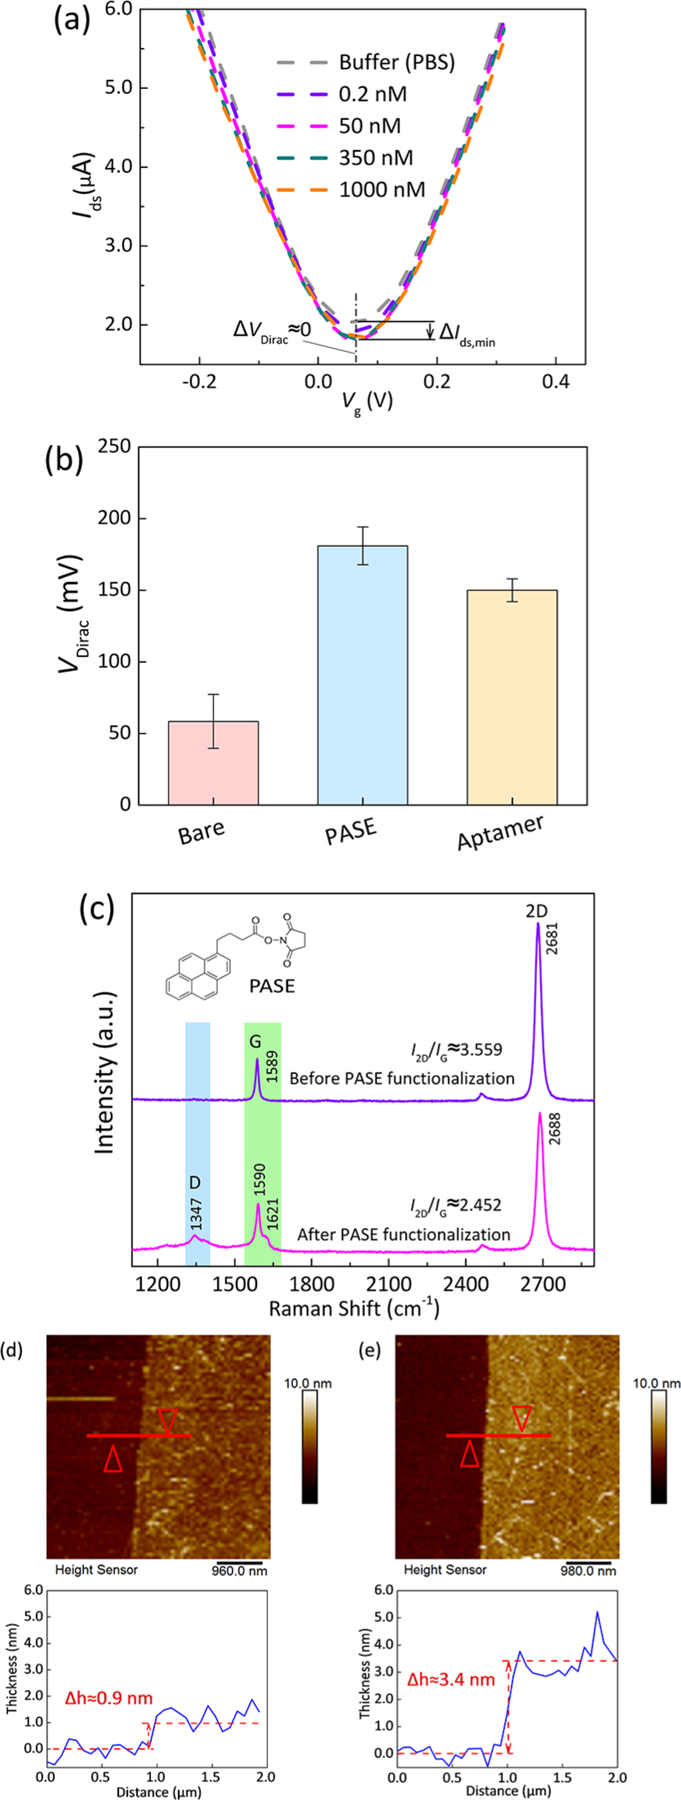
Characterization of biofunctionalization of graphene. (a) Transfer characteristics of bare graphene exposed to the insulin solution (200 pM to 1 μM). (b) Variation in VDirac of graphene before and after PASE and aptamer functionalization. (c) Raman spectra of graphene before and after exposure to the PASE solution. Signature peaks of the noncovalent π−π interaction between PASE and the graphene surface were observed after immersion in the PASE solution. (d) AFM image of bare graphene (thickness: 0.9 nm). (e) AFM image of the aptamer-functionalized graphene (thickness: 3.4 nm, consistent with previous work).
3.2. Characterization of Surface Functionalization.
Characterization of the functionalization of PASE and the aptamer was performed. The coupling of PASE to graphene was found to increase VDirac from 58.5 to 181 mV (Figure 3b), suggesting that PASE introduced strong p-type doping in graphene. The G-band splitting (1590 and 1621 cm−1) observed in the Raman spectra further confirmed the coupling of graphene and the pyrene groups on PASE (Figure 3c).24,25 After treatment of the IGA3 aptamer, VDirac was decreased by 31 mV, to a value of 150 mV (Figure 3b). The thickness of the graphene channel was measured by atomic force microscopy (AFM) and was found to have increased from 0.9 to 3.4 nm (Figure 3d,e), which was in agreement with the reported values of aptamer thickness on graphene.26,27 Therefore, it was concluded that the aptamer was successfully immobilized on the graphene surface.
3.3. Insulin Detection.
The nanosensor insulin measuring capabilities were subsequently tested in PBS buffer. Insulin solutions of increasing concentrations from 100 pM to 1 μM were sequentially introduced to the PDMS chamber of the nanosensor. The binding of insulin to the IGA3 aptamer was allowed to reach equilibrium before the replenishment of sample solutions. After exposure to insulin, the measured VDirac decreased significantly, at a rate of ~0.075 mV/pM within physiologically relevant insulin levels (Figure 4a), indicating that binding of insulin to the IGA3 aptamer generated n-type doping to graphene.
Figure 4.
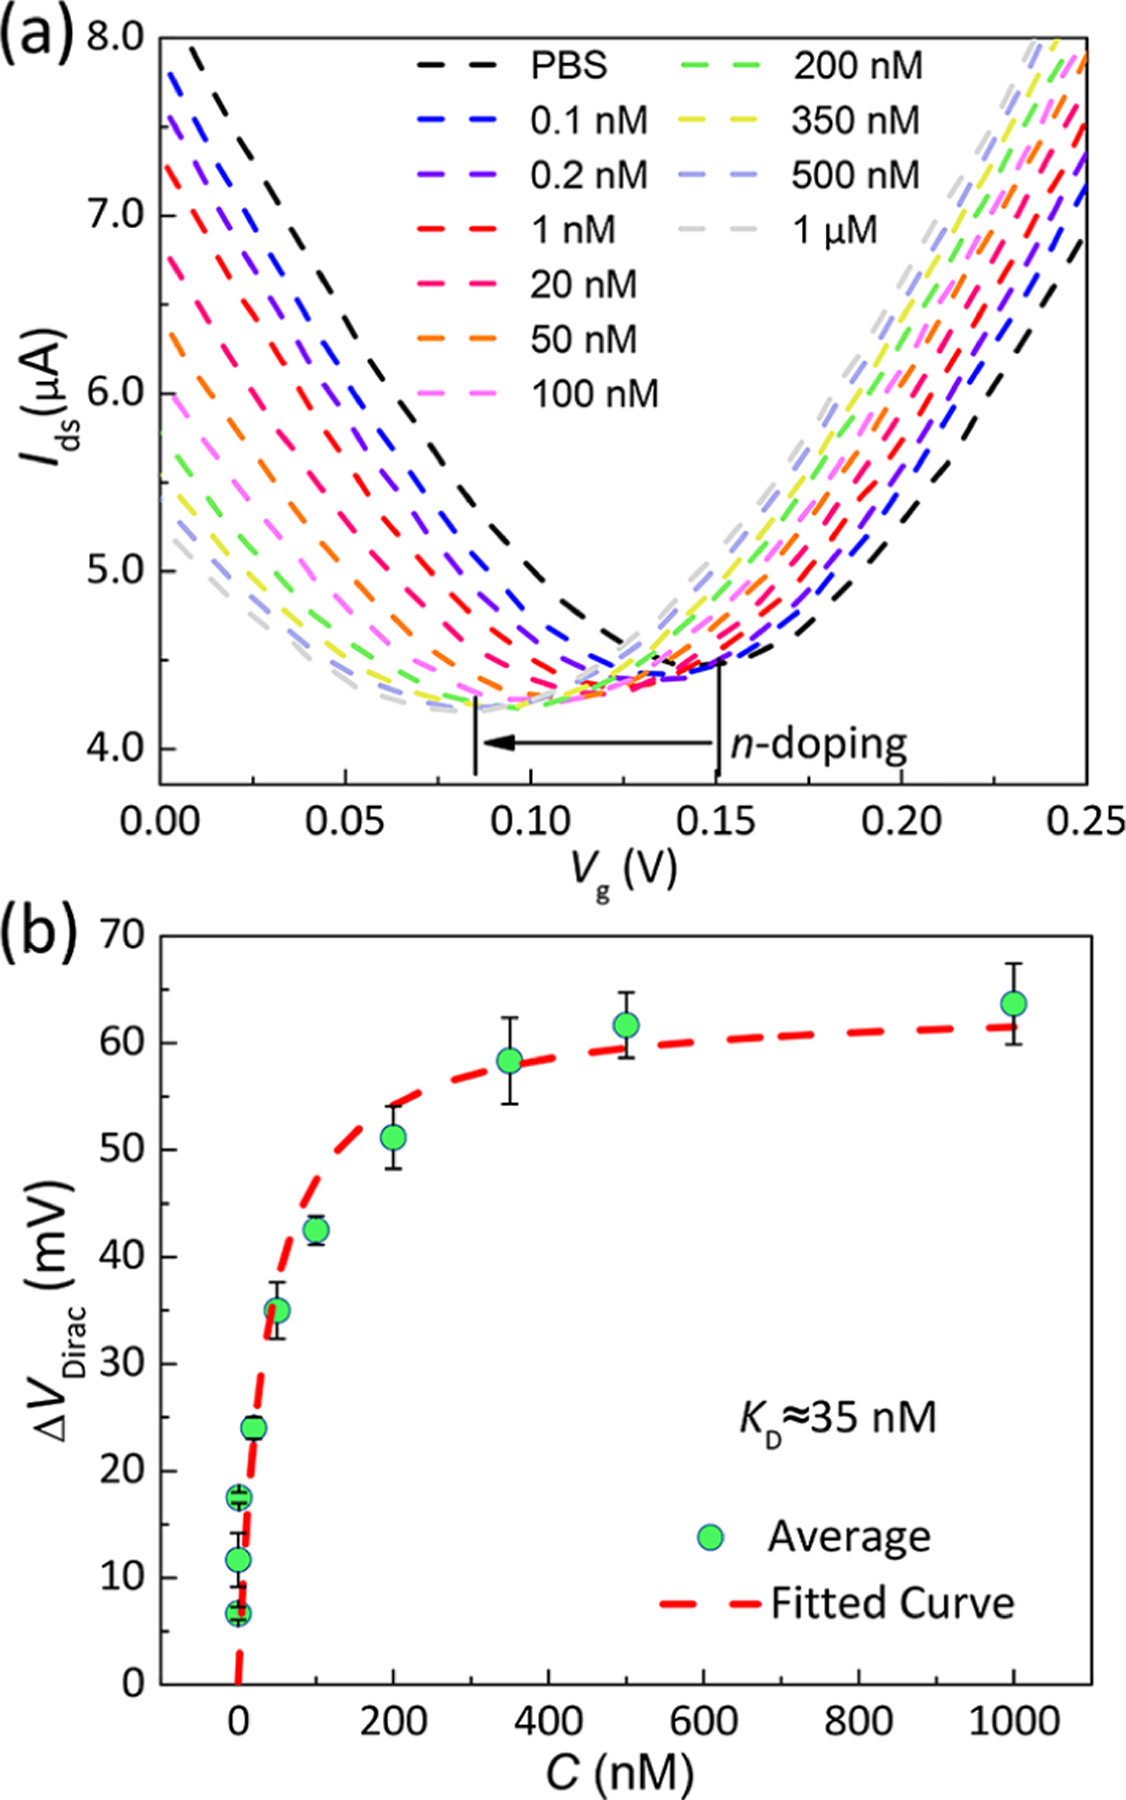
Detection of insulin using the aptameric nanosensor. (a) Transfer characteristics measured when the aptamer-functionalized graphene were exposed to insulin solutions (concentration: 100 pM to 1 μM). The transfer characteristic curve shifted to the left as a result of the increase of the insulin concentration. (b) Voltage shift ΔVDirac as a function of the insulin concentration. The dashed line is a least-squares fit to the Hill–Langmuir equation, yielding an equilibrium dissociation constant (KD) of 35 nM.
It was observed that the transconductance of both hole and electron conduction branches remained constant, at 40.476 ± 0.686 μS. Given that the ionic strength of the buffer did not change, the double layer capacitance was also deemed unchanged.28 Therefore, the carrier mobility was not expected to be varied significantly by the insulin–aptamer binding. Instead, the left shift of VDirac clearly suggested that more electrons (n-type carrier) were doped into graphene upon the interaction of insulin to the IGA3 aptamer. Typically, the detection of large biomarkers, such as proteins, using a solution-gated GFET is based on the electrostatic gating effect generated by the highly charged biomarkers on graphene.29–31 Under these circumstances, the charges induced in graphene were opposite to and hence in balance with the charges carried by the target molecules. In our experiments, while the insulin, whose isoelectric point (PI) is 5.8, was weakly and negatively charged at pH 7.4, n-type doping was generated in graphene upon binding of insulin to the IGA3 aptamer. Thus, the increase in the electron (n-type carrier) concentration in graphene was not considered as a result of the electrostatic gating effect but could be attributed to the direct charge transfer to graphene, from either insulin8,32–35 or the deformed IGA3 aptamer.36–38 Note that in the absence of insulin, the guanine-rich IGA3 was mostly unfolded in the solution while G-quartet structure may have formed as a result of Hoogsteen base pairing.14 Upon capture of insulin, the existing G-quartet structures can switch to stable, compact parallel or antiparallel G-quadruplex structures.4,39 These conformational changes brought the electron-rich aromatic nucleotide strands and insulin to the close proximity of the graphene surface,29 resulting in the direct binding of nucleotide or aromatic amino acids in insulin with the graphene surface and making electrons from either insulin or the deformed IGA3 aptamer more likely to be directly transferred into graphene through the π−π stacking interactions between them36,40–42 and generating n-type doping to graphene. This physical process has also been observed in the immobilization of DNA on carbon nanotubes32 and graphene oxide sheets43 and possibly serves as the underlying mechanism that allows us to measure the insulin levels.
Additionally, the binding of insulin and aptamer was allowed to reach equilibrium for 10 min before the replenishment of higher concentration insulin solution. Thus, the dipping time of graphene in solutions was increased with the ongoing experiment. The slight decrease in Ids,min, the minimum of Ids in the transfer characteristic curve, observed in Figure 4a was considered as a result of the increase in the ionic strength caused by the evaporation of PBS buffer (150 mM NaCl) with increasing dipping time.36,44 This is supported by control experiments in which Ids,min was observed to decrease from 2.03 to 1.85 μA with increasing dipping time and increasing concentrations of insulin (diluted in PBS buffer) from 0 to 1 μM (Figure 3a) and also in agreement with experimental observations reported by others.36
Further, we estimated the equilibrium dissociation constant (KD) for the IGA3 aptamer and insulin with different VDirac at corresponding insulin concentrations using the aptamer-functionalized GFETs. As shown in Figure 4a, the VDirac of transfer curves shifted to the left with a stepwise increase in the insulin concentration. The change in VDirac, denoted as ΔVDirac, is plotted as a function of insulin concentrations with error bars obtained from three different devices (Figure 4b). It can be seen that ΔVDirac sharply increased with increasing insulin concentrations from 100 pM to 50 nM and then gradually became saturated above 350 nM. Using this result, the binding of IGA3 aptamer with insulin on the graphene channel can be described by the Hill–Langmuir equation.31
| (1) |
where ΔVDirac,max and CINS are the saturated change of the VDirac and the concentration of insulin, respectively. KD is estimated to be 35 nM from the fitted curve shown in Figure 4b (dash curve), indicating a high affinity between IGA3 aptamer and insulin.
Time-resolved measurements of insulin were performed on the nanosensor with fixed drain–source bias Vds = 50 mV and gate bias Vg = −50 mV (Figure 5a). With increasing insulin concentrations from 100 pM to 1 μM, the measured Ids monotonically decreased from 8.09 to 7.16 μA (Figure 5b). The binding of insulin with the monolayer IGA3 aptamer reached equilibrium within 260 s (Figure 5c), appropriate for real-time monitoring of insulin levels. With a noise level of 8.66 nA, the limit of detection (LOD) was estimated to be 35 pM,45 better than most of the existing methods (Table 1).46,47
Figure 5.
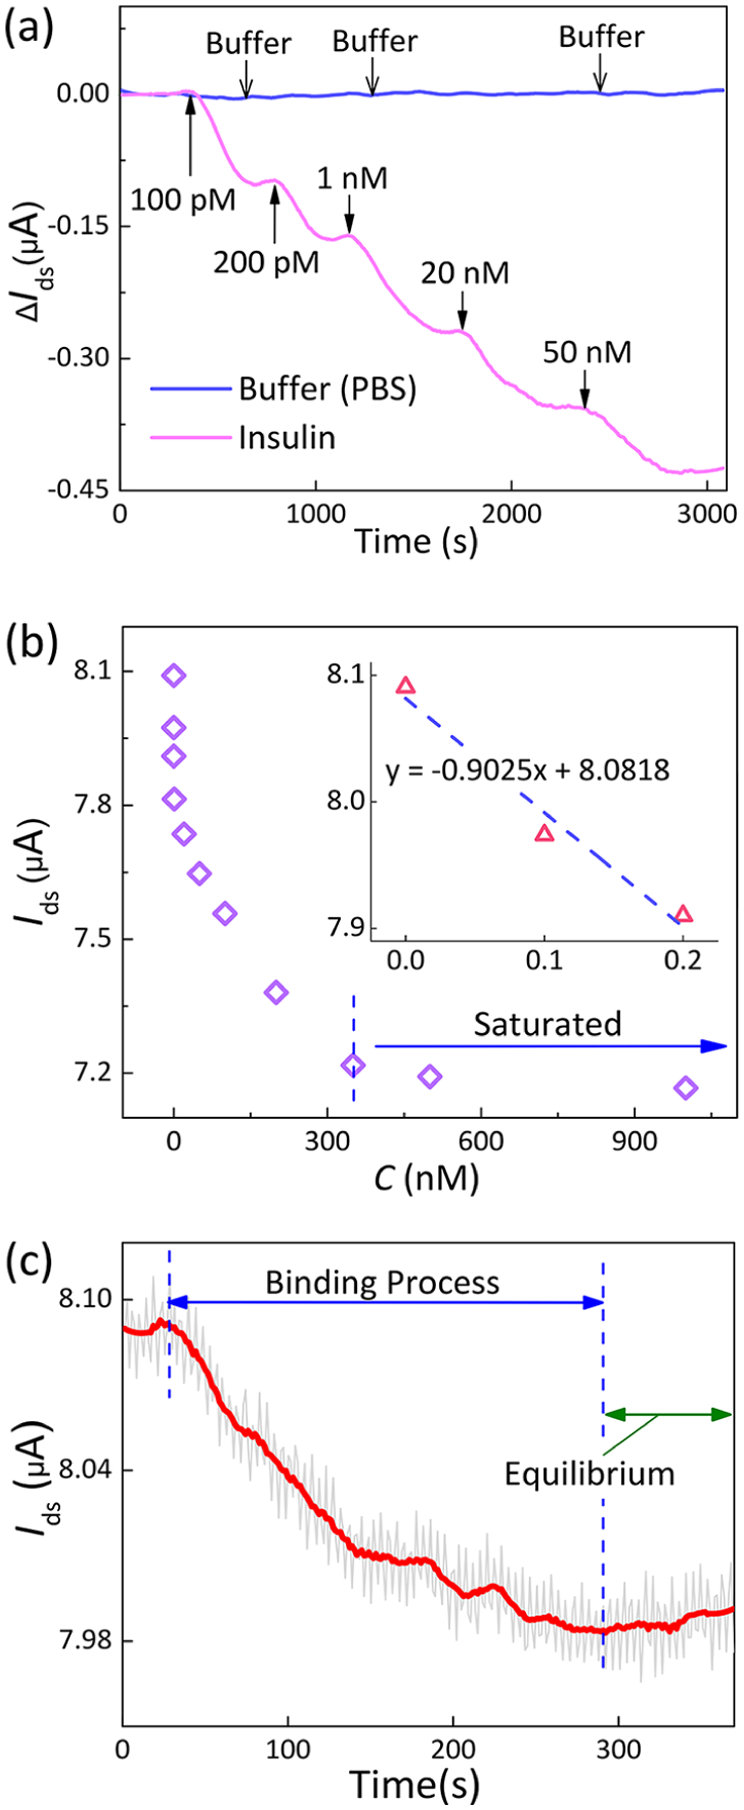
Time-resolved measurement of insulin levels. (a) Real-time monitoring of changes in the insulin concentration. The responses are demonstrated by the changes of the drain–source current Ids. (b) Decrease of the drain–source current with increasing insulin concentrations. Inset: linear fit of the drain–source current with increasing insulin concentrations from 0 to 200 pM. (c) Time course of the drain–source current Ids upon introduction of 100 pM insulin solution. The current decreased from 8.08 μA to reach a steady-state value of 7.97 μA.
Table 1.
Comparison of the Response Characteristics of the Nanosensor and Other Detection Methods
| detection method | LOD | refs |
|---|---|---|
| peroxidase activity | 1000 nM | 7 |
| fluorescence quenching | 500 nM | 6 |
| high-performance liquid chromatography | 258.3 nM | 46 |
| oxidation with carbon electrodes | 30 nM | 45 |
| gold electrode-based electrochemical method | 10 nM | 4 |
| photoluminescence transduction | 10 nM | 8 |
| carbon nanotube-based electrochemical method | 1.34 nM | 47 |
| graphene-based aptameric nanosensor | 35 pM | this work |
To examine the specificity of our nanosensor to insulin over other related analogues that might interfere with the detection of insulin, glucagon and somatostatin, which were secreted by the pancreatic islet alpha and delta cells, respectively, were evaluated as negative control analytes. This is because glucagon [molecular weight (MW): 3.5 kD, PI: 6.2], promoting glucose storage by the liver and together with somatostatin (MW: 1.63 kD, PI: 5.6) regulating the secretion of insulin, share similar physical properties with insulin, which are likely to influence the sensing performance.
The functionalized graphene nanosensor was first exposed to somatostatin solutions prior to the introduction of insulin. The change in Ids, denoted as ΔIds, was recorded throughout the experiment and compared as the response of the aptameric nanosensor to the given solutions. To minimize errors caused by device-to-device nonuniformity, we calculated the time-resolved selective response as the ratio of ΔIds to ΔIds,max (the maximum value of ΔIds). Here, ΔIds = Ids − Ids,PBS, where Ids,PBS is the Ids measured in fresh PBS buffer. With exposure to somatostatin solutions at given levels, the value of ΔIds/ΔIds,max was limited to less than 0.192, indicating that the aptameric nanosensor almost did not respond to the somatostatin solution at tested concentrations. On the contrary, the calculated ΔIds/ΔIds,max value increased significantly and reached 1.0 at 1 μM insulin with stepwise increments in the insulin concentration (Figure 6a).
Figure 6.
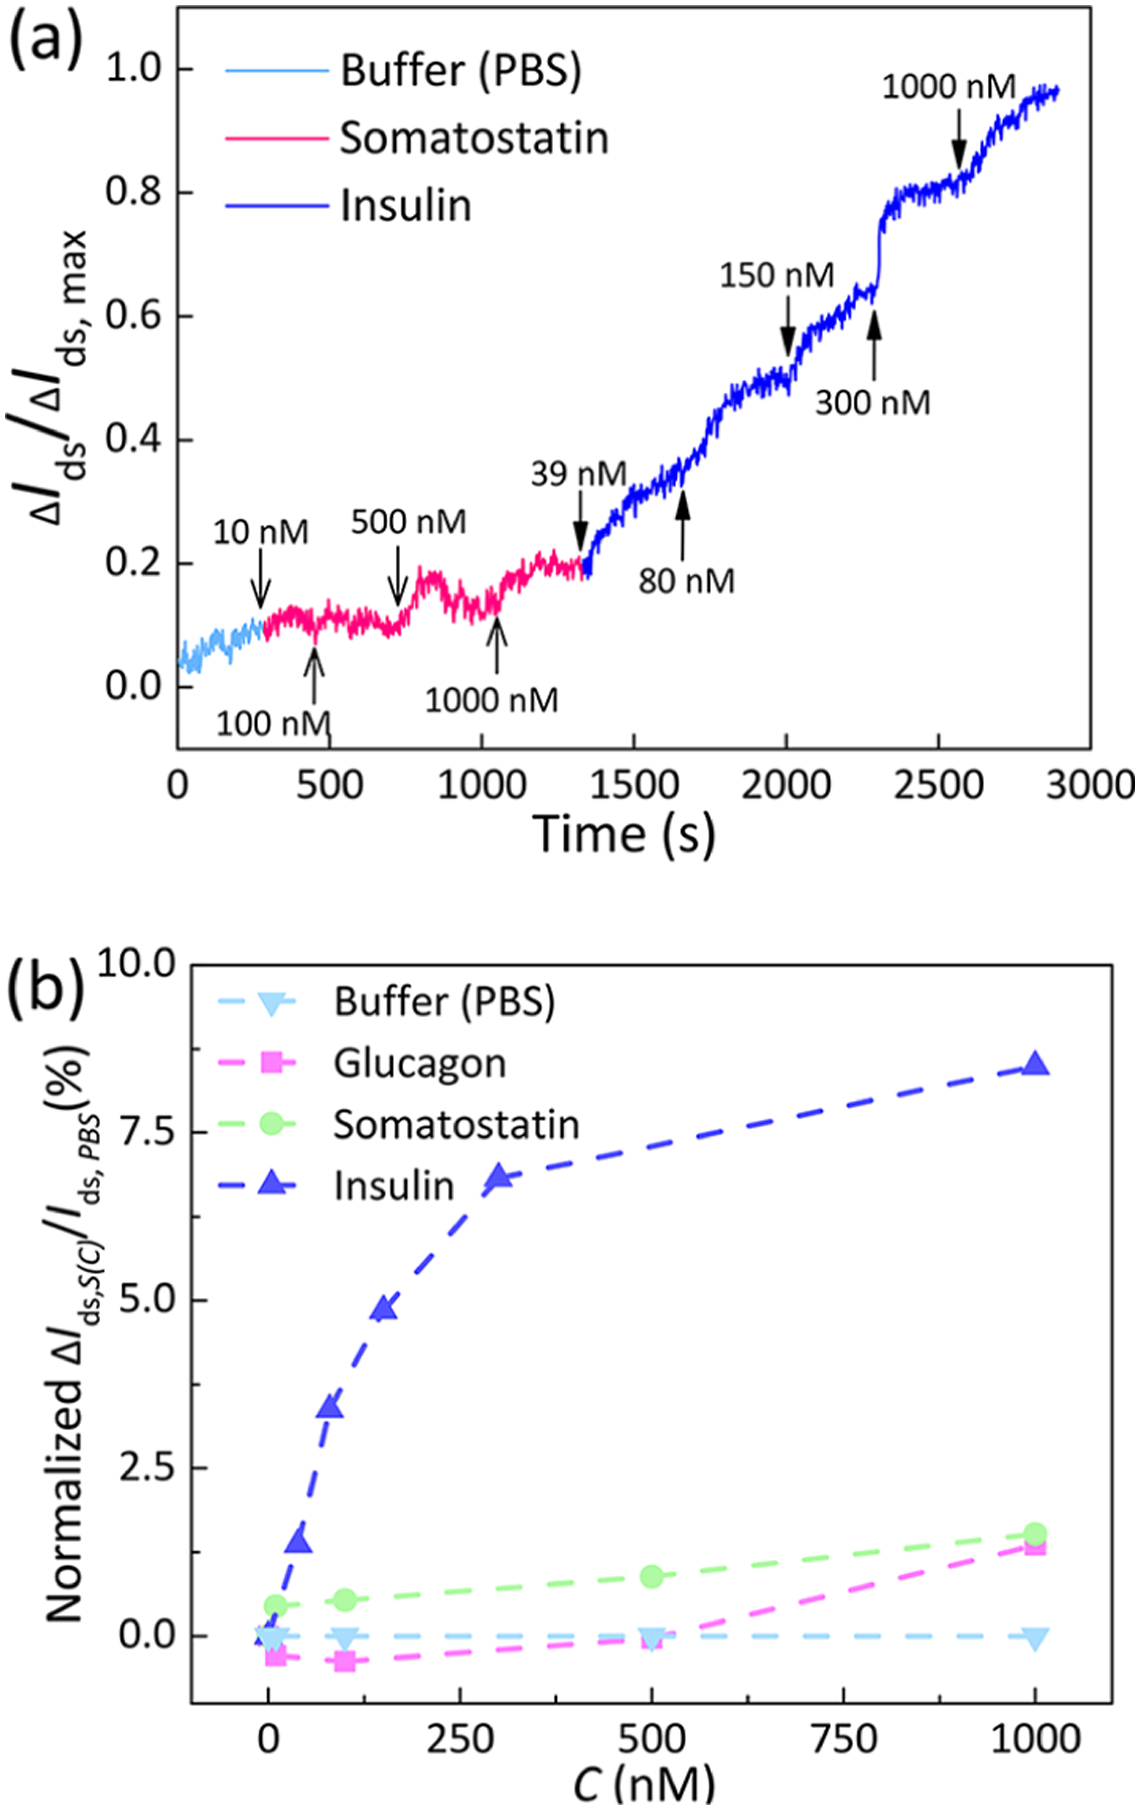
Specificity of the nanosensor to insulin. (a) Time-resolved responses of the IGA3 aptamer-based graphene sensor toward insulin (39, 80, 150, 300 nM, and 1 μM) and somatostatin (10, 100, 500 nM, and 1 μM). (b) Selective responses after exposure to given solutions (somatostatin/glucagon/insulin).
Additionally, a similar real-time monitoring control experiment was conducted with glucagon (Figure S4). The selective responses of the graphene aptameric nanosensor to different concentrations of glucagon, somatostatin, and insulin are shown in Figure 6b. Here, ΔIds,S(C) = Ids,S(C) − Ids,PBS, where Ids,S(C) is the Ids measured at the binding equilibrium for given solutions (insulin/glucagon/somatostatin) at representative tested concentrations. The measured current did not show a significant variation (<1.3%) in the presence of glucagon or somatostatin at concentrations lower than 1 μM, when compared to the response (8.5%) in the presence of equivalent concentrations of insulin alone. These results indicated the ability of the graphene nanosensor to detect insulin with a high selectivity, which was achieved by using the IGA3 aptamer with a sequence that was specific for insulin.
In view of the potential use of our nanosensor for monitoring of insulin secretion from pancreatic islet beta cells, we investigated the validity of the graphene aptameric nanosensor for insulin detection in Krebs–Ringer bicarbonate (KRB) buffer. Considering that various cytokines in serum may influence the glucose-stimulated insulin release assays, KRB buffer is generally used instead of serum-containing media as an islet perfusion medium.48,49 However, different from pure PBS buffer, KRB buffer contains 0.1% bovine serum albumin (BSA), which is a protein used as a nutrient in cell culture. To examine the stability of the graphene nanosensor in KRB buffer, control experiments were carried out by exposing the graphene channel to insulin solutions without biochemical functionalization. The variation in VDirac was not distinguishable with increasing concentrations of insulin (0–960 nM in KRB) (Figure 7a). This suggested that constituents of KRB solutions (Table S1), such as BSA and carbonates, did not impact the sensing performance. After biofunctionalization of PASE and aptamers, the graphene channel was exposed to KRB buffer and insulin solutions of increasing concentrations from 900 pM to 405 nM. After exposure to insulin, the measured VDirac negatively and dramatically shifted by 42 mV, from 0.2 to 0.158 V (Figure 7b), indicating that binding of insulin to IGA3 aptamer also generated n-type doping to graphene even in KRB buffer containing BSA, which was in agreement with the previous result obtained in PBS buffer. Different from the slight decrease in Ids,min, which is related to the ionic strength, observed in experiments using PBS buffer (Figure 4a), the Ids,min was found to increase significantly with the ongoing experiment when using KRB buffer (Figure 7b). On the basis of previous studies,50–54 the nonspecific binding of charged organic molecules, such as BSA, on the graphene surface is likely to play the dominant role in the observed increase of Ids,min. This was supported by the reported experiment, in which the graphene conductance was found to increase slightly with exposure to 100 nM BSA (diluted in PBS buffer) for more than 10 min.31 In control experiments (Figure 7a), the Ids,min was also found to increase from 0.79 to 0.83 μA with increasing dipping time and increasing concentrations of insulin (diluted in KRB buffer) from 0 to 960 nM, which was consistent with the previous study. Thus, it can be concluded that our graphene nanosensor can be used in the monitoring of insulin secretion from pancreatic islet beta cells in vitro.
Figure 7.
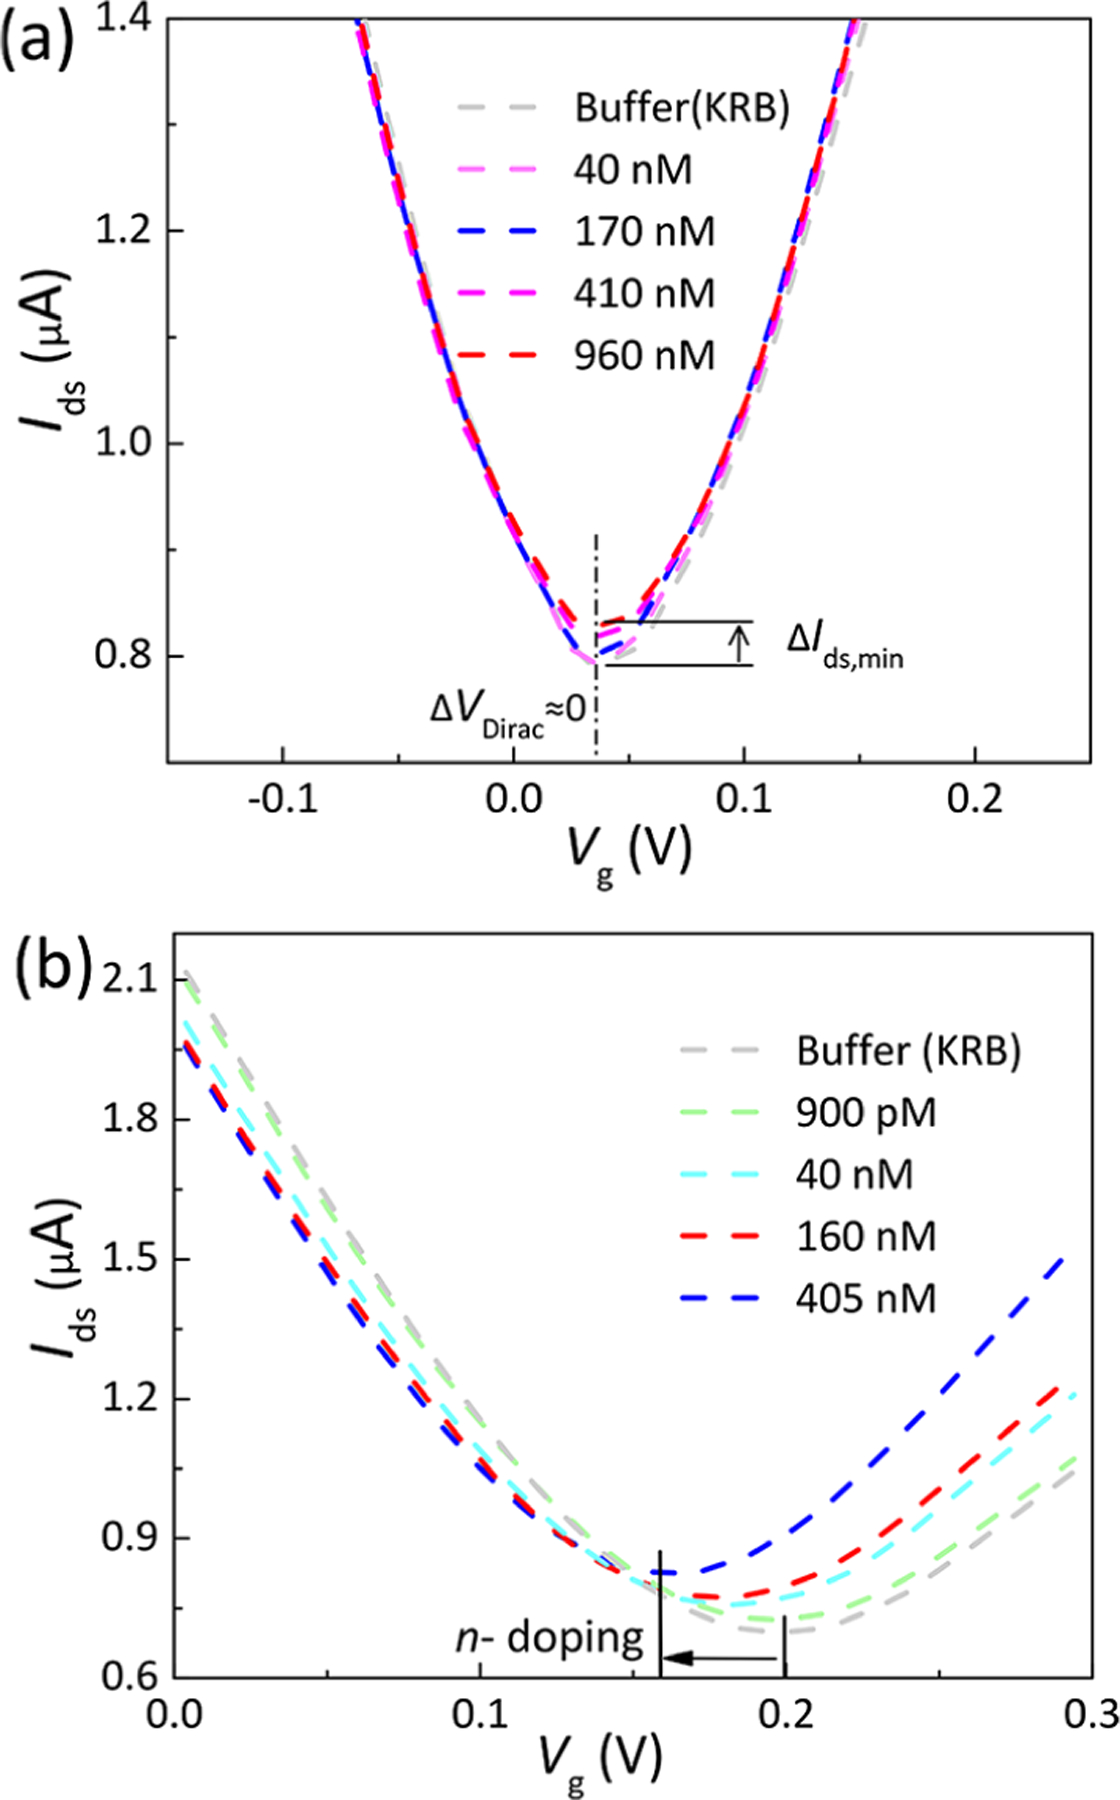
Detection of insulin in KRB buffer. (a) Transfer characteristics of the untreated graphene exposed to insulin solutions, ranging from 40 to 960 nM. (b) Transfer characteristics measured when the aptamer-immobilized graphene exposed to insulin solutions (concentrations ranging from 900 pM to 405 nM). The curve shifted to the left as a result of the increase in the insulin concentration.
4. CONCLUSIONS
In this work, we presented an approach that employed G-quadruplex conformation-switching signaling as the principle for a graphene aptameric nanosensor to real-time monitor insulin. The insulin specifically binds to the surface-immobilized IGA3 aptamer, promoting and stabilizing the formations of both parallel and antiparallel G-quadruplex 2. METHODS and subsequently varying the carrier density in the graphene channel. The resulting change in the electrical conductance of graphene was measured to determine the insulin concentration. Experimental results indicated that the graphene nanosensor used by this approach demonstrated a distinctive ability in quantitative monitoring of insulin levels ranging from 100 pM to 1 μM with a LOD down to 35 pM. Additionally, we investigated the sensing performance and verified the practicability of this graphene nanosensor in KRB buffer. Hence, this approach could be used in glucose-stimulated insulin release assays and holds the potential for timely and accurate prediction of insulin doses for type 1 diabetes (T1D) patients in clinical diagnostics.
Supplementary Material
ACKNOWLEDGMENTS
This work was supported by funding from the National Institutes of Health (grant nos. 1DP3DK101085-01 and 1R33CA196470-01A1) and the National Science Foundation (grant no. ECCS-1509760). Zhuang Hao also gratefully acknowledges a National Scholarship (award number201506120133) from the China Scholarship Council.
Footnotes
Supporting Information
The Supporting Information is available free of charge on the ACS Publications website at DOI: 10.1021/acsami.7b07684.
Device fabrication protocol; characterization of the surface functionalization; results for the time-resolved control experiments using glucagon; and components of KRB buffer (PDF)
The authors declare no competing financial interest.
REFERENCES
- (1).Olansky L; Kennedy L Finger-Stick Glucose Monitoring: Issues of Accuracy and Specificity. Diabetes Care 2010, 33, 948–949. [DOI] [PMC free article] [PubMed] [Google Scholar]
- (2).Vashist S Continuous Glucose Monitoring Systems: A Review. Diagnostics 2013, 3, 385–412. [DOI] [PMC free article] [PubMed] [Google Scholar]
- (3).El-Khatib FH; Russell SJ; Nathan DM; Sutherlin RG; Damiano ER A Bihormonal Closed-Loop Artificial Pancreas for Type 1 Diabetes. Sci. Transl. Med 2010, 2, 27ra27. [DOI] [PMC free article] [PubMed] [Google Scholar]
- (4).Gerasimov JY; Schaefer CS; Yang W; Grout RL; Lai RY Development of an Electrochemical Insulin Sensor Based on the Insulin-Linked Polymorphicregion. Biosens. Bioelectron 2013, 42, 62–68. [DOI] [PubMed] [Google Scholar]
- (5).Gosling JP A Decade of Development in Immunoassay Methodology. Clin. Chem 1990, 36, 1408–1427. [PubMed] [Google Scholar]
- (6).Pu Y; Zhu Z; Han D; Liu H; Liu J; Liao J; Zhang K; Tan W Insulin-Binding Aptamer-Conjugated Graphene Oxide for Insulin Detection. Analyst 2011, 136, 4138–4140. [DOI] [PMC free article] [PubMed] [Google Scholar]
- (7).Kubo I; Eguchi T Study on Electrochemical Insulin Sensing Utilizing a DNA Aptamer-Immobilized Gold Electrode. Materials 2015, 8, 4710–4719. [DOI] [PMC free article] [PubMed] [Google Scholar]
- (8).Cha T-G; Baker BA; Sauffer MD; Salgado J; Jaroch D; Rickus JL; Porterfield DM; Choi JH Optical Nanosensor Architecture for Cell-Signaling Molecules Using DNA Aptamer-Coated Carbon Nanotubes. ACS Nano 2011, 5, 4236–4244. [DOI] [PMC free article] [PubMed] [Google Scholar]
- (9).Vignali DAA Multiplexed Particle-Based Flow Cytometric Assays. J. Immunol. Methods 2000, 243, 243–255. [DOI] [PubMed] [Google Scholar]
- (10).Jayasena SD Aptamers: An Emerging Class of Molecules That Rival Antibodies in Diagnostics. Clin. Chem 1999, 45, 1628–1650. [PubMed] [Google Scholar]
- (11).Bonthuis DJ; Gekle S; Netz RR Dielectric Profile of Interfacial Water and Its Effect on Double-Layer Capacitance. Phys. Rev. Lett 2011, 107, 166102. [DOI] [PubMed] [Google Scholar]
- (12).Chen T-Y; Loan PTK; Hsu C-L; Lee Y-H; Wang JT-W; Wei K-H; Lin C-T; Li L-J Label-Free Detection of DNA Hybridization Using Transistors Based on Cvd Grown Graphene. Biosens. Bioelectron 2013, 41, 103–109. [DOI] [PubMed] [Google Scholar]
- (13).Mailly-Giacchetti B; Hsu A; Wang H; Vinciguerra V; Pappalardo F; Occhipinti L; Guidetti E; Coffa S; Kong J; Palacios T pH Sensing Properties of Graphene Solution-Gated Field-Effect Transistors. J. Appl. Phys 2013, 114, 084505. [Google Scholar]
- (14).Gellert M; Lipsett MN; Davies DR Helix Formation by Guanylic Acid. Proc. Natl. Acad. Sci. U.S.A 1962, 48, 2013–2018. [DOI] [PMC free article] [PubMed] [Google Scholar]
- (15).Jia Y; Cai H; Lin Q Thick-Film Mems Thermoelectric Sensor Fabricated Using a Thermally Assisted Lift-Off Process. J. Micro/Nanolithogr., MEMS, MOEMS 2016, 15, 024501. [Google Scholar]
- (16).Zhu Y; Wang C; Petrone N; Yu J; Nuckolls C; Hone J; Lin Q A Solid Dielectric Gated Graphene Nanosensor in Electrolyte Solutions. Appl. Phys. Lett 2015, 106, 123503. [DOI] [PMC free article] [PubMed] [Google Scholar]
- (17).Zuo G; Zhou X; Huang Q; Fang H; Zhou R Adsorption of Villin Headpiece onto Graphene, Carbon Nanotube, and C60: Effect of Contacting Surface Curvatures on Binding Affinity. J. Phys. Chem. C 2011, 115, 23323–23328. [Google Scholar]
- (18).Alava T; Mann JA; Théodore C; Benitez JJ; Dichtel WR; Parpia JM; Craighead HG Control of the Graphene–Protein Interface Is Required to Preserve Adsorbed Protein Function. Anal. Chem 2013, 85, 2754–2759. [DOI] [PubMed] [Google Scholar]
- (19).Sanger F; Thompson EOP The Amino-Acid Sequence in the Glycyl Chain of Insulin. 1. The Identification of Lower Peptides from Partial Hydrolysates. Biochem. J 1953, 53, 353–366. [DOI] [PMC free article] [PubMed] [Google Scholar]
- (20).Hirayama K; Akashi S; Furuya M; Fukuhara K -i. Rapid Confirmation and Revision of the Primary Structure of Bovine Serum Albumin by Esims and Frit-Fab Lc/Ms. Biochem. Biophys. Res. Commun 1990, 173, 639–646. [DOI] [PubMed] [Google Scholar]
- (21).Lee WC; Lim CHYX; Shi H; Tang LAL; Wang Y; Lim CT; Loh KP Origin of Enhanced Stem Cell Growth and Differentiation on Graphene and Graphene Oxide. ACS Nano 2011, 5, 7334–7341. [DOI] [PubMed] [Google Scholar]
- (22).Zang X; Zhou Q; Chang J; Liu Y; Lin L Graphene and Carbon Nanotube (Cnt) in Mems/Nems Applications. Microelectron. Eng 2015, 132, 192–206. [Google Scholar]
- (23).Ohno Y; Maehashi K; Yamashiro Y; Matsumoto K Electrolyte-Gated Graphene Field-Effect Transistors for Detecting pH and Protein Adsorption. Nano Lett. 2009, 9, 3318–3322. [DOI] [PubMed] [Google Scholar]
- (24).Li S; Zhou Q; Chu W; Zhao W; Zheng J Surface-Enhanced Raman Scattering Behaviour of 4-Mercaptophenyl Boronic Acid on Assembled Silver Nanoparticles. Phys. Chem. Chem. Phys 2015, 17, 17638–17645. [DOI] [PubMed] [Google Scholar]
- (25).Zhu Y; Hao Y; Adogla EA; Yan J; Li D; Xu K; Wang Q; Hone J; Lin Q A Graphene-Based Affinity Nanosensor for Detection of Low-Charge and Low-Molecular-Weight Molecules. Nanoscale 2016, 8, 5815–5819. [DOI] [PMC free article] [PubMed] [Google Scholar]
- (26).An JH; Park SJ; Kwon OS; Bae J; Jang J High-Performance Flexible Graphene Aptasensor for Mercury Detection in Mussels. ACS Nano 2013, 7, 10563–10571. [DOI] [PubMed] [Google Scholar]
- (27).Wang C; Kim J; Zhu Y; Yang J; Lee G-H; Lee S; Yu J; Pei R; Liu G; Nuckolls C; Hone J; Lin Q An Aptameric Graphene Nanosensor for Label-Free Detection of Small-Molecule Biomarkers. Biosens. Bioelectron 2015, 71, 222–229. [DOI] [PMC free article] [PubMed] [Google Scholar]
- (28).Wang C; Li Y; Zhu Y; Zhou X; Lin Q; He M High-κ Solid-Gate Transistor Configured Graphene Biosensor with Fully Integrated Structure and Enhanced Sensitivity. Adv. Funct. Mater 2016, 26, 7668–7678. [Google Scholar]
- (29).Li Y; Wang C; Zhu Y; Zhou X; Xiang Y; He M; Zeng S Fully Integrated Graphene Electronic Biosensor for Label-Free Detection of Lead (Ii) Ion Based on G-Quadruplex Structure-Switching. Biosens. Bioelectron 2017, 89, 758–763. [DOI] [PubMed] [Google Scholar]
- (30).Farid S; Meshik X; Choi M; Mukherjee S; Lan Y; Parikh D; Poduri S; Baterdene U; Huang C-E; Wang YY; Burke P; Dutta M; Stroscio MA Detection of Interferon Gamma Using Graphene and Aptamer Based Fet-Like Electrochemical Biosensor. Biosens. Bioelectron 2015, 71, 294–299. [DOI] [PubMed] [Google Scholar]
- (31).Ohno Y; Maehashi K; Matsumoto K Label-Free Biosensors Based on Aptamer-Modified Graphene Field-Effect Transistors. J. Am. Chem. Soc 2010, 132, 18012–18013. [DOI] [PubMed] [Google Scholar]
- (32).Star A; Tu E; Niemann J; Gabriel J-CP; Joiner CS; Valcke C Label-Free Detection of DNA Hybridization Using Carbon Nanotube Network Field-Effect Transistors. Proc. Natl. Acad. Sci. U.S.A 2006, 103, 921–926. [DOI] [PMC free article] [PubMed] [Google Scholar]
- (33).Reiss H The Fermi Level and the Redox Potential. J. Phys. Chem 1985, 89, 3783–3791. [Google Scholar]
- (34).Xu H; Chen Y; Xu W; Zhang H; Kong J; Dresselhaus MS; Zhang J Modulating the Charge-Transfer Enhancement in Gers Using an Electrical Field under Vacuum and an N/P-Doping Atmosphere. Small 2011, 7, 2945–2952. [DOI] [PubMed] [Google Scholar]
- (35).Pinto H; Markevich A Electronic and Electrochemical Doping of Graphene by Surface Adsorbates. Beilstein J. Nanotechnol 2014, 5, 1842–1848. [DOI] [PMC free article] [PubMed] [Google Scholar]
- (36).Dong X; Shi Y; Huang W; Chen P; Li L-J Electrical Detection of DNA Hybridization with Single-Base Specificity Using Transistors Based on Cvd-Grown Graphene Sheets. Adv. Mater 2010, 22, 1649–1653. [DOI] [PubMed] [Google Scholar]
- (37).Dong X; Fu D; Xu Y; Wei J; Shi Y; Chen P; Li L-J Label-Free Electronic Detection of DNA Using Simple Double-Walled Carbon Nanotube Resistors. J. Phys. Chem. C 2008, 112, 9891–9895. [Google Scholar]
- (38).Wang H; Chen T; Wu S; Chu X; Yu R A Novel Biosensing Strategy for Screening G-Quadruplex Ligands Based on Graphene Oxide Sheets. Biosens. Bioelectron 2012, 34, 88–93. [DOI] [PubMed] [Google Scholar]
- (39).Yoshida W; Mochizuki E; Takase M; Hasegawa H; Morita Y; Yamazaki H; Sode K; Ikebukuro K Selection of DNA Aptamers against Insulin and Construction of an Aptameric Enzyme Subunit for Insulin Sensing. Biosens. Bioelectron 2009, 24, 1116–1120. [DOI] [PubMed] [Google Scholar]
- (40).Manohar S; Mantz AR; Bancroft KE; Hui C-Y; Jagota A; Vezenov DV Peeling Single-Stranded DNA from Graphite Surface to Determine Oligonucleotide Binding Energy by Force Spectroscopy. Nano Lett. 2008, 8, 4365–4372. [DOI] [PMC free article] [PubMed] [Google Scholar]
- (41).Xiao Y; Lubin AA; Heeger AJ; Plaxco KW Label-Free Electronic Detection of Thrombin in Blood Serum by Using an Aptamer-Based Sensor. Angew. Chem 2005, 117, 5592–5595. [DOI] [PubMed] [Google Scholar]
- (42).Kim D-J; Sohn IY; Jung J-H; Yoon OJ; Lee N-E; Park J-S Reduced Graphene Oxide Field-Effect Transistor for Label-Free Femtomolar Protein Detection. Biosens. Bioelectron 2013, 41, 621–626. [DOI] [PubMed] [Google Scholar]
- (43).Cai B; Wang S; Huang L; Ning Y; Zhang Z; Zhang G-J Ultrasensitive Label-Free Detection of Pna–DNA Hybridization by Reduced Graphene Oxide Field-Effect Transistor Biosensor. ACS Nano 2014, 8, 2632–2638. [DOI] [PubMed] [Google Scholar]
- (44).Chen F; Xia J; Ferry DK; Tao N Dielectric Screening Enhanced Performance in Graphene Fet. Nano Lett. 2009, 9, 2571–2574. [DOI] [PubMed] [Google Scholar]
- (45).Zhang M; Mullens C; Gorski W Insulin Oxidation and Determination at Carbon Electrodes. Anal. Chem 2005, 77, 6396–6401. [DOI] [PubMed] [Google Scholar]
- (46).Kunkel A; Günter S; Dette C; Wätzig H Quantitation of Insulin by Capillary Electrophoresis and High-Performance Liquid Chromatography Method Comparison and Validation. J. Chromatogr. A 1997, 781, 445–455. [Google Scholar]
- (47).Wang Y; Li J A Carbon Nanotubes Assisted Strategy for Insulin Detection and Insulin Proteolysis Assay. Anal. Chim. Acta 2009, 650, 49–53. [DOI] [PubMed] [Google Scholar]
- (48).Yamada K; Saito M; Matsuoka H; Inagaki N A Real-Time Method of Imaging Glucose Uptake in Single, Living Mammalian Cells. Nat. Protoc 2007, 2, 753–762. [DOI] [PubMed] [Google Scholar]
- (49).Nie J; Liu X; Lilley BN; Zhang H; Pan YA; Kimball SR; Zhang J; Zhang W; Wang L; Jefferson LS; Sanes JR; Han X; Shi Y Sad-a Kinase Controls Islet β-Cell Size and Function as a Mediator of Mtorc1 Signaling. Proc. Natl. Acad. Sci. U.S.A 2013, 110, 13857–13862. [DOI] [PMC free article] [PubMed] [Google Scholar]
- (50).Kim D-J; Park H-C; Sohn IY; Jung J-H; Yoon OJ; Park J-S; Yoon M-Y; Lee N-E Electrical Graphene Aptasensor for Ultra-Sensitive Detection of Anthrax Toxin with Amplified Signal Transduction. Small 2013, 9, 3352–3360. [DOI] [PubMed] [Google Scholar]
- (51).Kauffman DR; Star A Electronically Monitoring Biological Interactions with Carbon Nanotube Field-Effect Transistors. Chem. Soc. Rev 2008, 37, 1197–1206. [DOI] [PubMed] [Google Scholar]
- (52).Manna AK; Pati SK Tuning the Electronic Structure of Graphene by Molecular Charge Transfer: A Computational Study. Chem.—Asian J 2009, 4, 855–860. [DOI] [PubMed] [Google Scholar]
- (53).Tan Y-W; Zhang Y; Bolotin K; Zhao Y; Adam S; Hwang EH; Sarma SD; Stormer HL; Kim P Measurement of Scattering Rate and Minimum Conductivity in Graphene. Phys. Rev. Lett 2007, 99, 246803. [DOI] [PubMed] [Google Scholar]
- (54).Chen JH; Jang C; Fuhrer MS; Williams ED; Ishigami M Charged Impurity Scattering in Graphene. 2007, arXiv:0708.2408. arXiv preprint. [Google Scholar]
Associated Data
This section collects any data citations, data availability statements, or supplementary materials included in this article.