

Abstract
High-throughput transcriptomic technologies are increasingly being used to screen environmental chemicals in vitro to provide mechanistic context for regulatory testing. The TGx-DDI biomarker is a 64-gene expression profile generated from testing 28 model chemicals or treatments (13 that cause DNA damage and 15 that do not) in human TK6 cells. While the biomarker is very accurate at predicting DNA damage inducing (DDI) potential using the nearest shrunken centroid method, the broad utility of the biomarker using other computational methods is not fully known. Here, we determined the accuracy of the biomarker used with the Running Fisher test, a nonparametric correlation test. In TK6 cells the methods could readily differentiate DDI and non-DDI compounds with balanced accuracies of 87% - 97%, depending on the threshold for determining DDI positives. The methods identified DDI agents in the metabolically competent hepatocyte cell line HepaRG (accuracy = 90%) but not in HepG2 or hepatocytes derived from embryonic stem cells (60% and 80%, respectively). DDI was also accurately classified when the gene expression changes were derived using the nCounter technology (accuracy = 89%). In addition, we found: 1) not all genes contributed equally to the correlations, 2) the minimal overlap in genes between the biomarker and the individual comparisons required for significant positive correlation was 10 genes, but usually was much higher, and 3) different sets of genes in the biomarker can by themselves contribute to the significant correlations. Overall, these results demonstrate the utility of the biomarker to accurately classify DDI agents.
Keywords: genotoxicity, gene expression profiling, biomarker, toxicogenomics, TK6 cells, HepaRG cells
INTRODUCTION
The field of gene expression profiling is witnessing advances in methods that can readily assess partial or full-genome gene expression changes in high throughput formats. These advances have been facilitated by improvements in targeted RNA-Seq technology that allow efficient and relative cost-effective whole transcriptome profiles to be obtained from picograms of mRNA in human cell lysates (Yeakley, Shepard et al. 2017). The EPA ToxCast effort which in the past has screened thousands of chemicals across hundreds of high-throughput in vitro assays (Judson, Houck et al. 2014) is now utilizing high-throughput transcriptomic (HTTr) technologies such as targeted RNA-Seq to substantially expand coverage of biological pathways. Through this effort, full-genome profiles will be generated in human cells for hundreds of chemicals in concentration response format (Harrill J 2018, Shah 2018). HTTr profiling in human cells is expected to complement the current ToxCast screening paradigm by serving as a Tier 0 screens, allowing the coverage of hundreds of targets and pathways simultaneously, increasing the confidence that fewer chemically-induced effects will be overlooked. Predictions from the Tier 0 screens would be followed by targeted Tier 1 assays to uncover the underlying mechanism of action. Although the experimental details have yet to be fully explored, the cost, time, and resource requirements of running gene expression experiments will potentially provide savings over the hundreds of HTS assays currently used in Tier 1 screening.
A critical gap in the application of Tier 0 screening is the availability of validated gene expression signatures (or biomarkers) that have been robustly tested across laboratories, human cell culture models, gene expression platforms, and experimental designs. Transcriptional signatures have been developed to predict organ toxicities including liver cancer (Uehara, Minowa et al. 2011, Doktorova, Yildirimman et al. 2013, Eichner, Kossler et al. 2013, Thomas, Thomas et al. 2013, Yamada, Sumida et al. 2013, Melis, Derks et al. 2014, Romer, Eichner et al. 2014), renal tubular injury (Minowa, Kondo et al. 2012), hepatocellular steatosis (Sahini, Selvaraj et al. 2014), and immunotoxicity (Schmeits, Shao et al. 2015). Fewer examples exist in which transcriptional signatures have been built and validated for prediction of molecular initiating events (MIE) or downstream key events (KE) in adverse outcome pathways (AOP); examples include biomarkers predicting MIEs for rodent liver cancer and steatosis (Oshida, Vasani et al. 2015, Oshida, Vasani et al. 2015, Oshida, Vasani et al. 2015, Oshida, Vasani et al. 2016, Oshida, Waxman et al. 2016) and human endocrine disruption (Ryan, Chorley et al. 2016). Most of these derived signatures are not necessarily useful for screening human cells as the signatures are based on responses in rodent tissues and have not been extensively validated or applied across different testing platforms. Therefore, accepted signatures capturing diverse toxicological targets and effects in human cells that can be used across different gene expression platforms are needed for development of effective Tier 0 HTTr chemical screening approaches.
As genotoxicity testing is a critical part of chemical risk assessment, the Health and Environmental Sciences Institute’s (HESI) Technical Committee for the Application of Genomics to Mechanism-Based Risk Assessment developed a transcriptomic biomarker that can be used to classify chemicals as either DNA damage inducing (DDI) or non-DDI (Goodsaid, Amur et al. 2010, Buick, Moffat et al. 2015, Li, Hyduke et al. 2015, Williams, Buick et al. 2015, Yauk, Buick et al. 2016, Buick, Williams et al. 2017). The TGx-DDI biomarker (originally called the TGx-28.65 biomarker) was developed using DNA microarray expression data and a machine learning algorithm called the nearest shrunken centroid model that identified 64 genes (65 probes) representing pathways associated with early responses to DNA damage. The chemical training set included 28 agents: 13 DDI including both direct and non-direct acting, and 15 non-DDI agents (Li, Hyduke et al. 2015). The DDI compounds covered a broad range of mechanisms including DNA alkylating agents, DNA strand breaking agents, topoisomerase inhibitors, nucleotide antimetabolites, and heavy metals. Initial studies indicated that the TGx-DDI biomarker differentiates DDI and non-DDI compounds with 100% accuracy (Li, Hyduke et al. 2015). In follow up studies, the efficiency of the biomarker for accurately classifying compounds that require metabolic activation was demonstrated using different metabolic activating systems and TK6 cells (Buick, Moffat et al. 2015, Yauk, Buick et al. 2016). In addition, using data from a microarray platform not used in the original studies (Affymetrix) that measured gene expression in the metabolically competent human liver cell line HepaRG, the biomarker correctly classified 15 out of 15 chemicals (Buick, Moffat et al. 2015, Li, Hyduke et al. 2015, Yauk, Buick et al. 2016). More recently, it was demonstrated that the biomarker can accurately classify 45 test agents across a broad set of chemical classes using the nCounter high throughput cell based testing platform and probability analysis, principle components analysis, and two-dimensional clustering (Li, Chen et al. 2017). In particular, the approach could identify most compounds with irrelevant positive in vitro chromosome damage as negative. Lastly, an online tool (https://manticore.niehs.nih.gov/tgclassifier/) has been developed that uses the TGx-DDI biomarker for predicting the DDI potential of chemicals tested by different microarray platforms in human cells (Jackson, Yang et al. 2017). All studies to date indicate that the TGx-DDI biomarker used in conjunction with a number of computational methods including the nearest shrunken centroid model is a promising tool that could complement regulatory genotoxicity testing. The broad utility of the biomarker used in conjunction with other computational methods is not fully known.
In previous studies, we developed methods for the accurate identification of estrogen receptor (ER) agonists and antagonists in microarray experiments in human cells (Ryan, Chorley et al. 2016). Our approach can easily allow the screening of large numbers of microarray comparisons from chemically-treated cells and can simultaneously identify molecular targets using multiple biomarkers. In the present study, we assessed whether the computational methods used in the study could accurately classify chemical-induced DNA damage using the TGx-DDI biomarker. We found that the TGx-DDI biomarker can accurately classify DNA damage using a pattern matching correlation analysis. Our approach could not only accurately classify DNA damage in TK6 cells but in HepaRG cells as well. The approach was accurate independent of the platform used to measure gene expression. Furthermore, we examined the contribution of individual genes in the biomarker to the correlation p-values.
METHODS
Strategy for using the TGx-DDI biomarker to identify chemicals that damage DNA.
Our method for identification of chemicals that cause DNA damage is outlined in Figure 1A and required the following: (a) a list of TGx-DDI biomarker genes with associated fold-change values, (b) gene expression profiles of statistically filtered genes (also called biosets), and (c) a method to compare the biomarker to each bioset. These components are described below.
Figure 1. Strategy for using the TGx-DDI biomarker to identify chemicals that damage DNA.
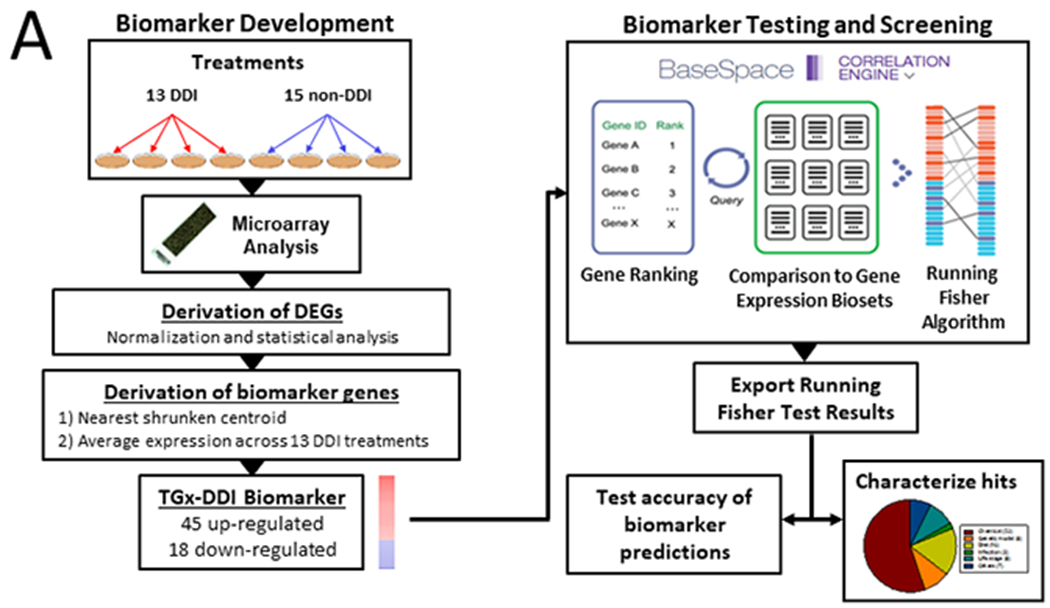
A. Left, biomarker development. Experiments used to identify DDI genes included 13 DDI treatments and 15 non-DDI treatments in TK6 cells. Biomarker genes were identified by nearest shrunken centroid method as described in the Methods. The average fold-change for the 63 genes was derived across the DDI treatments. The resultant biomarker consisted of 45 upregulated genes and 18 down regulated genes. (Right) Biomarker testing and screening. The biomarker was imported into the BSCE environment, in which internal protocols rank-ordered the genes based on their average fold-change. Comparison of the biomarker to each bioset was carried out using a pair-wise rank-based algorithm (the Running Fisher test). The results of the test, including the direction of correlation and p-value for the evaluated biosets, were exported and used to populate a master table containing bioset experimental details. A test of the accuracy of the biomarker classifications was carried out using treatments that have known effects on DNA damage. The figure was adapted from (Ryan, Chorley et al. 2016).
B. BSCE output of the comparison between the biomarker and a bioset. The biomarker was compared to TK6 cells treated with benzo[a]pyrene at 39.63 μM (dose 3; D3) for 4 hrs (from (Yauk, Buick et al. 2016)). The comparison shows the number of overlapping genes and the overlap p-value (lower left). The overlap p-value is calculated as described in the text.
(a) The TGx-DDI biomarker is a list of differentially expressed genes that were consistently increased or decreased after exposure to 13 DDI agents but not non-DDI agents in TK6 cells (Li, Hyduke et al. 2015). The biomarker includes fold-change values associated with each gene, derived from the average differences in expression across the 13 DDI agents.
(b) Statistically filtered gene lists were analyzed in a commercially available gene expression database called BaseSpace Correlation Engine (BSCE) (https://www.illumina.com/products/by-type/informatics-products/basespace-correlation-engine.html; formally NextBio).
(c) The TGx-DDI gene biomarker was uploaded to the BSCE database and compared to the biosets used in the present analysis to assess correlation using the Running Fisher algorithm (Kupershmidt, Su et al. 2010). The method allows an assessment of the overlap in regulated genes between the biomarker and each bioset, and evaluates whether those overlapping genes are regulated in a similar or opposite manner. Biosets that exhibit significant positive correlation with the biomarker would be predicted to reflect DNA damage in those cells. Results of the comparisons were exported and used to populate files containing information about each bioset as well as the Running Fisher test p-value and direction of correlation. Test results were used to determine the accuracy of classifications as described below. We have previously used this analysis strategy to accurately identify chemicals that activate or suppress transcription factors (AhR, CAR, Nrf2, PPARα, STAT5b) (Oshida, Vasani et al. 2015, Oshida, Vasani et al. 2015, Oshida, Vasani et al. 2015, Oshida, Vasani et al. 2016, Oshida, Waxman et al. 2016) in the mouse liver and ERα in the human breast cancer cell line, MCF-7 (Ryan, Chorley et al. 2016). Information about the biosets used in the present study are found in Supplemental File 1.
Derivation of fold-change values of genes in the TGx-DDI biomarker.
In the Li et al. study (Li, Hyduke et al. 2015), TK6 cells were exposed to 12 chemicals (5-fluorouracil, cytosine arabinoside, bleomycin, camptothecin, cisplatin, etoposide, hydrogen peroxide, hydroxyurea, methotrexate, methyl methanesulfonate, potassium chromate (VI), sodium arsenite) or exposed to γ-rays under conditions known to induce DNA damage. Cells were also treated with 15 agents under conditions that did not induce DNA damage. In this study, all treatments were carried out in the absence of rat liver S9 extracts. The 64 genes in the biomarker were identified by the nearest shrunken centroids method that accurately classified the DDI and non-DDI treatments. The resulting biomarker TGx-DDI was originally called TGx-28.65 based on the fact that there were 28 chemicals used in the analysis and 65 probes representing 64 genes identified as predictive of DDI abilities. Due to revisions in the gene annotation and differences between the 4x44k and 8x60k Agilent platforms, USP41 (not present on the 8x60k platform) was removed from the TGx-28.65 biomarker in some studies and is not used herein. Thus, within our study the TGx-DDI biomarker comprises 63 genes. Biomarker fold-change values were derived by averaging expression across the 13 DDI biosets. Fold-change values and gene names were imported into BSCE. The 63 gene biomarker and fold-change values are found in Supplemental File 1.
Identification of differentially expressed genes in microarray datasets.
Processed signal intensities were analyzed using the microarray analysis of variance (MAANOVA) library (Wu 2003) Differentially expressed genes (DEGs) were identified using the Fs statistic (Cui, Hwang et al. 2005) a shrinkage estimator used for the probe-specific variance components. The associated p-values for this test statistic were estimated using the permutation method (30,000 permutations with residual shuffling) and p-values were then adjusted for multiple comparisons using the false discovery rate (FDR) approach (Benjamini 1995). The least-squares means (Searle 1980) were used to estimate the fold changes. The cutoffs used in all gene lists were ≥ |1.2| fold change and unadjusted p < 0.05. All of the microarray studies considered in the present study were carried out under standard conditions which measure cytotoxicity to ensure that excessive cytotoxicity does not occur.
Comparison of the TGx-DDI biomarker to biosets in BSCE.
The strategy for comparison of a biomarker to collections of biosets has been described in previous studies (Oshida, Vasani et al. 2015, Oshida, Vasani et al. 2015, Oshida, Vasani et al. 2015). Using the Running Fisher algorithm, the biomarker was compared to each bioset in BSCE. The number of overlapping genes, p-value, and direction of the correlation were exported. P-values were converted to –Log(p-value)s and those with negative correlations were converted to negative numbers. The final list of –Log(p-value)s was used to populate the table containing the study characteristics of each bioset.
Determination of the predictive accuracy of the TGx-DDI biomarker in TK6 cells.
Predictive accuracy in TK6 cells was carried out using four datasets. Biosets were derived from treatments consisting of 15 chemicals carried out as described (Buick, Moffat et al. 2015, Yauk, Buick et al. 2016, Buick, Williams et al. 2017). Additional biosets came from Kuehner et al. (Kuehner, Holzmann et al. 2013) (Gene Expression Omnibus Accession number, GSE41296) in which TK6 cells were treated with methyl methanesulfonate, ethyl methanesulfonate, or formaldehyde for 24 hrs. All chemicals were tested at more than one concentration. All statistically filtered gene lists were examined for statistically significant correlation to the biomarker genes using the Running Fisher algorithm in BSCE. Prior studies with gene expression biomarkers for xenobiotic receptors showed that a cutoff p-value ≤ 10−4 after a Benjamini Hochberg correction of α = 0.001 resulted in a balanced accuracy for activation of 95%, 97% and 98% for AhR, CAR and PPARα, respectively (Oshida, Vasani et al. 2015, Oshida, Vasani et al. 2015, Oshida, Vasani et al. 2015). Each concentration for the chemicals used in the analysis was classified as genotoxic or nongenotoxic based on the micronucleus test (Yauk, Buick et al. 2016) or comet assay (Kuehner, Holzmann et al. 2013). The values for predictive accuracy were calculated as follows: sensitivity (true positive rate) = TP/(TP+FN); specificity (true negative rate) = TN/(FP+TN); positive predictive value (PPV) = TP/(TP+FP); negative predictive value (NPV) = TN/(TN+FN); balanced accuracy = (sensitivity+specificity)/2.
Determination of the predictive accuracy of the TGx-DDI biomarker in hepatocytes.
The biomarker was compared to biosets from Doktorova et al. (Doktorova, Yildirimman et al. 2013). In this study, human hepatoma-derived HepaRG cells, HepG2 cells, and embryonic stem cell (ESC)-derived hepatocytes were exposed to 15 prototypical compounds belonging to three toxic classes: (i) genotoxic carcinogens [aflatoxin B1 (AFB1); 4-methylnitrosamino)-3-pyridyl)-1-butanone (NNK); 2-nitrofluorene (2NF); benzo[a]pyrene (BaP); cyclophosphamide (CYCLO)], (ii) nongenotoxic carcinogens [methapyrilene hydrochloride (MPH); piperonylbutoxide (PIPB), WY-14,643 (WY), phenobarbital sodium (PB), 12-O-tetradecanoylphorbol-13-acetate (TPA)]; and (iii) noncarcinogens [nifedipine (NIF); clonidine (CND); D-mannitol (MAN); tolbutamide (TOL); diclofenac sodium (SDF)] for 72 hr. Gene expression changes were derived by standard protocols in BSCE as described above. The 45 biosets from this study were compared to the biomarker in BSCE to determine significance of the correlations.
Determination of the relationships between expression of the biomarker genes and correlation p-values.
Statistically significant fold-change values for each gene in the biomarker were derived from microarray comparisons in all human biosets and exported from BSCE. The fold-change values were used to populate the table containing biomarker correlation p-values and information about the bioset. The gene expression values for the 36 biosets with -Log(p-value) ≥ 4 and that are known positives for DDI examined in this study were examined for the number of times each gene was changing in the same direction as the biomarker gene (either increased expression for induced biomarker genes or decreased expression for repressed biomarker genes).
RESULTS
Strategy for using the TGx-DDI biomarker to identify DNA damaging chemicals.
Figure 1A outlines the methods for creation of the biomarker, testing the predictive accuracy and use in screening. The biomarker was derived as detailed in the Methods by examining gene expression changes after exposure to 13 DDI treatments or 15 non-DDI treatments in the absence of treatment by rat liver S9 extracts. Nearest shrunken centroid methods were used to identify genes that predicted DDI. The resultant biomarker of 45 upregulated genes and 18 down regulated genes and associated fold-change values were imported into BSCE in which comparisons were made between the biomarker and all microarray comparisons (biosets) in the database. (It should be noted that a bioset refers to gene expression changes from pair-wise comparisons between a chemical treatment (one dose, one time) vs. a corresponding control.)
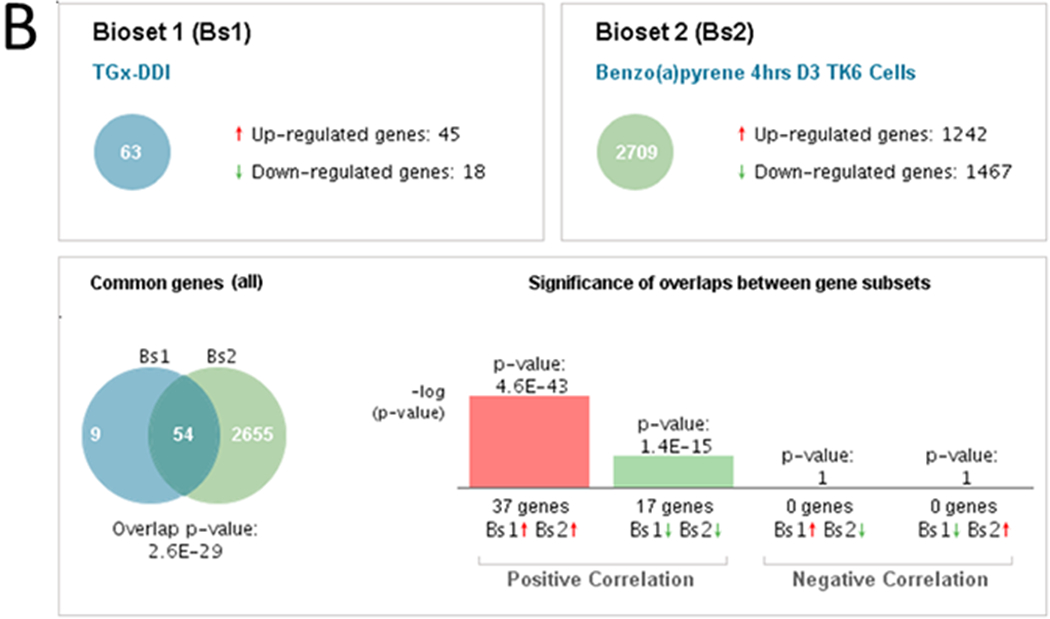
An example of how the significance of the correlation is derived between the biomarker and a list of differentially regulated genes is shown in Figure 1B. In this example, the biomarker is compared to the bioset from TK6 cells treated with benzo[a]pyrene in the presence of rat liver microsomal S9 fraction (for metabolic activation) at 39.63 μM for 4 hrs (Yauk, Buick et al. 2016). The number of differentially expressed overlapping genes in this case was 54 genes. The genes in the biomarker and the bioset were divided into those that were induced or repressed. To determine if the correlation between the two is positive, the induced genes in bioset 1 (the TGx-DDI biomarker) were compared to the induced genes in bioset 2, and the repressed genes in bioset 1 were compared to the repressed genes in bioset 2. In this comparison, there were either 37 or 17 genes that exhibited induction or repression in both gene lists, respectively. The Running Fisher test was used to determine the significance of the overlap for the induced genes (p-value = 1.6E-43) or repressed genes (p-value = 1.4E-15). The methods also assess whether there is any significant negative correlation by comparing induced genes in bioset 1 to the repressed genes in bioset 2 and comparing the repressed genes in bioset 1 to the induced genes in bioset 2. In the present case, there were no negatively correlated genes that overlap in either of the comparisons resulting in p-values = 1. Finally, the overall score was computed by summing all 4 subset pair scores (after converting the p-values to -Log(p-value)s). The sign of the sum determines whether the two biosets are positively or negatively correlated. The final overlap p-value computed is the average of those derived from the positive correlation tests subtracting the average of those derived from the negative correlation tests (i.e. in -Log(p-value)s: (~42.337+~14.854)/2 + (0+0)/2 ~ 28.6 or p-value = 2.6E-29). An in-depth description of the methods used in the analysis is found in (Kupershmidt, Su et al. 2010).
The biomarker accurately classifies DDI in TK6 cells.
To determine if our microarray analysis approach could be used as an alternative Tier 0 screening model to identify DDI compounds, a classification analysis was performed on 59 biosets from TK6 cells that were treated with 18 chemicals known to induce DNA damage. The biosets came from 4 studies (Kuehner, Holzmann et al. 2013, Buick, Moffat et al. 2015, Yauk, Buick et al. 2016, Buick, Williams et al. 2017). In the Buick et al. and Yauk et al. studies, the cells were treated at 2 or 3 concentrations for 4, 7, or 8 hrs and all of the chemicals except cisplatin were used to treat cells in the presence of S9 extract. In the Kuehner et al. study, cells were treated at three concentrations for 24 hrs. Initial classification of activation used a threshold p-value ≤ 1E-4. (See Methods for rationale for selection of the threshold.) We assessed multiple concentrations of chemicals collectively, and assigned any positive call at any concentration of a single chemical as a positive ‘overall’ call for DDI potential (else called negative). Assessments were carried out with -Log(p-value) cutoffs of either 4 or 3. The -Log(p-value) cutoff of 4 has been useful to minimize both false positives and false negatives in prior screens (e.g., Oshida et al., 2018). A -Log(p-value) cutoff of 3 would potentially decrease false negatives at the expense of increasing false positives. The 18 chemicals included 15 true positives and 3 true negatives. Using all data and a cutoff of 4, the biomarker had a sensitivity of 80% and a specificity of 100%, with a balanced accuracy of 90% (Table I, columns 2 and 3; Figure 2), based on comparison to the apical endpoints (author calls for micronucleus frequency and DNA strand breaks by the comet assay) in both studies. There were no false positives but three false negatives (disperse orange, 2-nitrofluorene and dimethylnitrosamine). When the -Log(p-value) threshold was lowered to 3, there was no increase in the number of false positives and the number of false negatives dropped to one. The resulting balanced accuracy increased to 97%. The one false negative was disperse orange (high dose; -Log(p-value) = 0.39). This compound was found to be a weak DDI agent that was marginally significant in a screen using the nearest shrunken centroid method (Buick et al., 2017). Overall, evaluation of the predictive power of the biomarker resulted in excellent balanced accuracies to detect potential to cause DNA damage.
Table I.
Classification analysis with the TGx-DDI biomarker in four cell lines derived from microarray or nCounter gene expression data1
| Cell Model | TK6 | TK6 | HepG2 | ESC-Hep | HepaRG | TK6 | TK62 |
|---|---|---|---|---|---|---|---|
| Figure | 2 | 2 | 3 | 3 | 3 | 4 | NA |
| Number of chemicals | 18 | 18 | 15 | 15 | 15 | 45 | 45 |
| Threshold -Log(p-value | 4 | 3 | 4 | 4 | 4 | 34 | NA |
| Gene expression platform | Agilent and Affymetrix Microarrays | Agilent and Affymetrix Microarrays | Affymetrix Microarray | Affymetrix Microarray | Affymetrix Microarray | nCounter | nCounter |
| True positives | 12 | 14 | 1 | 3 | 4 | 8 | 8 |
| True negatives | 3 | 3 | 10 | 10 | 10 | 29 | 27 |
| False positives | 0 | 0 | 0 | 0 | 0 | 8 | 10 |
| False negatives | 3 | 1 | 4 | 2 | 1 | 0 | 0 |
| Sensitivity | 0.8 | 0.93 | 0.2 | 0.6 | 0.8 | 1 | 1 |
| Specificity | 1 | 1 | 1 | 1 | 1 | 0.78 | 0.73 |
| Positive predictive value | 1 | 1 | 1 | 1 | 1 | 0.5 | 0.44 |
| Negative predictive value | 0.5 | 0.75 | 0.71 | 0.83 | 0.91 | 1 | 1 |
| Balanced accuracy | 0.9 | 0.97 | 0.6 | 0.8 | 0.9 | 0.89 | 0.86 |
Each column provides details of the individual tests for accuracy of the biomarker.
Analysis of the results of the Li et al. (Li, Chen et al. 2017) study which used three methods to classify chemicals: probability analysis, principle components analysis, and two-dimensional clustering. NA, not applicable.
Figure 2. The biomarker accurately predicts DDI in TK6 cells.
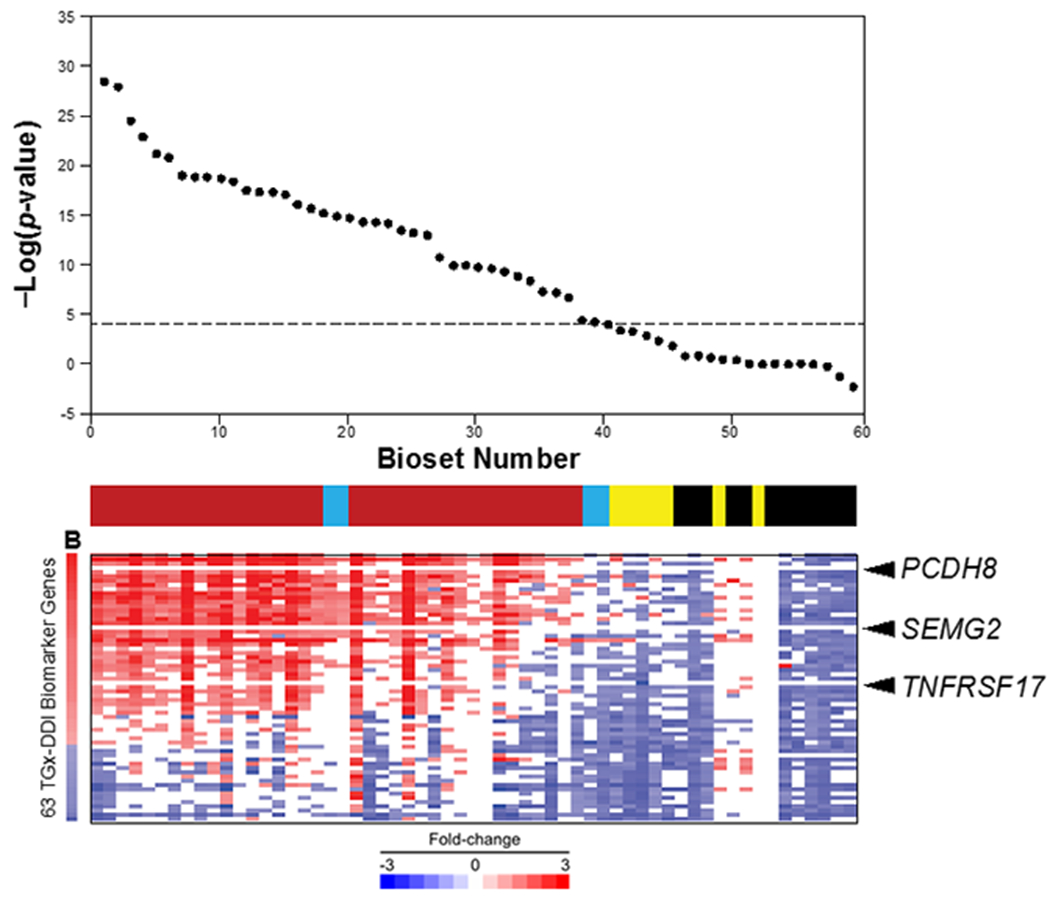
A total of 18 chemicals in 59 biosets with known genotoxicity were examined for correlation to the biomarker. The chemicals were rank ordered based on −log(P value)s. True positives (red), true negatives (green), false positives (blue), and false negatives (yellow) are indicated. The dotted line denotes the biomarker cutoff of p-value = 1E−4. Expression of the biomarker genes in each bioset is shown below. (Arrowheads) Genes that are rarely altered in positively correlating biosets.
Using the biomarker to classify DDI potential in human hepatocytes.
We determined the utility of our approach to identify DDI agents in human hepatocyte cell lines. Doktorova et al. (Doktorova, Yildirimman et al. 2013) measured gene expression by Affymetrix microarrays after 72 hrs of exposure to 15 chemicals in three hepatocyte cell lines. HepaRG cells are considered to be more metabolically competent than HepG2 cells or embryonic stem cell-derived hepatocytes (ESC-derived hepatocytes). Each of the 45 biosets were compared to the biomarker, and the results are shown in Figure 3. Predictive accuracies were determined for each cell line (Table 1, columns 4–6). The 15 chemicals included 5 true positives and 10 true negatives. HepG2 and ESC-derived hepatocytes had balanced accuracies of 60% and 80%, respectively, while HepaRG cells had a balanced accuracy of 90%. There was one false negative in HepaRG cells (2-nitrofluorene) and no false positives. Thus, our approach appears to be useful to identify DDI agents in HepaRG cells.
Figure 3. Using the biomarker to classify DDI potential in human hepatocyte cells.
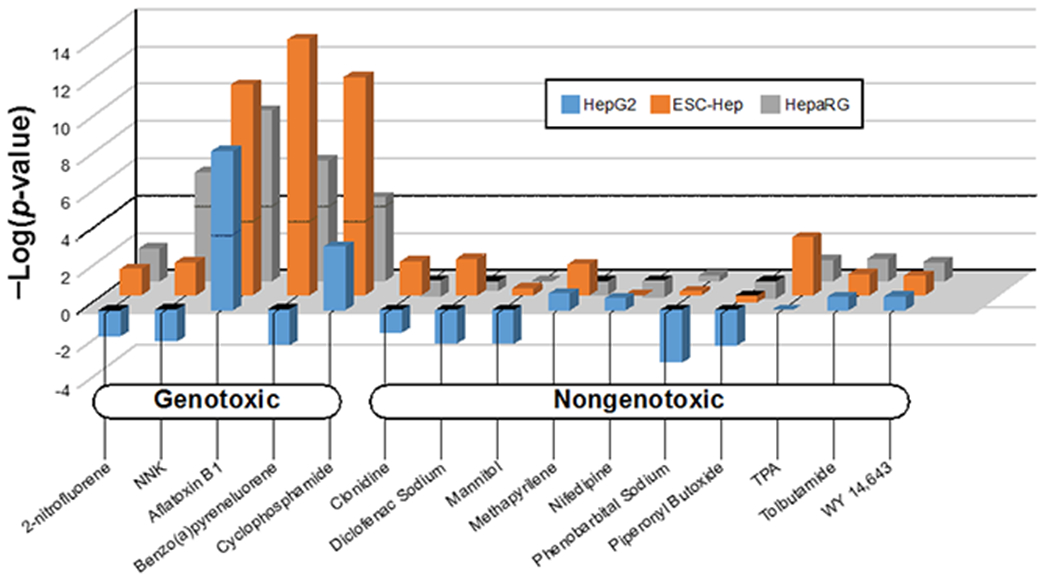
The biomarker was compared to the microarray comparisons derived from (Doktorova, Yildirimman et al. 2013) in which HepG2, hepatocytes derived from embryonic stem cells (ESC-Hep), or HepaRG cells were exposed to one dose of either 5 DDI or 10 non-DDI agents for 48 hours. NNK, 4-methylnitrosamino)-3-pyridyl)-1-butanone; TPA, 12-O-tetradecanoylphorbol-13-acetate.
Predicting DDI using nCounter technology.
One vision of future screening would be to analyze targeted sets of genes by methods that would allow increased throughput and lower cost. As a case study, we determined if gene expression analysis using the nCounter technology coupled with our methods would allow for identification of DDI chemicals. The nCounter technology uses molecular “barcodes” and single molecule imaging for the direct hybridization and detection of transcripts in a single reaction. We utilized gene expression data derived in a recent study in which TK6 cells were exposed to 45 chemicals for 4 hrs followed by analysis using nCounter (Li, Chen et al. 2017). (The list of chemicals is found in Supplemental File 1.) As part of this study, the original training set of 27 treatments (26 chemicals and γ-rays) used to derive the TGx-DDI biomarker (Li, Hyduke et al. 2015) were examined for gene expression effects in TK6 cells using nCounter. The 27 chemicals included 13 true positives and 14 true negatives. In contrast to microarray data, the fold change of each gene was derived in the absence of a statistical filter, and thus, all genes were associated with a fold-change value. When the training set of treatments were rank-ordered based on -Log(p-value), there was a separation between all of the DDI conditions from all of the non-DDI conditions between -Log(p-value)s of ~33 and ~35 (Figure 4A). Using a threshold of 34, the test was 100% accurate for the training set chemicals.
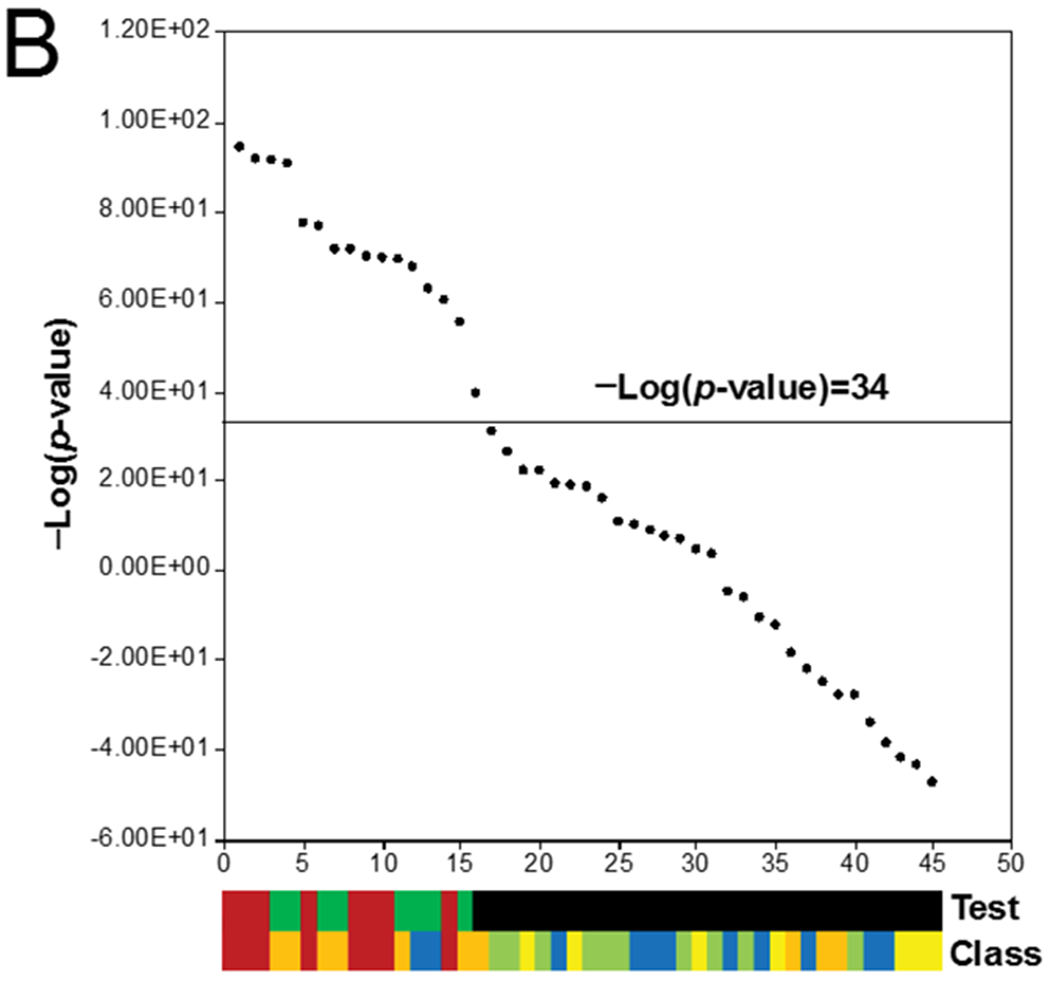
Figure 4. Predicting DDI using nCounter technology.
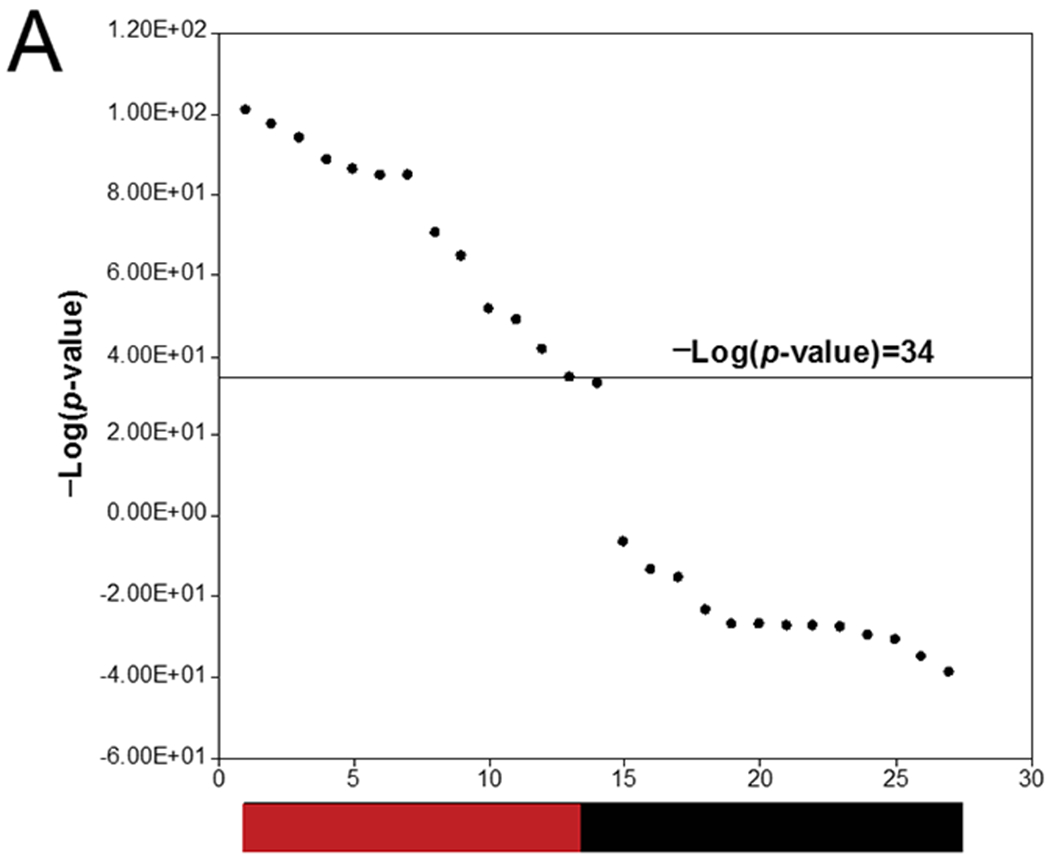
A. The training set. TK6 cells were treated with 27 known DDI or non-DDI chemicals for 4 hrs and gene expression was analyzed by nCounter. Data came from the study described in Li et al. (Li, Chen et al. 2017). Each profile was compared to the TGx-DDI biomarker, and the -log(p-value)s of the correlations were rank ordered. A -Log(p-value) = 34 was 100% accurate. The color bar shows true positives (red) and true negatives (green).
B. The test set. TK6 cells were treated with 45 known DDI or non-DDI chemicals for 4 hrs and gene expression was analyzed by nCounter. Each comparison was compared to the TGx-DDI biomarker and the -log(p-value)s of the correlations were rank ordered. Top color bar: true positives (red), true negatives (green), and false positives (blue) are indicated. Bottom color bar of different classes of chemicals tested (described in text): class 1 (red), class 2 (orange), class 3 (yellow), class 4 (green), class 5 (blue).
We then examined the 45 chemical test set with a threshold of -Log(p-value) = 34. In the Li et al. study (Li, Chen et al. 2017) the chemicals fell into 5 classes including class 1 (DDI agents that interact directly with DNA), class 2 (DDI agents that interact indirectly with DNA and include topoisomerase inhibitors and antimetabolites), class 3 (agents that interact indirectly with DNA including effects on cell fate), class 4 (non-DDI chemicals), and class 5 (chemicals with irrelevant positive effects). (See (Li, Chen et al. 2017) for a complete description of the 5 classes.) The authors classified the chemicals as 8 true positives and 37 true negatives. Our classification test revealed that there were no false negatives and and out of the 37 true negatives, there were 8 false positives resulting in a sensitivity of 100%, a specificity of 78% and a balanced accuracy of 89% (Figure 4B; Table I, column 7). All of the class 1 chemicals were called DDI (bleomycin, busulfan, chlorambucil, ethyl methanesulfonate, ethyl-N-nitrosourea, hydroquinone, mitomycin C, nitrogen mustard), and all of the class 4 chemicals were called non-DDI. The false positives in our analysis included 6 chemicals in class 2 (5-fluorouracil, 6-thioguanine, ciprofloxacin, doxorubicin, genistein, topotecan) and two chemicals in class 5 (exemastan, olmesartan).
We compared our classifications with those of the Li et al. (Li, Chen et al. 2017) study, which used a different set of computational techniques. In their classification test starting with the 8 true positives and 37 true negatives, there were no false negatives and 10 false positives resulting in a balanced accuracy of 86% (Table 1, column 8). Their false positives overlapped with those in our test and included chemicals in class 2 (5-fluorouracil 6-thioguanine, ciprofloxacin, doxorubicin, genistein, thiopurine, topotecan), class 3 (dasatinib, diethylstilbestrol) and class 5 (exemastan). In summary, the results indicate that the biomarker and our computational methods are suitable for high throughput screening using nCounter-derived gene expression data.
Contribution of individual genes in the biomarker to classification of DDI agents.
An initial examination of the heatmaps shown above indicated that not all of the genes in the biomarker were consistently altered in expression in biosets that yielded positive calls (see Figure 2, arrowheads as examples). To determine the contribution of each gene to the correlation between the biomarker and individual biosets, we examined we examined 36 high confidence DDI biosets that represented chemical vs. control comparisons with a -Log(p-value) ≥ 4 and were true positives. Out of the 36 biosets, we assessed the number of times each gene was altered in the expected direction (Figure 5). There was a rough relationship between the fold-change of the gene and the number of times that gene was altered. The genes that exhibited the greatest frequency of alteration generally had the greatest fold-change values. Positively-regulated genes were, in general, more often altered than those that were negatively-regulated. All but one of the negatively-regulated genes were altered less than 30 times in the 36 biosets.
Figure 5. Contribution of individual genes in the biomarker to the correlations.
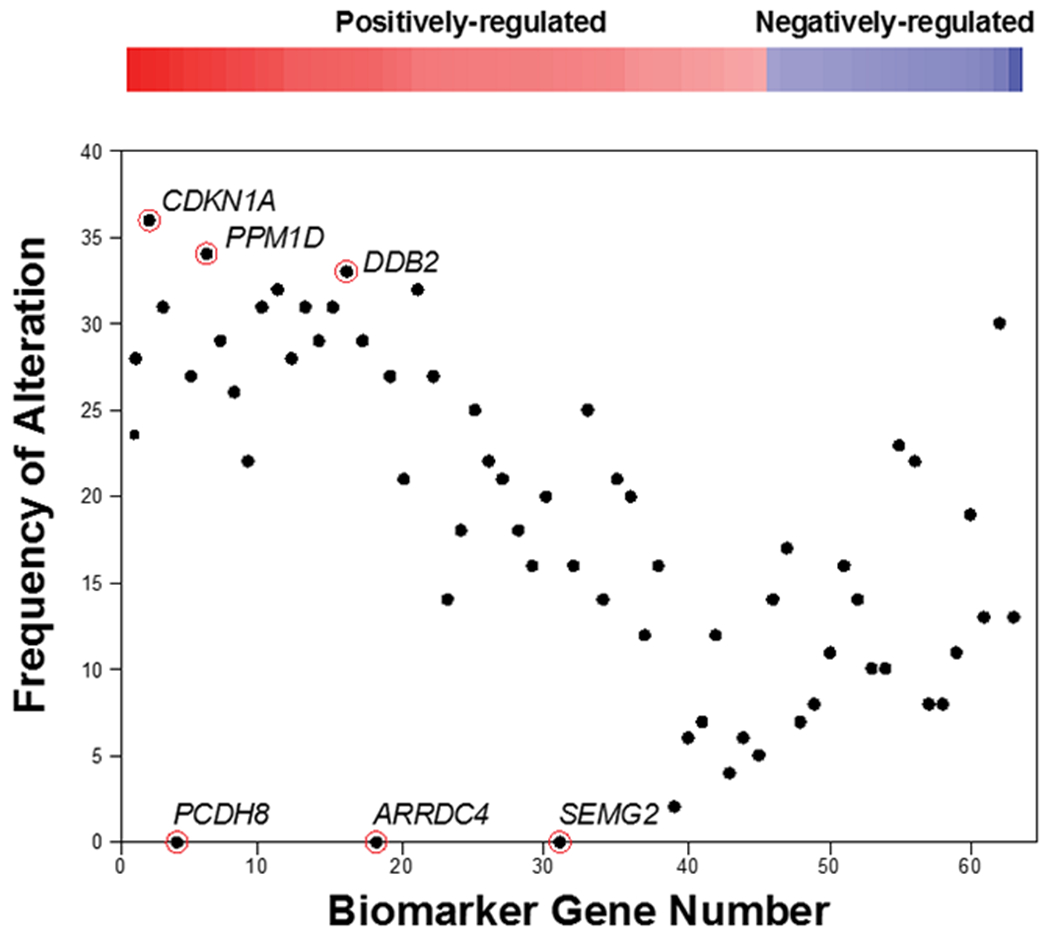
The contribution of each gene in the biomarker was examined in biosets described in this study that compared chemical-induced gene expression, exhibited a positive correlation to the biomarker (36 biosets; -Log(p-value) ≥ 4), and caused DNA damage. The frequency of alterations were quantitated as any fold-change that had the same sign as the biomarker gene (positive or negative). The frequency was plotted for the genes vs. their rank order based on their biomarker fold-change. The three genes that had the lowest (PCDH8, SMEG2, ARRDC4) or highest (CDKN1A, PPM1D, DDB2) frequency are indicated.
Some genes appeared to contribute little to the correlation -Log(p-value). In particular, there were three genes (PCDH8, SEMG2, ARRDC4) that were never altered across the 36 comparisons. We determined whether the absence of these three genes would have an impact on classification. The TGx-DDI biomarker lacking these three genes was compared in a pair-wise manner to each of the 36 biosets using the Running Fisher test to generate –Log(p-value)s. The range of the resulting –Log(p-value)s were compared to those derived from the original 63 gene biomarker (Figure 6). The biosets compared to the biomarker lacking the three genes (grey) had in most cases increased -Log(p-value)s compared to the original biomarker (blue), indicating these three genes had a negative effect in the correlation analysis. Out of the total number of biosets, there were no biosets that had –Log(p-value)s which dropped below 4. Thus, the accuracy of the biomarker did not change in the absence of these three genes. For comparison, we determined whether the absence of the three most frequently regulated genes (CDKN1A, PPM1D, DDB2) that were altered 36, 34, and 33 times, respectively, would have a negative effect on classifications. Using the biomarker lacking these three genes, the -Log(p-value)s decreased across all of the biosets (blue vs. orange) an average -Log(p-value) of 2.3. While the biosets that exhibited the greatest -Log(p-value)s would still be classified as DDI, any biosets with ~ less than 6 would be reclassified as non-DDI. An example of this was the bioset “Acetaminophen 7hrs D1 TK6 Cells”, which went from 4.5 to 3.1. Thus, the genes in the biomarker do not contribute equally to the correlation analysis.
Figure 6. Effect of removal of the most or least frequently altered genes on biomarker correlations.
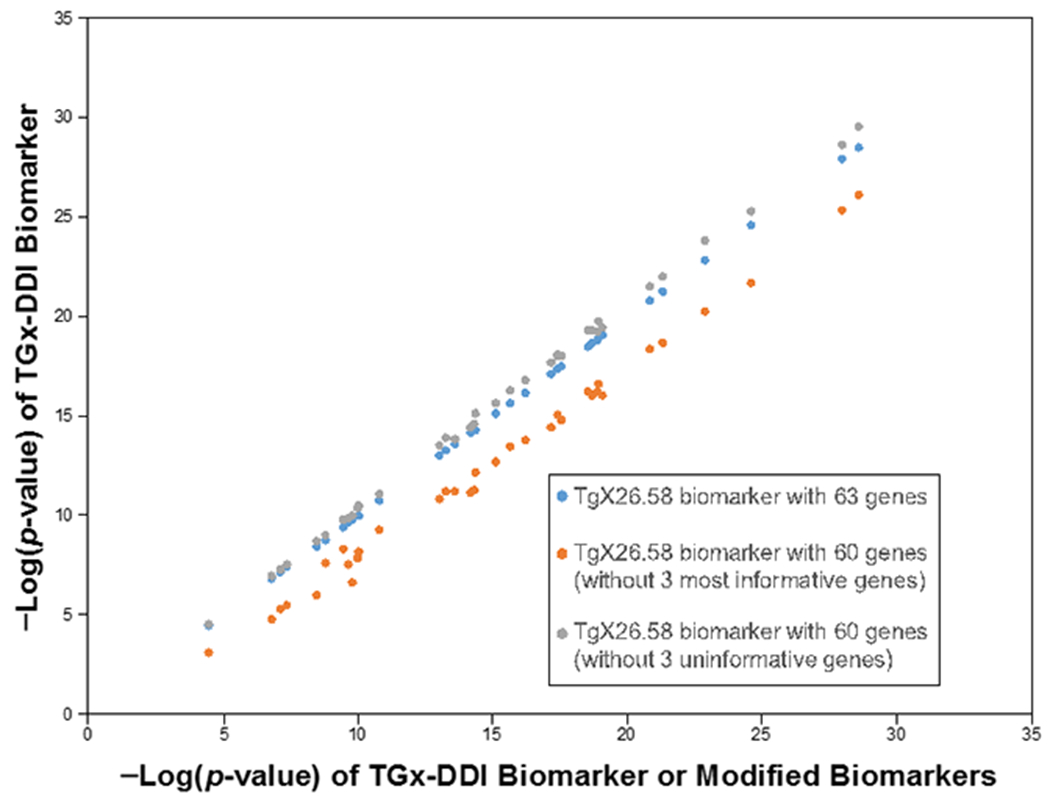
Biomarkers that lack either the three most (CDKN1A, PPM1D, DDB2) or three least (PCDH8, SMEG2, ARRDC4) frequently altered genes were compared to the original biomarker (-Log(p-value) ≥ 4). The resulting correlation -Log(p-value)s were compared to the -Log(p-value)s from the original biomarker. Blue, original biomarker; gray, biomarker lacking PCDH8, SMEG2, ARRDC4; orange, biomarker lacking CDKN1A, PPM1D, DDB2.
Relationships between number of biomarker genes altered and significance of the correlation.
We next determined the minimal number of altered genes needed to classify putative DDI potential. The number of significantly altered biomarker genes in each of the 36 biosets were rank-ordered (Figure 7, top panel); the -Log(p-value) of each comparison (middle panel) and heatmap of the regulated genes (bottom panel) were plotted in the same order. The fewest number of altered genes that achieved the threshold -Log(p-value) = 4 was 10, and happened one time for bioset “Cisplatin BaP Expt PC 8hrs D1 TK6 Cells”. The mean and median number of genes altered across all of the biosets was about half of all biomarker genes, 32 and 34, respectively. As can be seen in Fig 7 (middle panel), the -Log(p-value)s tended to increase with the increase in overlapping genes. This relationship would be expected given that an overlap of a greater number of genes changing in the same direction as those in the biomarker would result in greater significance between the biomarker and individual biosets.
Figure 7. Relationships between the -log(p-value) and number of significantly altered genes in the bioset.
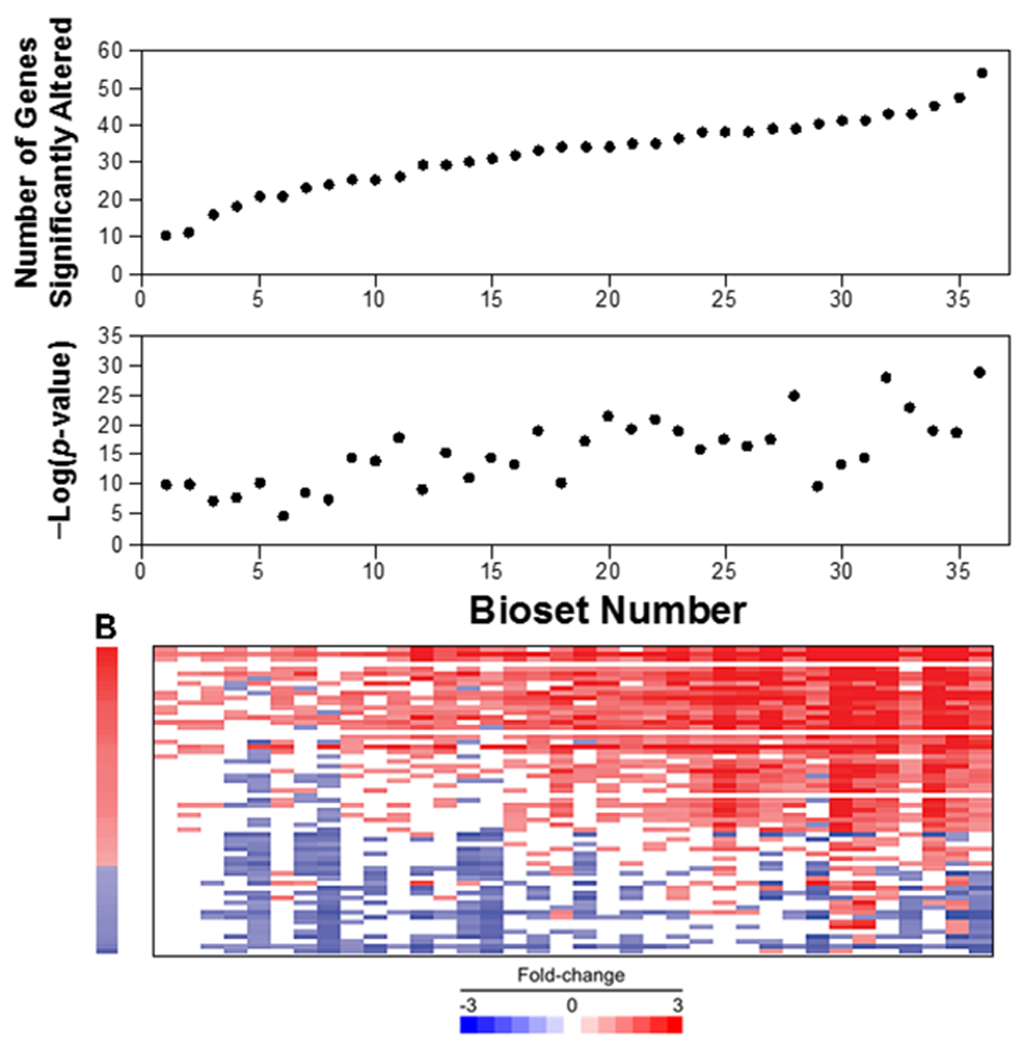
(Top) The 36 biosets described in Figure 5 were rank ordered based on the total number of significantly altered biomarker genes. (Middle) For each of the ranked biosets the -Log(p-value)s are shown. (Bottom) Heatmap of the expression of the biomarker genes across the ranked biosets.
The biomarker identifies DDI agents through modulation of different sets of genes in the biomarker.
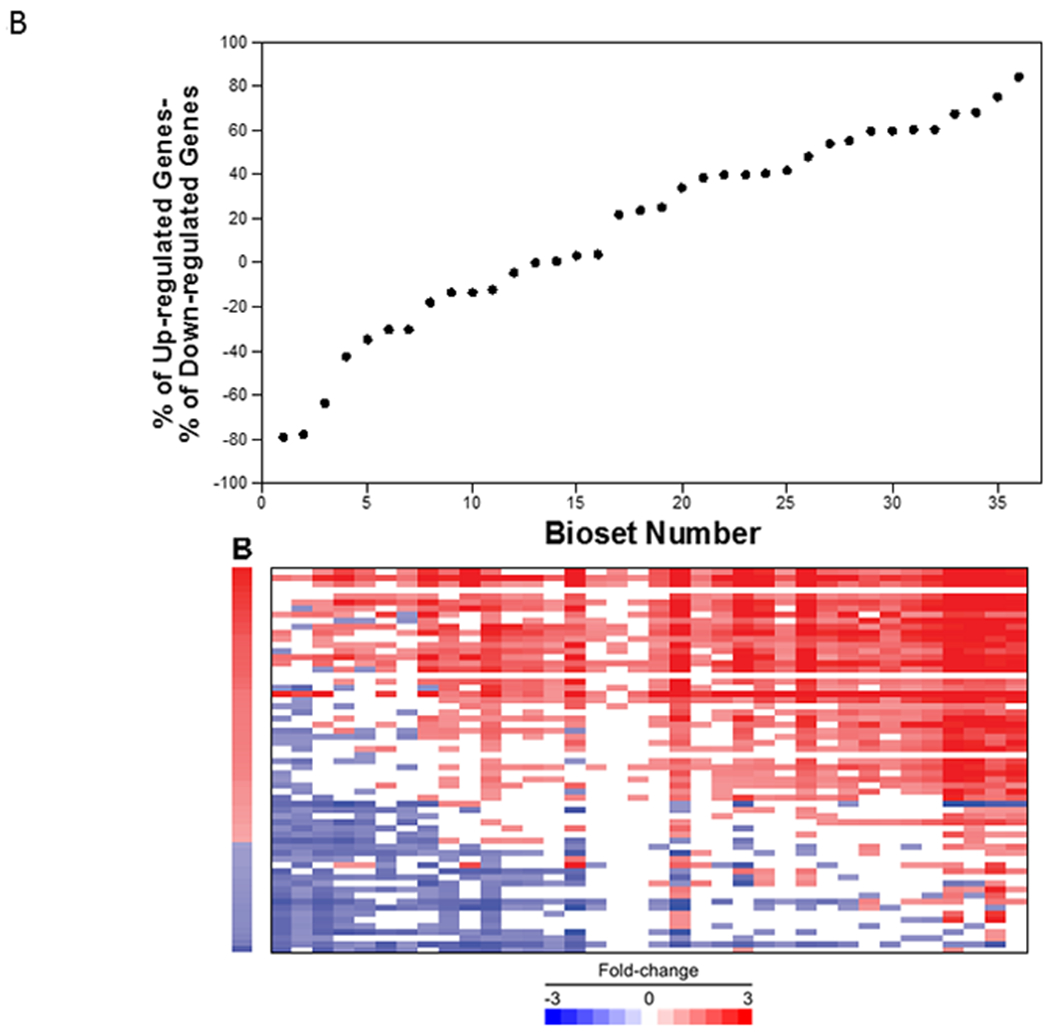
We examined whether it was possible to identify DDI agents that alter different sets of genes in the biomarker including as extreme cases, mostly induced or mostly repressed genes. To address this, the percent contribution of the induced biomarker genes minus the percent contribution of the repressed biomarker genes (% up - % down) was plotted relative to -Log(p-value)s (Figure 8A, left panel). The majority of biosets grouped on the right side of the graph, showing that a greater percentage of induced genes were altered than repressed genes. Thus, the pattern indicates that the induced genes play a dominant role in determining correlation -Log(p-value)s.
Figure 8. Relationships between -Log(p-value)s and contribution of the up- and down-regulated biomarker genes.
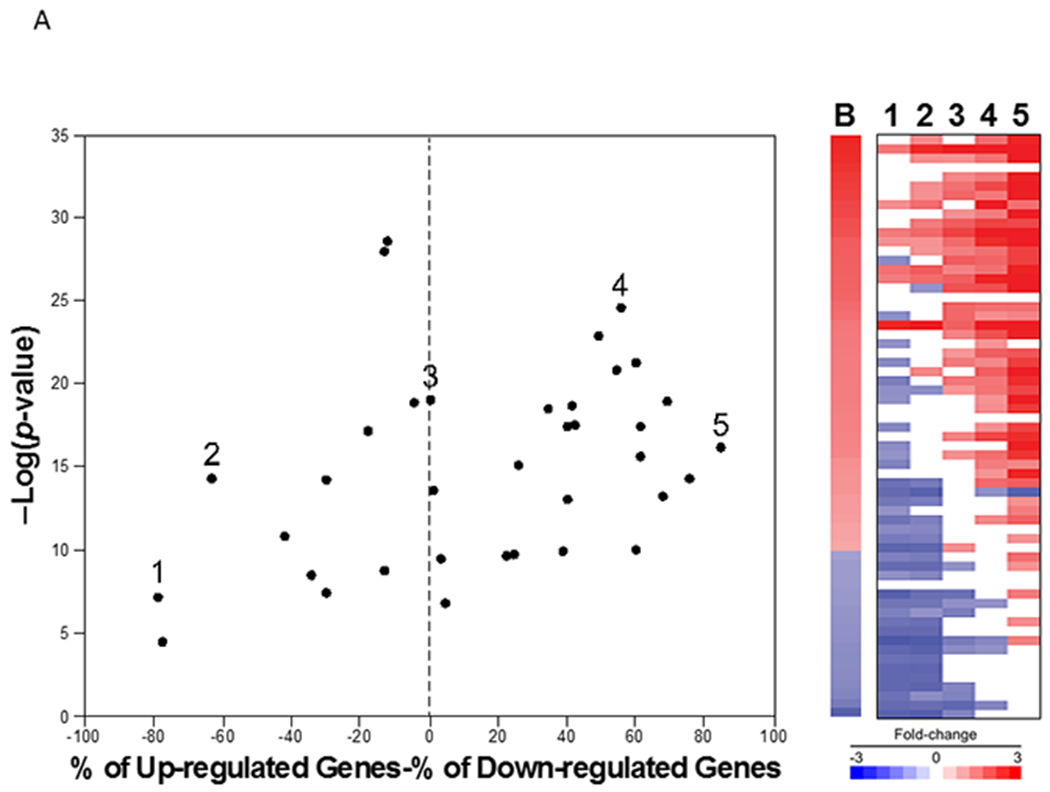
A. (Left) For the 36 biosets described in Figure 5, the % genes altered (defined as % up-regulated genes - % down-regulated genes) were plotted vs. -Log(p-value). Biosets which span the range of values are indicated (1-5). (Right) Heatmap of the expression of biomarker genes in the 5 examples.
B. (Top) The 36 biosets were rank ordered based on the % up-regulated genes - % down-regulated genes. (Bottom) Heatmap of the expression of the biomarker genes for the biosets in the same order.
To assess the spectrum of different gene sets that might contribute to positive biomarker scores, Figure 8A, right panel shows the gene expression profiles of 5 examples that represent the extremes of the contribution of repressed or induced genes (from 1-5, in left panel). The heat map indicates that in example 1, a positive -Log(p-value) can be achieved if there is consistent expression of mostly negatively-regulated genes. We note that there were very few examples of this in the dataset (3 examples that had a % up minus % down of less than −60%) and consisted of two chemicals (2-aminobenzanthracene, acetaminophen) from the same study (Yauk, Buick et al. 2016). Examples 2-4 have increasing numbers of induced vs. repressed genes. In example 5, almost all of the induced genes but none of the repressed genes overlap with the biomarker gene fold-change values. The 3 biosets with the top % up minus % down were all from one study (Kuehner, Holzmann et al. 2013) consisting of exposures to three chemicals (ethyl methanesulfonate, methyl methanesulfonate, formaldehyde).
The relationship between the % altered and the expression of the genes for the 36 biosets is shown in Figure 8B. On the left of the graph, most of the down-regulated genes of the biomarker were decreased, while on the right, most of the up-regulated genes were increased. This analysis indicates that some biosets can exhibit a positive and significant -Log(p-value) if most of the down-regulated genes are decreased in expression or if most of the up-regulated genes are increased in expression. However, the vast majority of biosets have a mixture of altered genes dominated by induced genes.
Discussion
High-throughput transcriptomic (HTTr) technologies have the potential to accurately identify toxic chemicals in in vitro screens of environmental chemicals. Our group has previously determined that a biomarker approach can be used to identify ER modulators in a large compendium of microarray profiles derived from chemically-treated human cell lines (Ryan, Chorley et al. 2016). In the present study, we used similar computational methods to determine if our approach can also identify chemicals that cause DNA damage using the previously characterized TGx-DDI biomarker (Li, Hyduke et al. 2015, Yauk, Buick et al. 2016). We found that this biomarker used in conjunction with a pattern matching correlation approach could readily identify chemicals that cause DNA damage. The approach yielded predictive accuracies of up to 97% in TK6 cells, the cell line that was originally used to develop the biomarker. Our approach could also accurately identify DDI chemicals in a metabolically active cell line, HepaRG, with accuracies of 90%. In contrast, the approach was less useful to identify DDI chemicals that were examined in less metabolically active hepatocyte cell lines (60% or 80% accuracies for HepG2 or ESC-derived hepatocytes, respectively). The method could also readily differentiate the DDI from non-DDI chemicals when gene expression was examined using nCounter. In an examination of individual genes in a set of 36 biosets that exhibited significant positive correlation and were known true positive DDI chemicals, we found that the genes did not contribute equally to the correlations. Three genes were not altered across the comparisons, and their removal from the biomarker had minimal effects on classifications. We also found that different sets of genes in the biomarker could contribute to the correlations including extreme examples consisting of almost all induced or almost all repressed genes. Overall, these results demonstrate the utility of the biomarker in conjunction with another computational technique to accurately classify DDI agents, and indicate that our approach could be reliably used as a Tier 0 screen in the context of HTTr profiling such as ongoing efforts in the ToxCast screening program (Harrill J 2018, Shah 2018).
To screen for chemicals that are DDI, the biomarker was compared to individual biosets using the fold-change rank-based nonparametric Running Fisher algorithm (Kupershmidt, Su et al. 2010). The approach finds, in an unsupervised manner, biosets with expression patterns of biomarker genes with statistically significant positive or negative correlation. Our approach can readily identify biosets in the database that exhibit a pattern similar to that of the expression of biomarker genes. The basis for the correlations is likely due to activation of p53. In the Li et al. (2015) study, 20 of the biomarker genes were identified as regulated by p53 in prior publications. In a follow up study, we not only identify additional genes in the biomarker that are p53-dependent but identify a large number of chemotherapeutic cancer drugs, environmental agents, and p53 activating chemicals in a microarray compendium (Corton et al., in preparation).”
The use of our methods resulted in excellent predictive accuracies to identify DDI compounds. Using 59 biosets from TK6 cells treated with 18 chemicals from four published studies (Kuehner, Holzmann et al. 2013, Buick, Moffat et al. 2015, Yauk, Buick et al. 2016, Buick, Williams et al. 2017), tests were 90% or 97% accurate depending on the significance threshold selected. In the most accurate model, the methods missed only disperse orange, a very weakly genotoxic chemical (Buick, Williams et al. 2017). Given the relatively small number of chemicals tested (15 positive and 3 negative), the analysis should be repeated using a larger set of chemicals with known genotoxicity potential. However, the high level of accuracy demonstrated the robustness of the computational procedures despite the fact that the biosets were derived from heterogeneous experiments with various exposure conditions carried out in multiple labs. These results are consistent with our past experience in accurately identifying chemical modulators of transcription factors in the mouse liver (Oshida, Vasani et al. 2015, Oshida, Vasani et al. 2015, Oshida, Vasani et al. 2015) and MCF-7 cells (Ryan, Chorley et al. 2016). Our approach has a number of advantages compared to other methods used to identify DDI chemicals. Our method allows the classification of DDI of chemicals that are found in the BSCE database, allows the automatic evaluation of thousands of biosets simultaneously, and can be used with other predictive biomarkers to comprehensively assess common targets of carcinogens.
Our computational approach was also accurate at predicting DDI agents in a different human cell line. We used the microarray data from Doktorova et al. (Doktorova, Yildirimman et al. 2013) in which 15 chemicals belonging to three chemical classes 5 genotoxic carcinogens (aflatoxin B1, 4-methylnitrosamino)-3-pyridyl)-1-butanone, 2-nitrofluorene, benzo[a]pyrene, cyclophosphamide), 5 nongenotoxic carcinogens (methapyrilene hydrochloride, piperonylbutoxide, WY-14,643, phenobarbital sodium, 12-O-tetradecanoylphorbol-13-acetate)and 5 noncarcinogens (nifedipine, clonidine, D-mannitol, tolbutamide, diclofenac sodium) were profiled in three human hepatocyte cell lines. Our method did not sufficiently classify DDI in the two cell lines with compromised metabolic competence; accuracies were only 60% and 80% for HepG2 and ESC-hepatocytes, respectively. In the metabolically competent HepaRG cell line, the accuracy was 90%. There were no false positives and one false negative, 2-nitrofluorene, a weak DDI agent. These results were very similar to those from Buick et al. (Buick, Moffat et al. 2015) using the biomarker and the nearest shrunken centroid method, which resulted in predictive accuracies in HepaRG cells of 100%. While the biomarker was developed and characterized using Agilent microarrays, we could readily classify DDI using Affymetrix arrays from the studies of Kuehner et al. (Kuehner, Holzmann et al. 2013) and Doktorova et al. (Doktorova, Yildirimman et al. 2013). We could also identify DDI from exposure to 2 μM B[a]P in HepG2 cells when exposures were for 12 or 24 hrs and analyzed by RNA-Seq (data not shown; data from (van Delft, Gaj et al. 2012)). Thus, the biomarker and computational methods appear to be accurate independent of the high output platform on which the gene expression was generated, allowing adaptability in future HTTr screens.
Future HTTr may utilize a number of gene expression platforms that meet the goals of institutional chemical screens. We found that our approach can make accurate classifications using gene expression data generated not only on different microarray platforms but measuring changes in expression of only the biomarker genes by nCounter. In contrast to microarray data that used at least 3 replicates, the nCounter data were derived from only one biological replicate per chemical, mimicking a potential design for high throughput screening. While the experimental design allowed us to determine fold-change levels, a statistical analysis could not be carried out and thus each gene possessed an unfiltered fold-change value in the analysis. When these profiles were analyzed using our methods, we could readily discriminate between the DDI vs. non-DDI chemicals that were originally used in the training set (Li, Hyduke et al. 2015). However, the threshold required to distinguish the two classes was higher than that used in the microarray studies (-Log(p-value) = 34). Using this threshold in the test set of 45 chemicals, our methods resulted in a balanced accuracy of 0.89 which compared favorably with the balanced accuracy from the Li et al. (Li, Chen et al. 2017) analysis (balanced accuracy = 0.86). The higher threshold required to distinguish DDI from non-DDI compounds is due to the nature of the nCounter data. Each of the biosets had values for each gene as opposed to the microarray-derived biosets in which values could be absent because that gene change did not reach statistical significance. Thus, in the nCounter data the cumulative contribution of all genes to the biomarker correlations and resultant p-values increased the -Log(p-value)s compared to the microarray data. In our earlier studies, we found that removal of groups of genes from the ER biomarker consistently led to lower significance across bioset comparisons (Ryan, Chorley et al. 2016). Our conclusion from these studies is that our computational approach is useful to distinguish between DDI and non-DDI chemicals independent of the platform used to generate the gene expression data. However, the thresholds for accurate classifications may differ between platforms, and we thus recommend bridging studies when moving to new platforms, and setting thresholds through testing on empirical data. Like the Li et al. (Li, Chen et al. 2017) analysis, our methods will help to de-risk chemicals with irrelevant positive chromosome damage results.
We determined the relationships between the expression of the genes in the biomarker and their contribution to the correlation p-values by examination of 36 biosets described above with significant positive correlations and that were known DDI agents. While the minimal number of genes required to be altered in the biomarker to achieve significance for positive correlation was 10, most of the biosets had a greater number of genes altered (median and mean = 34 or 32, respectively). Individual biomarker genes do not make equal contributions to the biomarker correlations. In examining the number of times each gene was altered in the same direction as that in the biomarker, we found a wide range from 0 to 36 times out of 36. There were three genes in particular (PCDH8, SEMG2, ARRDC4) that did not appear to contribute to the biomarker correlations, as they were never altered across the 36 biosets. A biomarker lacking these three genes was essentially as good as the original 63 gene biomarker in predicting significant correlations of the biosets. There were no -Log(p-value)s that dropped below the threshold of 4. Importantly, the classifications in TK6 cells and HepaRG cells were not altered (data not shown). In contrast, removal of the three most frequently altered genes (CDKN1A, PPM1D, DDB2) had a dramatic effect on the correlations, such that -Log(p-value)s dropped an average of 2.6 and for chemicals that had -Log(p-value)s close to 4 would be misclassified as non-DDI. This analysis indicates that not all genes in the biomarker contribute equally to the biomarker correlations and provides the impetus to create biomarkers that are smaller in size and potentially cheaper that could be used to identify DDI chemicals without sacrificing accuracy. It will be interesting to see if the absence of PCDH8, SEMG2, and ARRDC4 will also have an effect on classifications using other methods, such as the nearest shrunken centroid model.
We examined the relationships between altered regulation of induced or repressed genes in the biomarker across the biosets and the -Log(p-value)s of the correlations. There was a wide spectrum of gene expression alterations of biomarker genes that led to significant positive correlations with the biomarker. The extremes included biosets that exhibited mostly induced biomarker genes, or mostly repressed biomarker genes. However, these examples were rare, as most biosets with positive correlations exhibited a mixture of contributions of induced and repressed biomarker genes. These observations support the contention that the Running Fisher test is inherently robust to be able to identify chemicals that affect different subsets of genes in the biomarker. Additionally, the analysis indicates that not all genes in the biomarker contribute equally to the biomarker correlations, and this could be due to differences in the response of each gene to individual chemical perturbations through different mechanisms of action.
In summary, we characterized gene expression-based computational procedures to screen for DDI chemicals in human cell lines using an approach that we have used previously (e.g., (Ryan, Chorley et al. 2016)). The approach provides a robust measure of DDI potential, because it performs well in different experimental models using different gene expression platforms. The predictive accuracies closely follow those using a different set of computational procedures (Yauk, Buick et al. 2016). HTTr profiling in human cells for DDI chemicals could complement the current screening paradigm by serving as a Tier 0 screen, which would be followed by Tier 1 targeted assays to uncover the underlying mechanism of action.
Supplementary Material
Acknowledgements
This study was carried out as part of the EPA High Throughput Testing project within the Chemical Safety for Sustainability (CSS) Program. The information in this document has been funded in part by the U.S. Environmental Protection Agency. The views expressed in this paper are those of the authors and do not necessarily reflect the statements, opinions, views, conclusions, or policies of the United States EPA. Mention of trade names or commercial products does not constitute endorsement or recommendation for use. The authors declare they have no actual or potential competing financial interests. This study has been subjected to review by the National Health and Environmental Effects Research Laboratory and approved for publication. Approval does not signify that the contents reflect the views of the Agency, nor does mention of trade names or commercial products constitute endorsement or recommendation for use. We thank Drs. Heidrun Ellinger-Ziegelbauer and Les Recio for critical review of the manuscript, Drs. Heng-Hong Li and Albert Fornace for the nCounter data, and Mr. Chuck Gaul for assistance in creating the figures.
Footnotes
Supplementary Data
Supplemental File 1 (Excel). Contains 1) list of genes and fold-changes of the TGx-DDI biomarker, and 2) information about the biosets examined in this study.
REFERENCES
- Benjamini YHY (1995). “Controlling the false discovery rate: a practical and powerful approach to multiple testing ” J. R. Stat. Soc. B 57: 289–300. [Google Scholar]
- Buick JK, Moffat I, Williams A, Swartz CD, Recio L, Hyduke DR, Li HH, Fornace AJ Jr., Aubrecht J and Yauk CL (2015). “Integration of metabolic activation with a predictive toxicogenomics signature to classify genotoxic versus nongenotoxic chemicals in human TK6 cells.” Environ Mol Mutagen 56(6): 520–534. [DOI] [PMC free article] [PubMed] [Google Scholar]
- Buick JK, Williams A, Kuo B, Wills JW, Swartz CD, Recio L, Li HH, Fornace AJ Jr., Aubrecht J and Yauk CL (2017). “Integration of the TGx-28.65 genomic biomarker with the flow cytometry micronucleus test to assess the genotoxicity of disperse orange and 1,2,4-benzenetriol in human TK6 cells.” Mutat Res 806: 51–62. [DOI] [PubMed] [Google Scholar]
- Cui X, Hwang JT, Qiu J, Blades NJ and Churchill GA (2005). “Improved statistical tests for differential gene expression by shrinking variance components estimates.” Biostatistics 6(1): 59–75. [DOI] [PubMed] [Google Scholar]
- Doktorova TY, Yildirimman R, Vinken M, Vilardell M, Vanhaecke T, Gmuender H, Bort R, Brolen G, Holmgren G, Li R, Chesne C, van Delft J, Kleinjans J, Castell J, Bjorquist P, Herwig R and Rogiers V (2013). “Transcriptomic responses generated by hepatocarcinogens in a battery of liver-based in vitro models.” Carcinogenesis 34(6): 1393–1402. [DOI] [PubMed] [Google Scholar]
- Eichner J, Kossler N, Wrzodek C, Kalkuhl A, Bach Toft D, Ostenfeldt N, Richard V and Zell A (2013). “A toxicogenomic approach for the prediction of murine hepatocarcinogenesis using ensemble feature selection.” PLoS One 8(9): e73938. [DOI] [PMC free article] [PubMed] [Google Scholar]
- Goodsaid FM, Amur S, Aubrecht J, Burczynski ME, Carl K, Catalano J, Charlab R, Close S, Cornu-Artis C, Essioux L, Fornace AJ Jr., Hinman L, Hong H, Hunt I, Jacobson-Kram D, Jawaid A, Laurie D, Lesko L, Li HH, Lindpaintner K, Mayne J, Morrow P, Papaluca-Amati M, Robison TW, Roth J, Schuppe-Koistinen I, Shi L, Spleiss O, Tong W, Truter SL, Vonderscher J, Westelinck A, Zhang L and Zineh I (2010). “Voluntary exploratory data submissions to the US FDA and the EMA: experience and impact.” Nat Rev Drug Discov 9(6): 435–445. [DOI] [PubMed] [Google Scholar]
- Harrill J, Shah I, Setzer RW, Martin MT, Haggard D, Thomas RS. (2018). Differential gene expression and concentration-response modeling workflow for high-throughput transcriptomic (HTTr) data: results from MCF7 cells. The Toxicologist 2116. [Google Scholar]
- Jackson MA, Yang L, Lea I, Rashid A, Kuo B, Williams A, Lyn Yauk C and Fostel J (2017). “The TGx-28.65 biomarker online application for analysis of transcriptomics data to identify DNA damage-inducing chemicals in human cell cultures.” Environ Mol Mutagen 58(7): 529–535. [DOI] [PubMed] [Google Scholar]
- Judson R, Houck K, Martin M, Knudsen T, Thomas RS, Sipes N, Shah I, Wambaugh J and Crofton K (2014). “In vitro and modelling approaches to risk assessment from the U.S. Environmental Protection Agency ToxCast programme.” Basic Clin Pharmacol Toxicol 115(1): 69–76. [DOI] [PubMed] [Google Scholar]
- Kuehner S, Holzmann K and Speit G (2013). “Characterization of formaldehyde’s genotoxic mode of action by gene expression analysis in TK6 cells.” Arch Toxicol 87(11): 1999–2012. [DOI] [PubMed] [Google Scholar]
- Kupershmidt I, Su QJ, Grewal A, Sundaresh S, Halperin I, Flynn J, Shekar M, Wang H, Park J, Cui W, Wall GD, Wisotzkey R, Alag S, Akhtari S and Ronaghi M (2010). “Ontology-based meta-analysis of global collections of high-throughput public data.” PLoS One 5(9). [DOI] [PMC free article] [PubMed] [Google Scholar]
- Li HH, Chen R, Hyduke DR, Williams A, Frotschl R, Ellinger-Ziegelbauer H, O’Lone R, Yauk CL, Aubrecht J and Fornace AJ Jr. (2017). “Development and validation of a high-throughput transcriptomic biomarker to address 21st century genetic toxicology needs.” Proc Natl Acad Sci U S A 114(51): E10881–e10889. [DOI] [PMC free article] [PubMed] [Google Scholar]
- Li HH, Hyduke DR, Chen R, Heard P, Yauk CL, Aubrecht J and Fornace AJ Jr. (2015). “Development of a toxicogenomics signature for genotoxicity using a dose-optimization and informatics strategy in human cells.” Environ Mol Mutagen 56(6): 505–519. [DOI] [PMC free article] [PubMed] [Google Scholar]
- Melis JP, Derks KW, Pronk TE, Wackers P, Schaap MM, Zwart E, van Ijcken WF, Jonker MJ, Breit TM, Pothof J, van Steeg H and Luijten M (2014). “In vivo murine hepatic microRNA and mRNA expression signatures predicting the (non-)genotoxic carcinogenic potential of chemicals.” Arch Toxicol 88(4): 1023–1034. [DOI] [PubMed] [Google Scholar]
- Minowa Y, Kondo C, Uehara T, Morikawa Y, Okuno Y, Nakatsu N, Ono A, Maruyama T, Kato I, Yamate J, Yamada H, Ohno Y and Urushidani T (2012). “Toxicogenomic multigene biomarker for predicting the future onset of proximal tubular injury in rats.” Toxicology 297(1–3): 47–56. [DOI] [PubMed] [Google Scholar]
- Oshida K, Vasani N, Jones C, Moore T, Hester S, Nesnow S, Auerbach S, Geter DR, Aleksunes LM, Thomas RS, Applegate D, Klaassen CD and Corton JC (2015). “Identification of chemical modulators of the constitutive activated receptor (CAR) in a gene expression compendium.” Nucl Recept Signal 13: e002. [DOI] [PMC free article] [PubMed] [Google Scholar]
- Oshida K, Vasani N, Thomas RS, Applegate D, Gonzalez FJ, Aleksunes LM, Klaassen CD and Corton JC (2015). “Screening a mouse liver gene expression compendium identifies modulators of the aryl hydrocarbon receptor (AhR).” Toxicology 336: 99–112. [DOI] [PMC free article] [PubMed] [Google Scholar]
- Oshida K, Vasani N, Thomas RS, Applegate D, Rosen M, Abbott B, Lau C, Guo G, Aleksunes LM, Klaassen C and Corton JC (2015). “Identification of modulators of the nuclear receptor peroxisome proliferator-activated receptor alpha (PPARalpha) in a mouse liver gene expression compendium.” PLoS One 10(2): e0112655. [DOI] [PMC free article] [PubMed] [Google Scholar]
- Oshida K, Vasani N, Waxman DJ and Corton JC (2016). “Disruption of STAT5b-Regulated Sexual Dimorphism of the Liver Transcriptome by Diverse Factors Is a Common Event.” PLoS One 11(3): e0148308. [DOI] [PMC free article] [PubMed] [Google Scholar]
- Oshida K, Waxman DJ and Corton JC (2016). “Chemical and Hormonal Effects on STAT5b-Dependent Sexual Dimorphism of the Liver Transcriptome.” PLoS One 11(3): e0150284. [DOI] [PMC free article] [PubMed] [Google Scholar]
- Romer M, Eichner J, Metzger U, Templin MF, Plummer S, Ellinger-Ziegelbauer H and Zell A (2014). “Cross-platform toxicogenomics for the prediction of non-genotoxic hepatocarcinogenesis in rat.” PLoS One 9(5): e97640. [DOI] [PMC free article] [PubMed] [Google Scholar]
- Ryan N, Chorley B, Tice RR, Judson R and Corton JC (2016). “Moving Toward Integrating Gene Expression Profiling Into High-Throughput Testing: A Gene Expression Biomarker Accurately Predicts Estrogen Receptor alpha Modulation in a Microarray Compendium.” Toxicol Sci 151(1): 88–103. [DOI] [PMC free article] [PubMed] [Google Scholar]
- Sahini N, Selvaraj S and Borlak J (2014). “Whole genome transcript profiling of drug induced steatosis in rats reveals a gene signature predictive of outcome.” PLoS One 9(12): e114085. [DOI] [PMC free article] [PubMed] [Google Scholar]
- Schmeits PC, Shao J, van der Krieken DA, Volger OL, van Loveren H, Peijnenburg AA and Hendriksen PJ (2015). “Successful validation of genomic biomarkers for human immunotoxicity in Jurkat T cells in vitro.” J Appl Toxicol 35(7): 831–841. [DOI] [PubMed] [Google Scholar]
- Searle S, Speed FM, Milliken GA (1980). “Population marginal means in the linear-model — an alternative to least-squares means. .” Am. Stat 34: 216–221. [Google Scholar]
- Shah I, Harrill J, Setzer RW, Haggard D, Karmaus A, Martin MT, Thomas RS. (2018). Predicting Chemical Mechanisms of Action using High-Throughput Transcriptomic Data. The Toxicologist 1689. [Google Scholar]
- Thomas R, Thomas RS, Auerbach SS and Portier CJ (2013). “Biological networks for predicting chemical hepatocarcinogenicity using gene expression data from treated mice and relevance across human and rat species.” PLoS One 8(5): e63308. [DOI] [PMC free article] [PubMed] [Google Scholar]
- Uehara T, Minowa Y, Morikawa Y, Kondo C, Maruyama T, Kato I, Nakatsu N, Igarashi Y, Ono A, Hayashi H, Mitsumori K, Yamada H, Ohno Y and Urushidani T (2011). “Prediction model of potential hepatocarcinogenicity of rat hepatocarcinogens using a large-scale toxicogenomics database.” Toxicol Appl Pharmacol 255(3): 297–306. [DOI] [PubMed] [Google Scholar]
- van Delft J, Gaj S, Lienhard M, Albrecht MW, Kirpiy A, Brauers K, Claessen S, Lizarraga D, Lehrach H, Herwig R and Kleinjans J (2012). “RNA-Seq provides new insights in the transcriptome responses induced by the carcinogen benzo[a]pyrene.” Toxicol Sci 130(2): 427–439. [DOI] [PubMed] [Google Scholar]
- Williams A, Buick JK, Moffat I, Swartz CD, Recio L, Hyduke DR, Li HH, Fornace AJ Jr., Aubrecht J and Yauk CL (2015). “A predictive toxicogenomics signature to classify genotoxic versus non-genotoxic chemicals in human TK6 cells.” Data Brief 5: 77–83. [DOI] [PMC free article] [PubMed] [Google Scholar]
- Wu H, Kerr MK, Ciu X, Churchill GA (2003). “MAANOVA: a softwear package for the analysis of spotted cDNA microarray experiments” Parmigiani G, Garrett ES, Irizarry RA (Eds.), The Analysis of Gene Expression Data: Methods and Software Springer-Verlag, New York: 313–431. [Google Scholar]
- Yamada F, Sumida K, Uehara T, Morikawa Y, Yamada H, Urushidani T and Ohno Y (2013). “Toxicogenomics discrimination of potential hepatocarcinogenicity of non-genotoxic compounds in rat liver.” J Appl Toxicol 33(11): 1284–1293. [DOI] [PubMed] [Google Scholar]
- Yauk CL, Buick JK, Williams A, Swartz CD, Recio L, Li HH, Fornace AJ Jr., Thomson EM and Aubrecht J (2016). “Application of the TGx-28.65 transcriptomic biomarker to classify genotoxic and non-genotoxic chemicals in human TK6 cells in the presence of rat liver S9.” Environ Mol Mutagen 57(4): 243–260. [DOI] [PMC free article] [PubMed] [Google Scholar]
- Yeakley JM, Shepard PJ, Goyena DE, VanSteenhouse HC, McComb JD and Seligmann BE (2017). “A trichostatin A expression signature identified by TempO-Seq targeted whole transcriptome profiling.” PLoS One 12(5): e0178302. [DOI] [PMC free article] [PubMed] [Google Scholar]
Associated Data
This section collects any data citations, data availability statements, or supplementary materials included in this article.