

Abstract
The in vivo metabolism and pharmacokinetics of flunixin meglumine and phenylbutazone have been extensively characterized; however, there are no published reports describing the in vitro metabolism, specifically the enzymes responsible for the biotransformation of these compounds in horses. Due to their widespread use and, therefore, increased potential for drug-drug interactions and widespread differences in drug disposition, this study aims to build on the limited current knowledge regarding P450-mediated metabolism in horses. Drugs were incubated with equine liver microsomes and a panel of recombinant equine P450s. Incubation of phenylbutazone in microsomes generated oxyphenbutazone and gamma-hydroxy phenylbutazone. Microsomal incubations with flunixin meglumine generated 5-OH flunixin, with a kinetic profile suggestive of substrate inhibition. In recombinant P450 assays, equine CYP3A97 was the only enzyme capable of generating oxyphenbutazone while several members of the equine CYP3A family and CYP1A1 were capable of catalyzing the biotransformation of flunixin to 5-OH flunixin. Flunixin meglumine metabolism by CYP1A1 and CYP3A93 showed a profile characteristic of biphasic kinetics, suggesting two substrate binding sites. The current study identifies specific enzymes responsible for the metabolism of two NSAIDs in horses and provides the basis for future study of drug-drug interactions and identification of reasons for varying pharmacokinetics between horses.
Keywords: cytochrome P450, equine, flunixin meglumine, metabolism, phenylbutazone
1 |. INTRODUCTION
Non-steroidal anti-inflammatory drugs (NSAIDs) are potent anti-inflammatory agents that, through inhibition of cyclooxygenase enzymes, decrease the production of several inflammatory mediators (e.g., prostaglandins and leukotrienes). This class of drugs is arguably the most commonly used medications in equine medicine, with phenylbutazone (PBZ) and flunixin meglumine (FM) being among the most frequently administered of the group. While the in vivo metabolism and pharmacokinetics of both drugs in horses have been extensively described (Gerring, Lees, & Taylor, 1981; Knych, Arthur, Mckemie, & Chapman, 2015; Knych, Arthur, et al., 2019; Knych, Baden, Gretler, & McKemie, 2019; Knych, Stanley, Seminoff, McKemie, & Kass, 2016; Lees, Landoni, Giraudel, & Touitain, 2004; Lees, Ewins, Taylor, & Sedgwick, 1987; Lees, Taylor, Maitho, Millar, & Higgins, 1987; Sams, Gerken, & Ashcraft, 1999; Semrad, Sams, Harris, & Ashcraft, 1993), to date, there are no published reports describing the in vitro metabolism of these compounds in horses. While these drugs undergo significant metabolism and only small amounts of parent compound are found in the urine, pharmacokinetic parameters reportedly vary greatly between individual animals (Knych et al., 2015, 2016; Knych, Arthur, et al., 2019; Knych, Baden, et al., 2019).
In many species including horses, PBZ undergoes aromatic hydroxylation to yield the active metabolite, oxyphenbutazone (Lees, Ewins, et al., 1987; Lees, Taylor, et al., 1987; Figure 1). While, to the best of the authors’ knowledge, the specific enzyme responsible for this biotransformation has not been reported in any species, it has been speculated that the reaction is carried out by a member of the cytochrome P450 (CYP450) superfamily (Alvares, Kapelner, Sassa, & Kappas, 1975). Interestingly, there are also reports of oxyphenbutazone-mediated inhibition of PBZ metabolism (Tobin, Blake, & Valentine, 1977). A second metabolite, gamma-hydroxy phenylbutazone, which results from aliphatic hydroxylation of PBZ, has also been reported in a number of species, including horses (Lees, Ewins, et al., 1987; Lees, Taylor, et al., 1987). Similar to oxyphenbutazone, there are no published reports describing the enzyme/s responsible for catalyzing this reaction.
FIGURE 1.

Metabolic pathway for flunixin in the horse
Following administration to horses, FM undergoes hydroxylation to form 5-OH flunixin (Jaussaud, Courtot, Guyot, & Paris, 1987; Figure 2). While the specific enzyme/s responsible for this reaction have not been reported in horses, in cattle, investigators have demonstrated a direct relationship between CYP450 activity and formation of 5-OH flunixin, which suggest that this reaction is carried out by members of this enzyme superfamily (Shappell, Duke, & Bartholomay, 2019). Additional studies in swine also suggest a role for CYP450 enzymes, specifically CYP1A1 and CYP2E1, in the biotransformation of FM to 5-OH flunixin (Howard et al., 2017; Howard, O’Nan, Maltecca, Baynes, & Ashwell, 2015). Results of studies describing a role for CYP450 in the metabolism of FM to 5-OH flunixin in other species suggest that this enzyme family may also play role in FM metabolism in horses.
FIGURE 2.

Metabolic pathway for phenylbutazone in the horse
Administration of FM and PBZ in horses is commonplace and can be associated with adverse effects including acute renal failure and gastric and colonic ulceration. Interestingly, some horses tend to be more susceptible than others to the adverse effects associated with NSAID administration. Drugs such as FM and PBZ are also often times administered in combination with other therapeutic compounds; therefore, identification of the specific enzymes responsible for biotransformation of PBZ and FM is imperative to limit the likelihood of drug-drug interactions. To the best of the authors’ knowledge, there are no reports of the characterization of the specific isoforms responsible for these biotransformation reactions. To that end, due to their widespread use and anecdotal and published reports describing the wide variation in pharmacokinetics and variable susceptibility to adverse effects, this study was conducted as a first step in identifying and characterizing the enzymes responsible for the metabolism of these two commonly used NSAIDs in horses.
2 |. MATERIALS AND METHODS
2.1 |. Chemicals
Saline (0.9%), Tris-HCl, potassium chloride, potassium phosphate, CHAPS, cytochrome c, FM, and PBZ for enzyme incubations were obtained from Sigma-Aldrich, NADPH from Cayman Chemical, and cytochrome b5 from Thermo Fisher. The analytical reference standards for 5-hydroxy-flunixin, oxyphenbutazone, and gamma-hydroxy phenylbutazone were purchased from Toronto Research Chemicals.
Acetonitrile and water were purchased from Burdick & Jackson. Methanol was purchased from Thermo Fisher Scientific. All solvents were HPLC grade or better.
2.2 |. Microsomal incubations
Liver microsomes were prepared as described previously (Knych, Arthur, et al., 2019; Knych, Baden, et al., 2019). Prior to performing microsomal incubations, linearity with respect to protein (enzyme activity) and time was established, and all subsequent kinetic studies were conducted within the linear portion of the rate curve. For microsomal incubations, two sets of liver microsomes (prepared from liver samples from two different horses) were tested independently. Additionally, a set of “blank” incubations were run in parallel. Reaction mixes in the blank incubations were as described below for the other incubations without the addition of NADPH. Incubations consisted of 1 mg/ml protein in 100 mM potassium phosphate buffer (pH 7.4), 1 mM CHAPS, and substrate (FM or PBZ) in a total volume of 250 μl. All reactions (buffer + varying concentrations of FM/PBZ) were pre-incubated at 37°C for 5 min prior to initiation of the reaction by the addition of 2 mM NADPH. Reactions were allowed to proceed for 20 min and were terminated by the addition of 250 μl of ice-cold acetonitrile. Flunixin meglumine and PBZ metabolism were measured under linear conditions using substrate concentrations ranging from 0 to 800 μM. Triplicate incubations were run concurrently at each substrate concentration.
2.3 |. Incubations with cDNA-expressed cytochrome P450s and kinetic assays
Incubations were conducted to determine the specific P450 enzymes responsible for the biotransformation of FM and PBZ. Recombinant equine P450s (CYP1A1, 1A2, 3A89, 3A93, 3A94, 3A95, 3A96, 3A97, 2D14, 2D50, 2D82, and 2C92) and equine NADPH cytochrome P450 oxidoreductase enzymes were prepared and activity of all enzymes determined as described previously (Knych, Arthur, et al., 2019; Knych, Baden, et al., 2019).
Kinetic parameters were determined (see below) for equine recombinant P450 enzymes that generated metabolites following incubations with FM and PBZ. Prior to performing kinetic assays, linearity with respect to protein (enzyme activity) and time for recombinant P450 enzymes was established and all subsequent kinetic studies were conducted within the linear portion of the rate curve. Additionally, prior to conducting the assays, the optimal ratio of recombinant P450 to equine NADPH cytochrome P450 oxidoreductase and human recombinant cytochrome b5 (where appropriate; Life Sciences) was determined. Optimization assays were conducted by the addition of increasing quantities of equine NADPH cytochrome P450 oxidoreductase to incubations containing recombinant P450, 1 mM CHAPS, 100 mM potassium phosphate buffer (pH 7.4), 2 mM NADPH and 400 μM of either FM or PBZ in a total volume of 250 μl. The mixture was pre-incubated for 5 min in a 37°C shaking water bath prior to the addition of the recombinant P450. Following a 30-min incubation at 37°C, the reactions were terminated by the addition of ice-cold acetonitrile.
For the kinetic assays, FM and PBZ metabolism by recombinant P450s were determined in 250 μl reaction volumes, including NADPH CYP450 oxidoreductase (amount determined in optimization reactions with individual P450s), cytochrome b5, human recombinant cytochrome b5 (where appropriate), 1 mM CHAPS, 2 mM NADPH, 100 mM potassium phosphate buffer (pH 7.4), and varying substrate concentrations (0–800 μM). The amount of recombinant enzyme added to the incubation ranged from 2.1 to 4.0 pmol depending on the individual enzyme. All reactions were incubated for 5 min at 37°C prior to initiation of the reaction by the addition of the recombinant P450. Incubations were allowed to proceed for 30 min in a shaking water bath at 37°C. Uninfected TriEx insect cell homogenate, in place of recombinant P450, served as the “blank” reaction. Ice-cold acetonitrile (250 μl) was added to terminate the reactions. Triplicate incubations were run concurrently at each substrate concentration.
2.4 |. Cytochrome P450 inhibition assays
Additional microsomal assays with PBZ and P450 inhibitors were also conducted. The reactions included known inhibitors for the human enzymes, CYP1A2 (furafylline), CYP1A2 (alpha-naphthoflavone), CYP2C8/9 (montelukast), CYP2C9 (sulfaphenazole), CYP2C19 (tranylcypromine), CYP2D6 (quinidine), and CYP3A4 (ketoconazole) with equine liver microsomes and recombinant CYP3A97 (the enzyme shown to produce oxyphenbutazone in screening studies). Reactions (250 μl volume) included NADPH CYP450 oxidoreductase, 1 mM CHAPS, 2 mM NADPH, 100 mM potassium phosphate buffer (pH 7.4), 400 μM of PBZ, and inhibitor (final concentration of 10 μM). All reactions were incubated for 5 min at 37°C prior to initiation of the reaction by the addition of the recombinant P450. Incubations were allowed to proceed for 30 min in a shaking water bath at 37°C. Incubation reactions were terminated by the addition of ice-cold acetonitrile (250 μl). Formation of gamma-hydroxy phenylbutazone in incubations containing inhibitors was compared to formation of metabolite in control incubations (no inhibitor).
2.5 |. Evaluation of contribution of flavin monooxygenase enzymes to phenylbutazone metabolism
The contribution of flavin monooxygenase enzymes (FMO) to the metabolism of PBZ to γ-hydroxy phenylbutazone was assessed using equine liver microsomes. Two sets of incubations were carried out: (a) equine liver microsomes with the FMO inhibitor methimazole (500 μM) and PBZ (400 μM) and (b) heat-inactivated (50°C for 1 min) equine liver microsomes and PBZ (400 μM). Both sets of reactions were carried out as described for the screening assays.
2.6 |. Determination of FM, PBZ, and metabolite concentrations in liver microsomal and recombinant P450 reactions
Gamma-hydroxy phenylbutazone and oxyphenbutazone were combined into one working solution; working solutions were prepared by dilution of the 1 mg/ml stock solutions with methanol to concentrations of 1, 10, and 100 ng/μl. 5-hydroxy-flunixin working solutions were prepared by dilution of the 1 mg/ml stock solution with methanol to concentrations of 0.01, 0.1, 1, and 10 ng/μl. Calibrators were prepared by dilution of the working standard solutions with 5% acetonitrile in water with 0.2% formic acid, to concentrations from 5 to 3,000 ng/ml for gamma-hydroxy phenylbutazone and oxyphenbutazone and 0.025 to 200 ng/ml for 5-hydroxy-flunixin. Calibration curves were prepared fresh for each quantitative assay.
Quantitative analysis was performed on an LTQ XL Orbitrap mass spectrometer (Thermo Scientific) coupled with a Waters Acquity UPLC. The system was operated in full-scan mode from 160 to 650 (m/z) at a resolution of 60,000 (M/ΔM, at full width at half maximum of the mass peaks) using positive electrospray ionization (ESI(+)). The spray voltage was set at 3,500 V, sheath gas and auxillary gas were 45 and 20, respectively (arbitrary units), and capillary temperature was 350°C. For all three analytes, chromatography employed an ACE 3 C18 10 cm × 2.1 mm column (Mac-Mod Analytical) and a linear gradient of ACN in water with a constant 0.2% formic acid, at a flow rate of 0.35 ml/min. The initial ACN concentration was held at 1% for 0.4 min, ramped to 60% over 8.6 min, ramped to 95% over 3 min before re-equilibrating for 3.6 min at initial conditions.
The responses were plotted using a 20 ppm mass tolerance for the ions: oxyphenbutazone and γ-hydroxy phenylbutazone (mass to charge ratio (m/z) 325.15483) and 5-OH flunixin (313.07952 (m/z)). Quanbrowser software (Thermo Scientific) was used to generate calibration curves and quantitate all samples by linear regression analysis. A weighting factor of 1/X was used for all calibration curves.
The responses were linear and gave correlation coefficients of 0.99 or better. The technique was optimized to provide a limit of quantitation of 5 ng/ml for gamma-hydroxy phenylbutazone and oxyphenbutazone and 0.5 ng/ml for 5-OH flunixin. The limit of detection was approximately 3 ng/ml for gamma-hydroxy phenylbutazone and oxyphenbutazone, and 0.3 ng/ml for 5-OH flunixin.
2.7 |. Determination of kinetic parameters
For both microsomal and recombinant P450 reactions, the formation rate (V) of 5-OH flunixin, oxyphenbutazone, and gamma-hydroxy phenylbutazone at the respective substrate concentrations (C) was determined and plotted. Non-linear regression analysis was used to determine kinetic parameters (Vmax and Km) using the Origin Pro software (Northampton, MA). For liver microsomal incubations, the data were fit to the Michaelis-Menten equation:
or a substrate inhibition equation:
where Ki represents concentration of inhibitor at which under saturating substrate conditions, the reaction rate is half of Vmax. For recombinant P450 assays, the data were fit to both a Michalis-Menten equation and an equation describing enzyme reactions with biphasic kinetics:
where Vmax1 is the maximum enzyme velocity of the high-affinity phase, Vmax2 is the maximum velocity of the low-affinity phase, Km1 is the concentration of substrate to achieve half of Vmax1 for the high-affinity phase, and Km2 is the concentration of substrate to achieve half of Vmax2 for the high-affinity phase. The model of best fit was determined based on visual observation of the fitted curve and Akaike’s Information Criterion (AIC) values.
3 |. RESULTS
3.1 |. Kinetics of flunixin meglumine and phenylbutazone metabolism in equine liver microsomes
Incubation of FM with equine liver microsomes generated the metabolite 5-OH flunixin. The kinetic plots for 5-OH flunixin generated in the microsomal incubations are depicted in Figure 3. The formation of 5-OH flunixin conformed to saturable kinetics with a slight decrease in the production of the metabolite starting with the incubation containing 200 μM from one horse and greater inhibition observed at 400 and 800 μM in both sets of liver microsomes. Data generated from microsomal incubations with FM were best fit by a substrate inhibition model. Kinetic parameters are summarized in Table 1.
FIGURE 3.
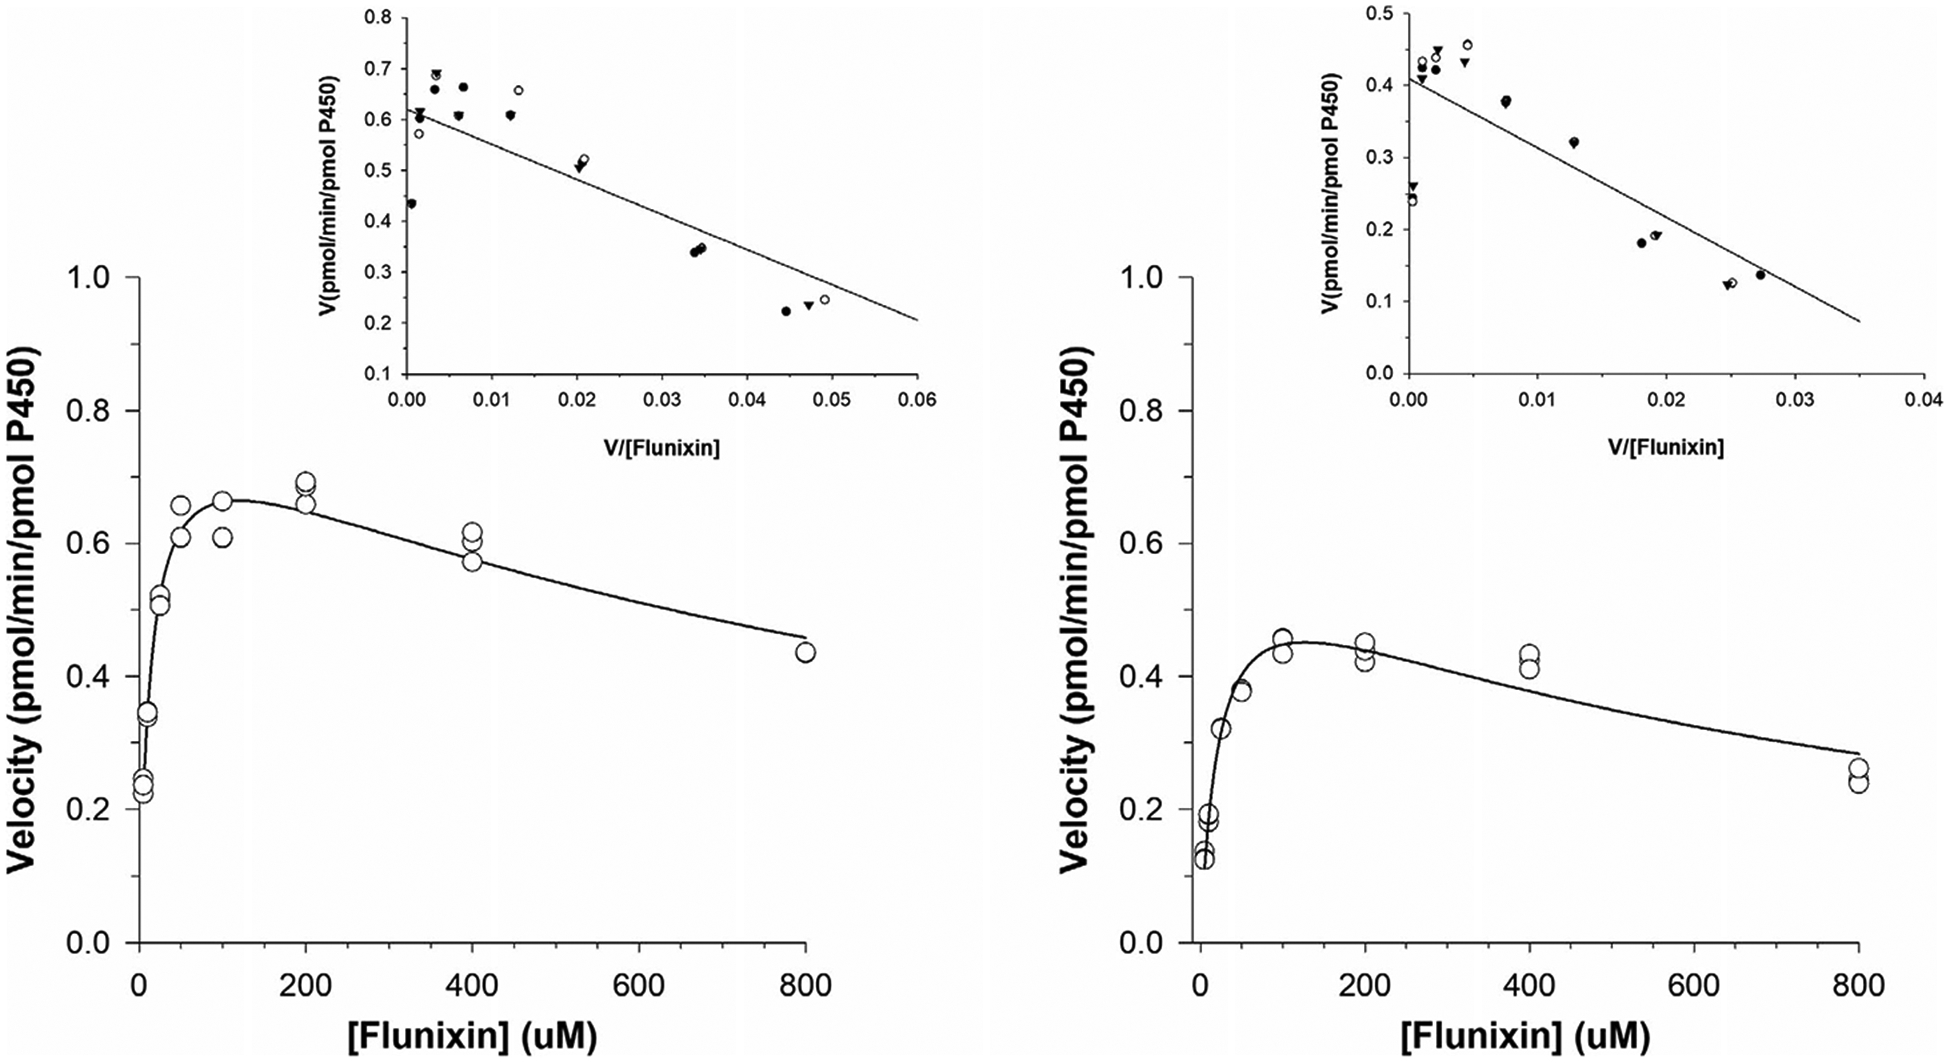
Kinetic plots for the determination of the apparent Km and Vmax values for flunixin metabolism to 5-OH flunixin by equine liver microsomes. Plots (left and right) represent incubations in liver microsomes collected from two different horses. Incubations from each horse were run concurrently and carried out in triplicate
TABLE 1.
Estimates of kinetic parameters for 5-OH flunixin (a) and oxyphenbutazone and gamma-hydroxy phenylbutazone (b) formation in incubations with equine liver microsomes and several recombinant equine P450s
| (a) | Liver microsomes | CYP1A1 | CYP3A93 | CYP3A94 | CYP3A95 | CYP3A97 |
|---|---|---|---|---|---|---|
| 5-OH flunixin | ||||||
| Best fit model | Substrate Inhibition | Biphasic | Biphasic | Michaelis-Menten | Michaelis-Menten | Michaelis-Menten |
| Vmax (or Vmax1)a | 0.613 (horse 1) 0.803 (horse 2) |
1.39 | 0.148 | 1.39 | 0.675 | 0.450 |
| Km (or Km1)a | 22.6 (horse 1 13.1 (horse 2) |
494.9 | 37.6 | 828.3 | 928.2 | 4.07 |
| Vmax2a | – | 0.665 | 2.32 | – | – | – |
| Km2a | – | 546.6 | 1539.8 | – | – | – |
| 709.8 (horse 1) 1,189.8 (horse 2) |
– | – | – | – | – |
| (b) | Liver microsomes | CYP3A97 |
|---|---|---|
| Oxyphenbutazone | ||
| Best fit model | Michaelis-Menten | Michaelis-Menten |
| Vmaxa | 1.72 (horse 1) 0.279 (horse 2) |
2.66 |
| Kma | 22.0 (horse 1) 18.9 (horse 2) |
47.4 |
| Gamma-hydroxy phenylbutazone | ||
| Best fit model | Michaelis-Menten | – |
| Vmaxa | 1.56 (horse 1) 0.218 (horse 2) |
– |
| Kma | 29.2 (horse 1) 79.3 (horse 2) |
– |
Note: —, not applicable.
The units for Vmax and Km/Ki are pmol/min/pmol P450 and μM, respectively.
Microsomal incubations with PBZ generated two metabolites, oxyphenbutazone and γ-hydroxy phenylbutazone. Data for both metabolites were best fit by a simple Michaelis-Menten equation (Table 1; Figure 4).
FIGURE 4.

Kinetic plots for the determination of the apparent Km and Vmax values for metabolism of phenylbutazone to oxyphenbutazone (a) and gamma-hydroxy phenylbutazone (b) by equine liver microsomes. Plots (left and right) represent incubations in liver microsomes collected from two different horses. Incubations from each horse were run concurrently and carried out in triplicate
3.2 |. cDNA-expressed equine P450s
Recombinant baculovirus-expressed equine P450s were used to identify the specific P450 isoforms that were responsible for catalyzing the conversion of FM to 5-OH flunixin and PBZ to oxyphenbutazone and gamma-hydroxy phenylbutazone. Several equine CYP3A isoforms as well as CYP1A1 were capable of generating 5-OH flunixin when incubated with FM (Table 1). Of all the recombinant P450s tested, CYP3A97 was the only P450 that generated oxyphenbutazone when incubated with phenylbutazone. Gamma-hydroxy phenylbutazone, the second metabolite identified in microsomal incubations with PBZ, was not generated by any of the recombinant P450s tested.
Plots of the formation rate of 5-OH flunixin versus substrate concentration for CYP1A1 and CYP3A93, 3A94, 3A95, and 3A97 are depicted in Figure 5. Plots for CYP1A1 and CYP3A93 showed a profile characteristic of biphasic kinetics (Figure 5), and data were best fit by a biphasic equation (Table 1) while kinetic parameters for the other enzymes were best fit by the Michaelis-Menten equation (Table 1). The plot of the formation rate of oxyphenbutazone versus PBZ concentrations by CYP3A97 is depicted in Figure 6 and the kinetic parameters calculated using the Michaelis-Menten equation are listed in Table 1.
FIGURE 5.

Kinetic plots of substrate concentrations versus the rate of the reaction for generation of 5-OH flunixin by baculovirus-expressed equine CYP450 enzymes following incubation with flunixin meglumine. Triplicate incubations were performed concurrently at each substrate concentrations
FIGURE 6.

Kinetic plots of substrate concentrations versus the rate of the reaction for generation of oxyphenbutazone by baculovirus-expressed equine CYP3A97 enzymes following incubation with phenylbutazone. Triplicate incubations were performed concurrently at each substrate concentration
3.3 |. Cytochrome P450 inhibition assays
Gamma-hydroxy phenylbutazone formation in liver microsomes was inhibited by the CYP1A2 inhibitor, alpha-naphthoflavone (79% compared to control incubations) and the CYP3A4 inhibitor, ketoconazole (62% compared to control incubations; Figure 7). Oxyphenbutazone production was decreased by 53% in microsomal incubations with the CYP2C8/9 inhibitor, montelukast (Figure 7).
FIGURE 7.

Generation of gamma-hydroxy phenylbutazone and oxyphenbutazone in equine liver microsomal incubations containing known inhibitors of human CYP450 enzymes. Metabolite production is expressed as a percentage compared to control (no inhibitor) incubations
Production of oxyphenbutazone by recombinant CYP3A97 was inhibited by 85% in the presence of montelukast, compared to control (Figure 7). Alpha-naphthoflavone increased production of oxyphenbutazone by 150% compared to control (Figure 7).
3.4 |. Effect of FMO enzyme inhibition on production of PBZ metabolites
Concentrations of oxyphenbutazone and gamma-hydroxy phenylbutazone in microsomal incubations containing PBZ and the FMO inhibitor, methimazole were not different from control incubations (devoid of methimazole). Similarly, concentrations of both metabolites in incubations with heat-inactivated microsomes and PBZ were comparable to incubations with non-heat-inactivated microsomes.
4 |. DISCUSSION
In equine medicine, the use of NSAIDs, both as sole agents and in combination with other therapeutic medications, is common and can be associated with life-threatening side effects, and therefore, a thorough understanding of their metabolism is imperative. The current study describes the in vitro metabolism and reports the specific metabolic enzymes that contribute to the biotransformation of two commonly used NSAIDs in horses.
Equine liver microsomal incubations containing either FM or PBZ were used to identify the spectrum of metabolites produced in vitro. For both compounds, the metabolites generated were in agreement with those reported in in vivo pharmacokinetic and drug metabolism studies (Knych et al., 2015; Sams et al., 1999; Tobin et al., 1986). Although the metabolites generated in liver microsomes were the same as those generated in vivo, it is prudent to note that other tissues, notably the gastrointestinal mucosa, contribute to the metabolic profile observed following oral administration in an in vivo model. Concentrations of 5-OH flunixin, the major metabolite of FM, increased in a linear fashion at FM concentrations ranging from 5 to 200 μM, suggesting first order kinetics within this range. At substrate concentrations above 200 μM, the formation of 5-OH flunixin declined, suggesting metabolic inhibition at higher concentrations. Mechanistic inhibition, a type of metabolic enzyme inhibition, whereby metabolites generated as part of the biotransformation process inhibit further metabolism of the parent compound has been described (Silverman, 1995). While further study would be necessary to determine whether this is the case for FM, it is plausible that 5-OH flunixin acts as a mechanistic inhibitor, leading to enzyme inhibition and a subsequent decrease in the rate of metabolism of FM. Although the clinical relevance of this auto-inhibition is not clear, a number of published studies describe linear elimination in vivo when FM is administered at therapeutic concentrations (Knych et al., 2015; Sams et al., 1999) suggesting that, within the therapeutic range, this effect may not have clinical implications.
Microsomal incubations were carried out with microsomes harvested from two different horses. With both drugs, there were noticeable differences in the rate of metabolism between horses. In vivo, differences in metabolism and ultimately drug clearance have been attributed to age, increased or decreased levels of metabolic enzyme activity as a result of other drugs or dietary components and/or differing metabolic capabilities due to genetic polymorphisms. Induction or inhibition of metabolic enzymes is unlikely to explain the differences in metabolic activity noted in the current study as the horses from which microsomes were harvested had not received any medications for a minimum of 4 weeks prior to euthanasia. Additionally, P450 activity was measured and the rate of the reaction corrected for activity. Although horses from which microsomes were isolated in the current study were not genotyped, genetic differences offer a plausible explanation for the disparity in metabolic activity between horses and further study of the implications of presumed polymorphisms on drug metabolism in horses is warranted.
Baculovirus-expressed recombinant equine P450s were utilized to determine the specific enzyme/s responsible for metabolism of FM and PBZ in the horse. Although the enzymes responsible for metabolism of FM have not been reported, members of the CYP2C family are predominately responsible for the metabolism of NSAIDs in humans (Blanco, Martinez, Garcia-Martin, & Agundez, 2008). In the current study, incubation of FM with CYP2C92, the equine orthologue to CYP2C9 (DiMaio Knych, DeStefano Shields, Buckpitt, & Stanley, 2009) did not generate any measurable metabolites. Instead, members of the equine CYP3A family and cytochrome P450 1A1 were identified as the major enzymes responsible for generation of 5-OH flunixin. In humans, cytochrome P450 3A4 is considered a “secondary” enzyme for metabolism of NSAIDs (Blanco et al., 2008). In the current study, CYP1A1 and CYP3A93, which appears to play the greatest role in CYP3A-mediated metabolism of FM, demonstrated biphasic kinetics, suggestive of multiple substrate binding sites with differing Vmax and Km values (Korzekwa et al., 1998). This behavior has been reported previously for both CYP1A1 and CYP3A4 in other species (Inouye, Mizokawa, Saito, Tonomura, & Ohkawa, 2000; Korzekwa et al., 1998). Although equine CYP1A1 is capable of 5-hydroxylation of FM, it should be noted that in other species, this enzyme is not constitutively expressed (Martinez et al., 2019; Uno et al., 2009), and activity is attributable to induction by other chemicals (Nebert, Dalton, Okey, & Gonazlez, 2004). If the same is found to be true in horses, FM 5-hydroxylation is most likely mediated primarily by equine CYP3A isoforms with additional contribution from CYP1A1 in horses exposed to CYP1A1 inducers.
Cytochrome P450 P3A97 was the only enzyme capable of generating oxyphenbutazone from PBZ in vitro. Although high concentrations were detected in equine liver microsomes, the second metabolite, gamma-hydroxy phenylbutazone, was not detected in incubations with any of the recombinant equine P450s tested, suggesting that this metabolite is produced by a non-P450 phase 1 enzyme. In contrast to this theory, however, was the finding that addition of inhibitors of human CYP1A2 (alpha-naphthoflavone) and CYP3A4 (ketoconazole) to microsomal incubations containing PBZ greatly decreased the rate of production of gamma-hydroxy phenylbutazone. These conflicting findings can likely be explained by differential selectivity of P450 inhibitors between species. This hypothesis is supported by a previous study whereby investigators demonstrated that compounds that are known P450 inhibitors in human liver microsomes did not inhibit metabolic activity in rat liver microsomes (Eagling, Tjia, & Back, 1998). Although a large number of P450s, including those responsible for the majority of therapeutic drug metabolism in other species, were assessed, it is possible that the generation of gamma-hydroxy phenylbutazone in horses following administration of PBZ is carried out by an equine CYP450 that has yet to be expressed and/or characterized.
Although little is known about the role of FMOs in drug metabolism in horses, these enzymes are present in the microsomal fraction and capable of oxidation reactions. To test the hypothesis that this group of enzymes may contribute to generation of gamma-hydroxy phenylbutazone, methimazole, an inhibitor of FMO activity in humans (Jones et al., 2017) was added to microsomal incubations containing PBZ. Gamma-hydroxy phenylbutazone was observed in comparable quantities as that observed in non-treated liver microsomes, suggesting that FMO enzymes do not play a significant role in the biotransformation of PBZ to this metabolite. This was further supported by the apparent lack of inhibition of gamma-hydroxy phenylbutazone production using heat-inactivated liver microsomes, which deactivates FMO enzymes while preserving CYP450 activity (Jones et al., 2017).
In the presently reported study, oxyphenbutazone production is attributed to CYP3A97. Interestingly, metabolism was significantly reduced, compared to control, in liver microsome and recombinant CYP3A97 incubations containing the CYP2C8/9 inhibitor montelukast. As discussed previously, although CYP2C9 is important to the metabolism of several NSAIDs, CYP2C92 did not appear to play a role in PBZ metabolism in the current study. However, although montelukast is considered a CYP2C8/9 inhibitor, recent studies have questioned this selectivity (Cardoso, Oliveira, Lu, & Desta, 2015). Importantly, CYP3A4, an orthologue to equine CYP3A97, has been found to contribute to the metabolism of montelukast in humans (Cardoso et al., 2015). If metabolism is similar in horses, competition between montelukast and PBZ for CYP3A97 binding sites may explain the decreased rate of PBZ biotransformation in the presence of montelukast observed in the current study. The increase in oxyphenbutazone production in the presence of alpha-naphthoflavone may be a result of stimulation of CYP3A97 as has been reported for CYP3A4 (Koley, Buters, Robinson, Markowitz, & Friedman, 1997).
In the current study, the phase I enzymes responsible for biotransformation of FM to its major metabolite and PBZ to its active metabolite have been identified and enzymatic activity described. Although additional validation is required, the current study represents an important first step in identifying and characterizing the enzymes responsible for the metabolism of two commonly used NSAIDs in equine medicine.
ACKNOWLEDGMENTS
The authors would like to thank Drs Alan Buckpitt and Alan Conley and Sandy Yim. This work was supported by funds from the California Horse Racing Board.
Footnotes
CONFLICT OF INTEREST
All authors declare no conflicts of interest.
REFERENCES
- Alvares AP, Kapelner S, Sassa S, & Kappas A (1975). Drug metabolism in normal children, lead-poisoned children, and normal adults. Clinical Pharmacology and Therapeutics, 17(2), 179–183. 10.1002/cpt1975172179 [DOI] [PubMed] [Google Scholar]
- Blanco G, Martinez C, Garcia-Martin E, & Agundez J (2008). Cytochrome P450 gene polymorphisms and variability in response to NSAIDs. Clinical Research and Regulatory Affairs, 22(2), 57–81. 10.1080/10601330500214559 [DOI] [Google Scholar]
- Cardoso JDO, Oliveira RV, Lu JBL, & Desta Z (2015). In vitro metabolism of montelukast by cytochrome P450s and UDP-Glucuronosyltransferases. Drug Metabolism and Disposition: The Biological Fate of Chemicals, 43(12), 1905–1916. 10.1124/dmd.115.065763 [DOI] [PMC free article] [PubMed] [Google Scholar]
- DiMaio Knych HK, DeStefano Shields C, Buckpitt AR, & Stanley SD (2009). Equine cytochrome P450 2C92: cDNA cloning, expression and initial characterization. Archives of Biochemistry and Biophysics, 485(1), 49–55. 10.1016/j.abb.2009.02.009 [DOI] [PubMed] [Google Scholar]
- Eagling VA, Tjia JF, & Back DJ (1998). Differential selectivity of cytochrome P450 inhibitors against probe substrates in human and rat liver microsomes. British Journal of Clinical Pharmacology, 45(2), 107–114. 10.1046/j.1365-2125.1998.00679.x [DOI] [PMC free article] [PubMed] [Google Scholar]
- Gerring EL, Lees P, & Taylor JB (1981). Pharmacokinetics of phenylbutazone and its metabolites in the horse. Equine Veterinary Journal, 13, 152–157. 10.1111/j.2042-3306.1981.tb03472.x [DOI] [PubMed] [Google Scholar]
- Howard JT, Ashwell MS, Baynes RE, Brooks JD, Yeatts JL, & Maltecca C (2017). Gene co-expression network analysis identifies porcine genes associated with variation in metabolizing fenbendazole and flunixin meglumine in the liver. Scientific Reports, 7(1), 1357 10.1038/s41598-017-01526-5 [DOI] [PMC free article] [PubMed] [Google Scholar]
- Howard JT, O’Nan AT, Maltecca C, Baynes RE, & Ashwell MS (2015). Differential gene expression across breed and sex in commercial pigs administered fenbendazole and flunixin meglumine. PLoS One, 10(9), e0137830 10.1371/journal.pone.0137830 [DOI] [PMC free article] [PubMed] [Google Scholar]
- Inouye K, Mizokawa T, Saito A, Tonomura B, & Ohkawa H (2000). Biphasic kinetic behavior of rat cytochrome P-4501A1-dependent monooxygenation in recombinant yeast microsomes. Biochimica Et Biophysica Acta, 1481(2), 265–272. 10.1016/s0167-4838(00)00135-7 [DOI] [PubMed] [Google Scholar]
- Jaussaud P, Courtot D, Guyot JL, & Paris J (1987). Identification of a flunixin metabolite in the horse by gas chromatography-mass spectrometry. Journal of Chromatography B: Biomedical Sciences and Applications, 423, 123–130. 10.1016/0378-4347(87)80334-1 [DOI] [PubMed] [Google Scholar]
- Jones BC, Srivastava A, Colclough N, Wilson J, Reddy VP, Amberntsson S, & Li D (2017). An investigation into the prediction of in vivo clearance for a range of flavin-containing monooxygenase substrates. Drug Metabolism and Disposition, 45(10), 1060–1067. 10.1124/dmd.117.077396 [DOI] [PubMed] [Google Scholar]
- Knych HK, Arthur RM, Mckemie DS, & Chapman N (2015). Pharmacokinetics and effects on thromboxane B2 production following intravenous administration of flunixin meglumine to exercised thoroughbred horses. Journal of Veterinary Pharmacology and Therapeutics, 38(4), 313–320. 10.1111/jvp.12197 [DOI] [PubMed] [Google Scholar]
- Knych HK, Arthur RM, McKemie DS, Seminoff K, Hamamoto-Hardman B, & Kass PH (2019). Phenylbutazone blood and urine concentrations, pharmacokinetics, and effects on biomarkers of inflammation in horses following intravenous and oral administration of clinical doses. Drug Testing and Analysis, 11(6), 792–803. 10.1002/dta.2553 [DOI] [PubMed] [Google Scholar]
- Knych HK, Baden RW, Gretler SR, & McKemie DS (2019). Characterization of the in vitro CYP450 mediated metabolism of the polymorphic CYP2D6 probe drug codeine in horses. Biochemical Pharmacology, 168, 184–192. 10.1016/j.bcp.2019.07.005 [DOI] [PubMed] [Google Scholar]
- Knych HK, Stanley SD, Seminoff KN, McKemie DS, & Kass PH (2016). Pharmacokinetics of methocarbamol and phenylbutazone in exercised Thoroughbred horses. Journal of Veterinary Pharmacology and Therapeutics, 39(5), 469–477. 10.1111/jvp.12298 [DOI] [PubMed] [Google Scholar]
- Koley AP, Buters JT, Robinson RC, Markowitz A, & Friedman FK (1997). Differential mechanisms of cytochrome P450 inhibition and activation by alpha-naphthoflavone. The Journal of Biological Chemistry, 272(6), 3149–3152. 10.1074/jbc.272.6.3149 [DOI] [PubMed] [Google Scholar]
- Korzekwa KR, Krishnamachary N, Shou M, Ogai A, Parise RA, Rettie AE, … Tracy TS (1998). Evaluation of atypical cytochrome P450 kinetics with two-substrate models: Evidence that multiple substrates can simultaneously bind to cytochrome P450 active sites †. Biochemistry, 37(12), 4137–4147. 10.1021/bi9715627 [DOI] [PubMed] [Google Scholar]
- Lees P, Ewins CP, Taylor JBO, & Sedgwick AD (1987). Serum thromboxane in the horse and its inhibition by aspirin, phenylbutazone and flunixin. British Veterinary Journal, 143(5), 462–476. 10.1016/0007-1935(87)90024-8 [DOI] [PubMed] [Google Scholar]
- Lees P, Landoni MF, Giraudel J, & Touitain PL (2004). Pharmacodynamics and pharmacokinetics of nonsteroidal anti-inflammatory drugs in species of veterinary interest. Journal of Veterinary Pharmacology and Therapeutics, 27(6), 479–490. 10.1111/j.1365-2885.2004.00617.x [DOI] [PubMed] [Google Scholar]
- Lees P, Taylor JB, Maitho TE, Millar JD, & Higgins AJ (1987). Metabolism, excretion, pharmacokinetics and tissue residues of phenylbutazone in the horse. The Cornell Veterinarian, 77(2), 192–211. [PubMed] [Google Scholar]
- Martinez SE, Shi J, Zhu HJ, Perez Jiminnez TE, Zhu Z, & Court MH (2019). Absolute quantitation of drug-metabolizing cytochrome P450 enzymes and accessory proteins in dog liver microsomes using label-free standard-free analysis reveals interbreed variability. Drug Metabolism and Disposition: The Biological Fate of Chemicals, 47(11), 1314–1324. [DOI] [PMC free article] [PubMed] [Google Scholar]
- Nebert DW, Dalton TP, Okey AB, & Gonazlez FJ (2004). Role of aryl hydrocarbon receptor-mediated induction of the CYP1 enzymes in environmental toxicity and cancer. The Journal of Biological Chemistry, 279(23), 23847–23850. 10.1074/jbc.R400004200 [DOI] [PubMed] [Google Scholar]
- Sams RA, Gerken DF, & Ashcraft SM (1999). Detection and identification of flunixin after multiple intravenous and intramuscular doses to horses. Journal of Analytical Toxicology, 23, 372–379. 10.1093/jat/23.5.372 [DOI] [PubMed] [Google Scholar]
- Semrad SD, Sams RA, Harris ON, & Ashcraft SM (1993). Effects of concurrent administration of phenylbutazone and flunixin meglumine on pharmacokinetic variables and in vitro generation of thromboxane B2 in mares. American Journal of Veterinary Research, 54(11), 1901–1905. [PubMed] [Google Scholar]
- Shappell NW, Duke SE, & Bartholomay KA (2019). In vitro subcellular characterization of flunixin liver metabolism in heifers, steers, and cows. Research in Veterinary Science, 123, 118–123. 10.1016/J.RVSC.2018.12.012 [DOI] [PubMed] [Google Scholar]
- Silverman R (1995). Mechanism-based enzyme inactivators. Methods in Enzymology, 249, 240–283. [DOI] [PubMed] [Google Scholar]
- Tobin T, Blake JW, & Valentine R (1977). Drug interactions in the horse: Effects of chloramphenicol, quinidine, and oxyphenbutazone on phenylbutazone metabolism. American Journal of Veterinary Research, 38(1), 123–127. [PubMed] [Google Scholar]
- Tobin T, Chay S, Kamerling S, Woods WE, Weckman TJ, Blake JW, & Lees P (1986). Phenylbutazone in the horse: A review. Journal of Veterinary Pharmacology and Therapeutics, 9(1), 1–25. 10.1111/j.1365-2885.1986.tb00008.x [DOI] [PubMed] [Google Scholar]
- Uno S, Endo K, Ishida Y, Tateno C, Makishima M, Yoshizato K, & Nebert DW (2009). CYP1A1 and CYP1A2 expression: Comparing “Humanized” mouse lines and wild-type mice; comparing human and mouse Hepatoma-derived cell lines. Toxicology and Applied Pharmacology, 237(1), 119–126. 10.1016/j.taap.2009.03.001 [DOI] [PMC free article] [PubMed] [Google Scholar]