Abstract
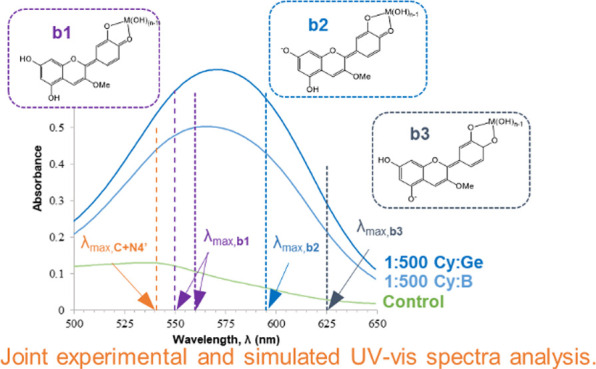
The occurrence of anthocyanin (ACN) and metal (Me) complexes has been widely supported by many research works while the possibility that ACNs bind to metalloids (Mds) is yet to be proven. Here, metalloids (H3BO3 for B; GeO2 for Ge) were added to cyanidin-based solutions at pH 5, 6, and 7 and ACN–Md stoichiometric ratios of 1:1, 1:10, 1:100, and 1:500, and UV–vis transmittance spectroscopy as well as density functional theory (DFT) calculations were performed to test this hypothesis. Ge and B addition caused bathochromic and hyperchromic shifts on ACN UV–vis spectra, particularly pronounced at pH 5 and a 1:500 (ACN:Md) ratio. ACN–Me complexation reactions have been evaluated where Ge showed a higher capability to bind to ACNs than B. Among the complexes envisioned, those labeled as b1, b2, and b3 feature UV–vis spectra compatible with experiments. The combination of experimental and computational data offers for the first time evidence of the formation of ACN–Md complexes.
Keywords: anthocyanin−metalloid complex, bathochromic shift, hyperchromic effect, molecular absorption simulations, molecular modeling
Introduction
Anthocyanins (ACN) are a conspicuous class of water-soluble pigments (ranging from pale pink, to red–purple, and blue) which are responsible for the marvelous color versatility of the plant kingdom.1 ACN belongs to the family of flavonoids, likely the most studied pathway of secondary metabolism in planta(2) and are synthesized in a wide range of plant cell and tissues of different plant organs including leaves, flowers, fruits, roots, tubers, and stems.3−5
Anthocyanins are di or trihydroxy B-ring-substituted flavonoids containing a flavylium cation which, owing to its conjugated double bonds, absorbs visible light with a peak in the 500–550 nm waveband.6 The wide range of anthocyanin-derived colors depends on the degree of hydroxylation and the number and/or type of substituted groups. To date, 17 anthocyanidins have been isolated, but most of these are found only in reproductive structures and only six aglycones (cyanidin, delphinidin, malvidin, pelargonidin, peonidin, and petunidin) have been identified in vegetative organs.7 In addition, though only simpler anthocyanins have been considered to be present in leaves (with respect to those in flowers), in recent years some findings have opened the possibility that anthocyanins are present also in leaf tissues as most complex structures. For example, acylated anthocyanins with hydroxycinnamic acids were found in sweet basil leaves, which, beside strong absorbance in visible wavebands, also increased the UV absorbance.8
The different color of the anthocyanins depends on the pH which is responsible for the protonation/deprotonation of the flavylium ion, which predominates at pH < 2 and shows red color, whereas at pH > 2 a series of reversible (to some extent) chemical transformations occurs. For example, at pH values from 2 to 6 the hydration of the flavylium cation leads to the prevalent formation of the colorless hemiketal form, which transforms tautomerically into yellow cis-chalcone and isomerizes to trans-chalcone (Scheme 1). Proton transfer turns the red flavylium ion into a neutral quinoidal base, prevalently characterized by purple tonalities. At pH 6–8, blue forms of an anionic quinoidal base would be predominant,6 though they would quickly experience degradation under physiological conditions.9
Scheme 1. pH Equilibria for the Cyanidin-3-OMe Model System.
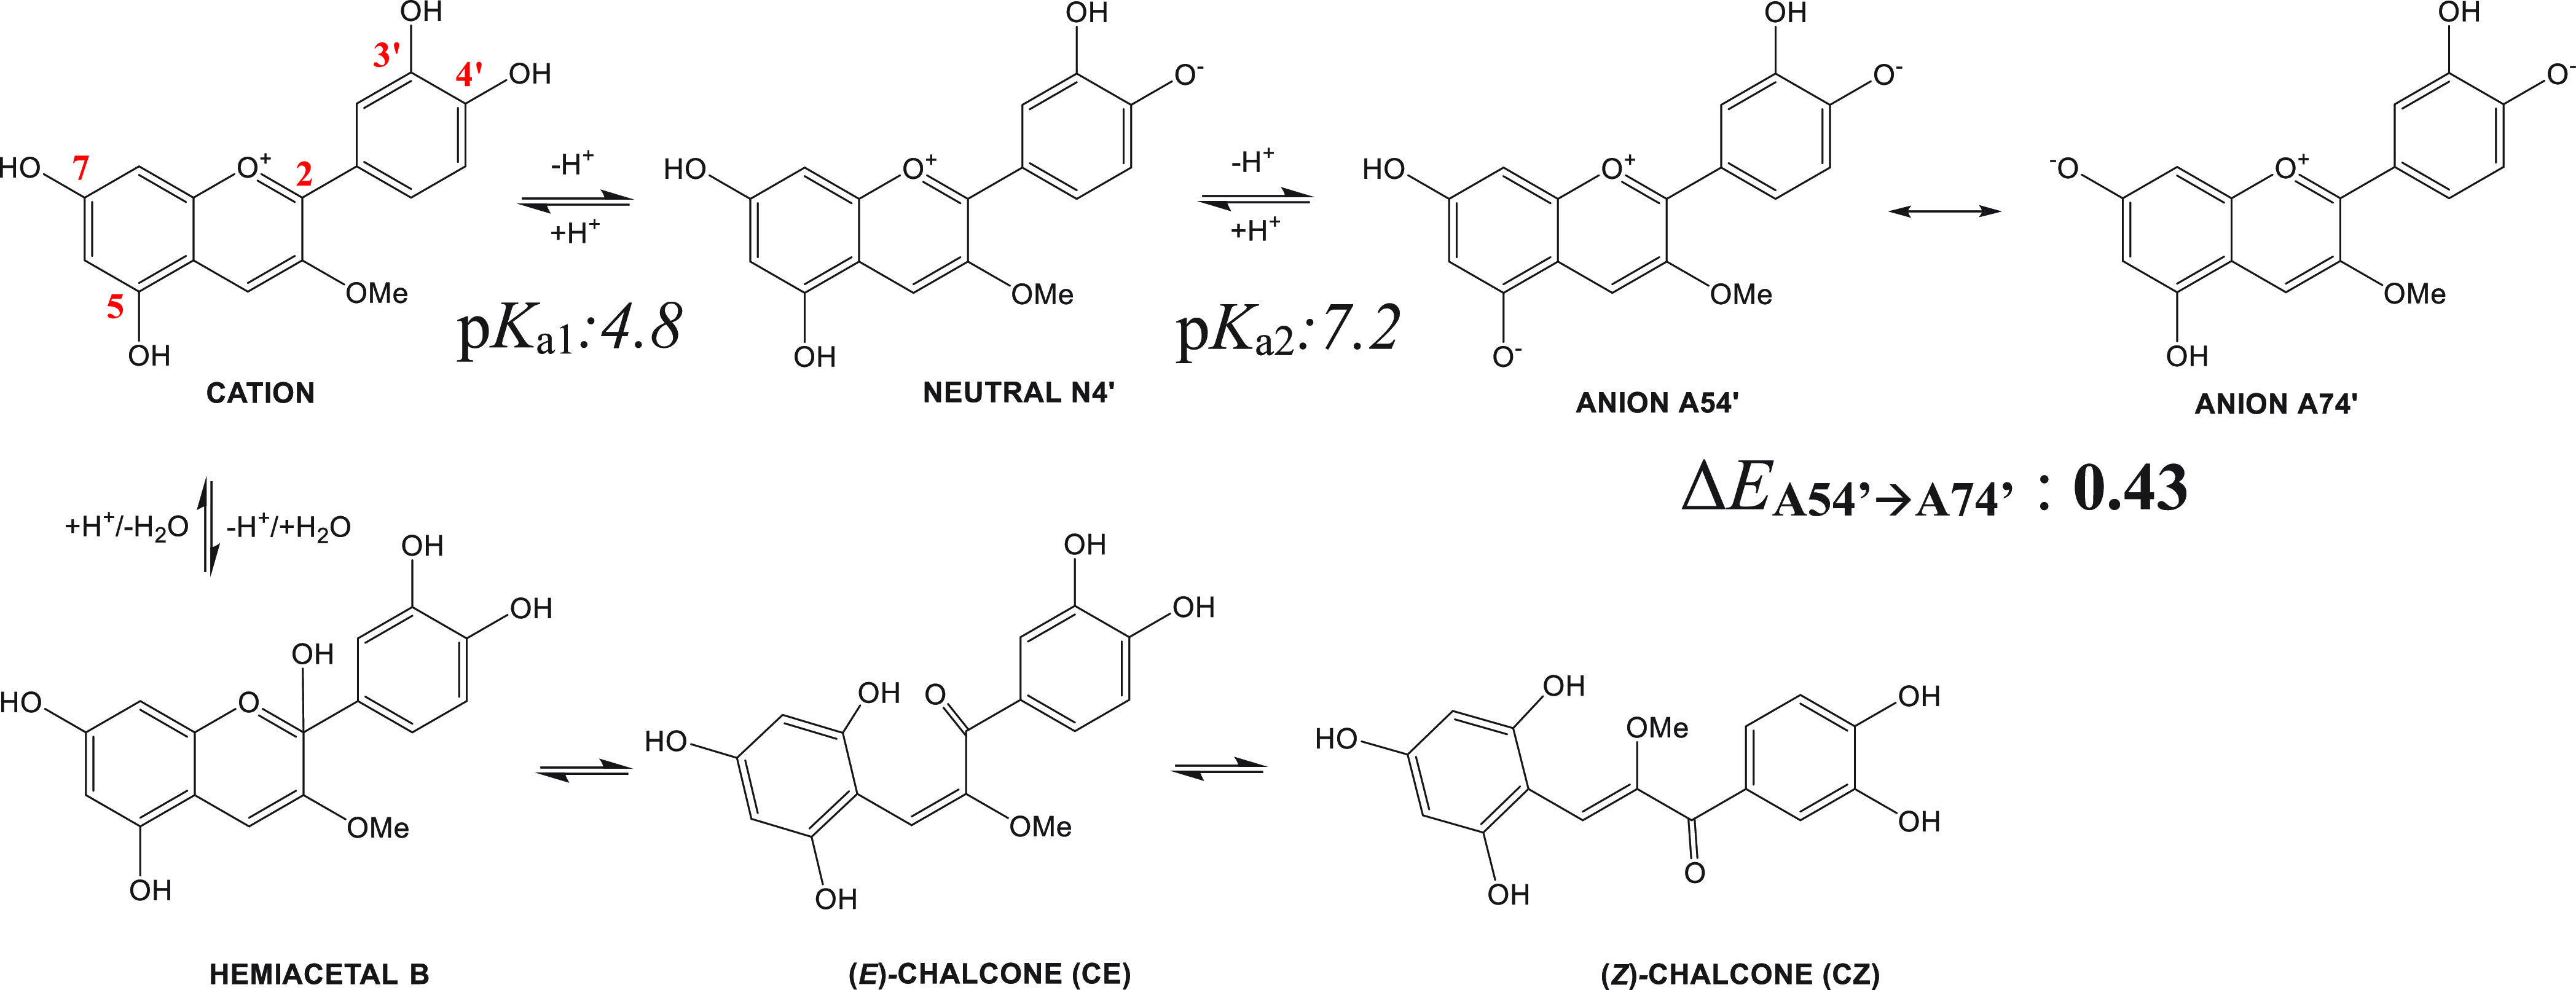
Estimated (see text) pKa values (pKa1(cation→N4′) 4.8 and pKa2(N4′→A54′) 7.2) and energy difference between tautomers of the anion form, ΔEA54′→A74′ (in bold, kcal·mol–1), are shown.
Like other dihydroxy B-ring substituted flavonoids, ACNs have the ability to bind metal ions, a property that has been exploited for a variety of purposes. For example, the metal binding ability may be used to stabilize ACNs from plant food sources, or to modify their colors for using them as food colorants.10−12 The complexation of metals with cyanidin derivatives can also be used as a simple, sensitive, cheap, and rapid method for determination of the concentration of several metals in biological and environmental samples using UV–vis spectroscopy.13,14
Far less information is available on the ecological significance of ACN–metal (ACN–Men+) complexes in plant-environment interactions. For example, metallo-anthocyanins, supramolecular pigment complexes, consisting of stoichiometric amounts of anthocyanins, flavones, and metal ions,15,16 are involved in the copigmentation phenomenon that leads to blue-pigmented petals, which may facilitate specific plant–pollinator interactions. However, ACN–Men+ complexes have been found not only in the form of supramolecules, but also as more simple coordination compounds and ACN–Men+ formation and compartmentation into the vacuole have also been proposed to be part of an orchestrated detoxification mechanism in plants which experience metal/metalloid excess.2,17,18
The metal-chelating ability of anthocyanins depends on the 3′,4′-O-dihydroxyl group in the B ring of the flavonoid skeleton, as also occurs for other flavonoids, such as quercetin derivatives. Binding to Men+ shifts the equilibrium between different structures toward the creation of blue quinoidal form and tends to stabilize the resulting structure. Changes to the conjugation of the chromophore system of ACNs is, in turn, accompanied by chromatic changes that can be detected by UV–vis spectroscopy, which can be considered to be one of the most informative analytical tools to detect ACN–Men+ complexes.19 In addition, theoretical calculations have become ubiquitous and have given support for previous hypotheses.20 Theoretical chemistry offers the possibility of gaining further knowledge at a molecular level of the ACN–Men+ complexation process. Also, molecular absorption simulations,21 on ACN–Men+ model complexes, would help in rationalizing experimental measures with the aim of getting a deeper understanding of this interesting research topic.
Occurrence of ACN–Men+ complexes have been reported for different metals including W,22 Al,23−26 Cd,27,28 Cu,29 Ga,23,29 Fe,30,31 Mo,32 Mg,26 and Zn.28 Conversely, to the best of our knowledge, no studies have been addressed to study the possibility of ACN to form complexes with metalloids.
The aim of the present manuscript is to investigate the possibility that cyanidin-based ACN isolated from Ocimum basilicum cv. “Red Rubin”8 can bind to two metalloids (Mds), namely Ge and B, with the attempt to describe for the first time the possible occurrence of such ACN–Md complexes. If confirmed, this possibility represents a first preliminary result to be confirmed in vivo by future experiments (requiring more complexes analyses) which could be supportive for the higher tolerance of red- than green-leafed cvs of sweet basil to B toxicity.17,18
In addition, though not essential for plants, in the upper continental crust of the Earth, Ge is the 54th most abundant element,33 and the concentration of this metalloid ranges from 1.3 to 1.6 μg·g–1 in the soil, which can be toxic for some plant species.34 Ge can be also recovered as byproduct from silver, copper, and zinc production or from combustion residues (fly ashes) from certain coals, which can contain considerable concentrations of Ge.35 Given that Ge and B share similar transporters, e.g. the aquaporin HvNIP2;1,36 and, likely as a consequence, B and Ge have similar effects in plant metabolism,37 results of the present experiment might also be helpful to future researches dealing with ACN–Ge complexes in plants. Moreover, the results of the present experiment could be useful to exploit anthocyanin–metalloid binding capacity for environmental monitoring, for example as a cheap and reliable methodology to test metalloid accumulation in plant tissues or to generate knowledge in food science, for example to increase the stability of anthocyanins as natural dyes.
Material and Methods
Plant Material
Seeds of O. basilicum cv. “Red Rubin” were purchased from Franchi Sementi (Bergamo, Italy), and experiments were conducted under greenhouse conditions at the facilities of the Department of Agriculture, Food and Environment, University of Pisa, Pisa, Italy (43° 42′ N 10° 25′ E) during the period of June–July 2018.
The seeds were soaked in deionized water for 2 days to synchronize germination and then sown in 1.5 L pots filled with a sandy soil–peat mixture (60:40, v-v). Plants were irrigated with deionized water during the first week after sowing and afterward with a nutrient solution containing the following nutrient concentrations, developed to optimize sweet basil growth: NO3– 14 mM, NH4+ 0.5 mM, P 1.2 mM, K+ 10 mM, Ca2+ 4 mM, Mg2+ 750 μM, Na+ 10 mM, SO42– 1.97 mM, Fe2+ 56 μM, BO33– 23.1 μM, Cu2+ 1 μM, Zn2+ 5 μM, Mn2+ 10 μM, Mo3+ 1 μM. Electrical conductance (EC) was 3.04 dS m–1; pH values were adjusted to 5.2–5.5 with diluted sulfuric acid.
Climatic parameters were continuously monitored by a weather station placed inside the glasshouse. The minimum and ventilation air temperatures were 18 and 28 °C respectively; the maximum temperature reached up to 32–34 °C in sunny hours. Daily global radiation and mean air temperature averaged respectively 13.1 MJ m–2 and 28.2 °C. Leaf samples for anthocyanin extraction were harvested 21 days after sowing, frozen in liquid nitrogen, and stored at −80 °C until extraction.
Anthocyanin Purification and Quantification
Anthocyanins were purified as described by Sigurdson et al.31 and quantitated by the pH differential method as described by Lo Piccolo et al.38 with few modifications. Briefly, fresh leaf material (75 mg) was extracted in acidified methanol (1.0% HCl, v-v) and maintained overnight at room temperature. Their absorbance was recorded at 530 and 700 nm using an Ultrospec 2100 Pro UV–vis spectrophotometer (GE Healthcare Ltd., Chicago, IL). The final absorbance (Af) of diluted samples was calculated as follows:
Total ACN content was expressed as cyanidin-3-O-glucoside (molar extinction coefficient of 34 300 M cm–1 and molecular weight 484.3 g mol–1), and measurements of total anthocyanin content were conducted in triplicate.
Sample Preparation
ACN isolated from Red Rubin leaves were diluted to 50 μM concentrations in 500 mM buffers of either sodium acetate (pH 5–6) or sodium phosphate (pH 7), depending on the pH to test.
Metalloid salt (H3BO3 for B; GeO2 for Ge) were diluted in distilled water to achieve the concentrations of 50 and 500 mM. These salt solutions were then added to the anthocyanin solutions in order to maintain the following stoichiometric ratios: 1:1, 1:10; 1:100; 1:500 [ACN:Md].
High molarity buffers were used to minimize the decrease in pH associated with addition of high metal excesses, and pH was monitored throughout the course of analysis. Control samples (without salt addition) were maintained at the same pH of each sample by using concentrated solutions of HCl or NaOH. All samples were kept under agitation for 20 min using an orbital shaker to favor the ACN–Md binding. Then, the samples were maintained under static conditions for further 20 min at room temperature in the dark prior to spectrophotometric analysis. Five replicates were evaluated for each sample.
Spectrophotometric Analyses
A 1 mL portion of each ACN–Md solution was used to determine their UV–vis spectra (380–700 nm) by transmittance spectrophotometry using an Ultrospec 2100 Pro UV–vis spectrophotometer (GE Healthcare Ltd., Chicago, IL). The spectra were used to point out bathochromic and hypochromic shifts of each ACN–Md solution (with respect to the control solutions). Spectra were captured with a 1 nm·s–1 scanning batch file, and the smoothing function was used to refine spectra graphs. The analyses were carried out at room temperature.
Computational Method and Model Chemical Systems
In order to reduce the computational cost, cyanidin-3-O-glucose is modeled replacing the glucose group attached to O3 by a methyl one as its effect in Cy–metal binding or in color change due to complexation can be assumed to be negligible.20,25,26
All cyanidin-3-O-methyl forms and their metalloid complexes with Ge/B were optimized with the B3LYP density functional as implemented in Gaussian 09.39 The 6-31++g(d,p) basis set was employed for all atoms including the metalloid atom. Solvent effects (water) were included by means of the PCM solvation model.40
UV–vis spectrum simulations were carried out by means of time-dependent (TD)41 B3LYP/6-31++g(d,p)/PCM(water) calculations on previously optimized Cy–Ge/B geometries in order to rationalize experimental data.
Ground state electron densities, ρ(r), of selected Cy–Md complexes, were analyzed within the context of Bader’s quantum theory of atoms in molecules (QTAIM),42,43 with the AIMAll program,44 for bonding characterization through selected descriptors as the electron density, the Laplacian of the electron density, and the total energy density, evaluated at relevant bond critical points (BCPs)—ρb, ∇2ρb, Hb, respectively—as well as integrated atomic properties as the electron charge q(Ω) and delocalization index δ(A, B) which gives the number of electrons that are delocalized between the basins of A and B.
Statistical Analyses
Results of UV–vis analyses are the mean of five replicates for each sample (n = 5). The homoscedasticity of the data was evaluated by a Bartlett’s test and when necessary data were arcsine transformed prior to analyses. Values of hyperchromic and bathochromic shifts were compared by one-way analysis of variance (ANOVA) (2-tailed, p = 0.05) followed by a Fisher’s least significant difference posthoc test (p = 0.05).
Results
Experimental Results
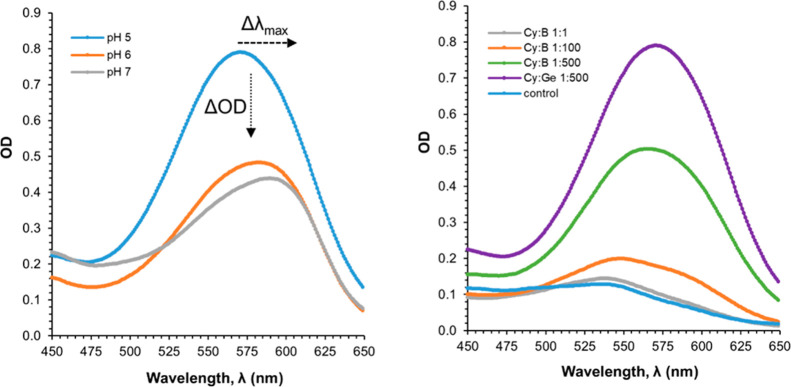
Upon addition of Ge(OH)4 to the cyanidin-based solutions at pH 5 in equimolar concentrations a bathochromic shift of the maximum absorbance wavelength, λmax, from 535 to 571 nm (Δλmax: 33 nm) is noted, as well as an increment in absorbance (hyperchromic effect) of 0.16, measured at 571 nm, when compared to control/cyanidin-containing control solution. Increasing the molar Cy:Ge ratio (from 1:1 up to 1:500) produces further absorbance increments [ΔOD at 571 nm: 0.53 at 1:10, 0.59 at 1:100, and up to 0.66 at 1:500 ratios], but no significant shift of λmax occurs (Δλmax 0.3 nm: Figure 1 and Table S1).
Figure 1.
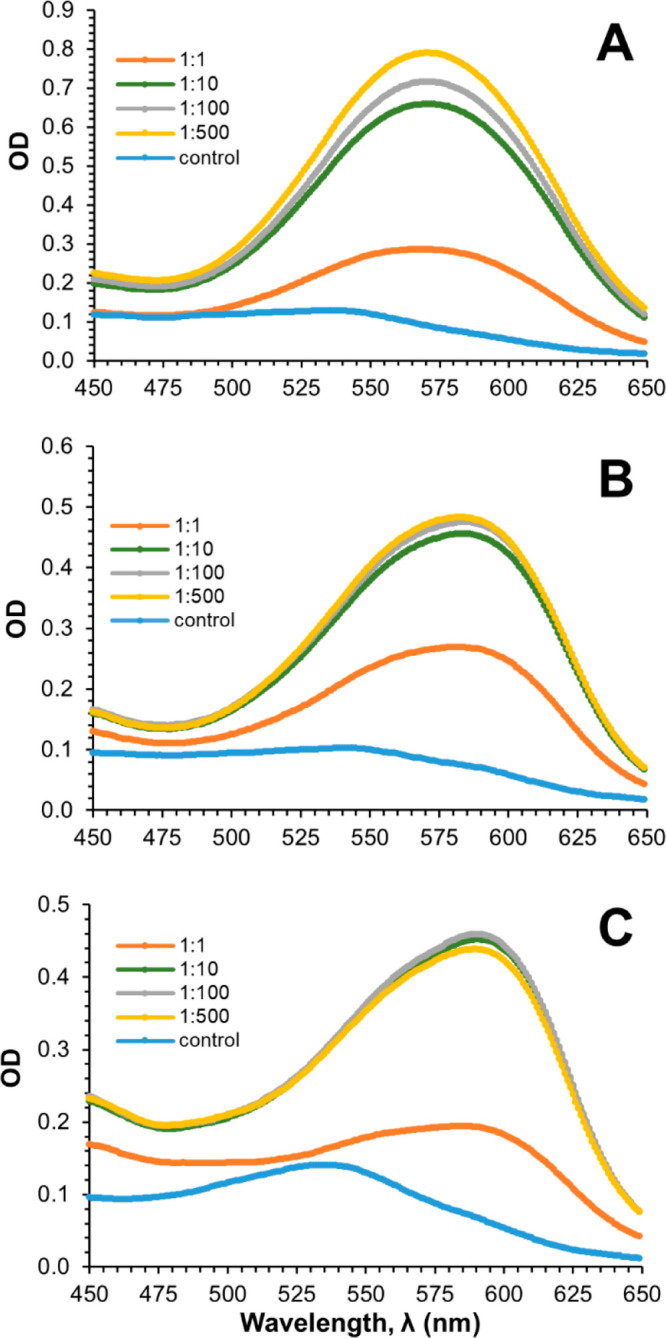
UV–vis spectra for the various cyanidin-based anthocyanins complexed with Ge at different ratios (Cy:Ge). Cy:Ge ratios investigated: 1:1, 1:10, 1:100, and 1:500 at (A) pH 5, (B) pH 6, and (C) pH 7.
The increase of pH from 5 to 7 caused a shift of λmax to longer wavelengths—571, 582, and 590 nm—representing bathochromic shifts, e.g., at a 1:10 ratio, of 36, 43, and 55 nm with regard to the corresponding control solution (Table S1). This can also be observed in Figure 2 (left) where the spectra of the 1:500 solutions at the three pH values tested are compared. It is also noted that the red shift is accompanied by hypochromic effects making solutions bluer but of less intensity (Figure 3) which makes the study at pH 5 more suitable.11,30
Figure 2.
UV–vis spectra for (left) cyanidin-based anthocyanins complexed with Ge at a 1:500 ratio, at the pH values explored (5, 6, and 7) and (right) with B at various Cy:B ratios and comparison with Cy:Ge (1:500) at pH 5.
Figure 3.
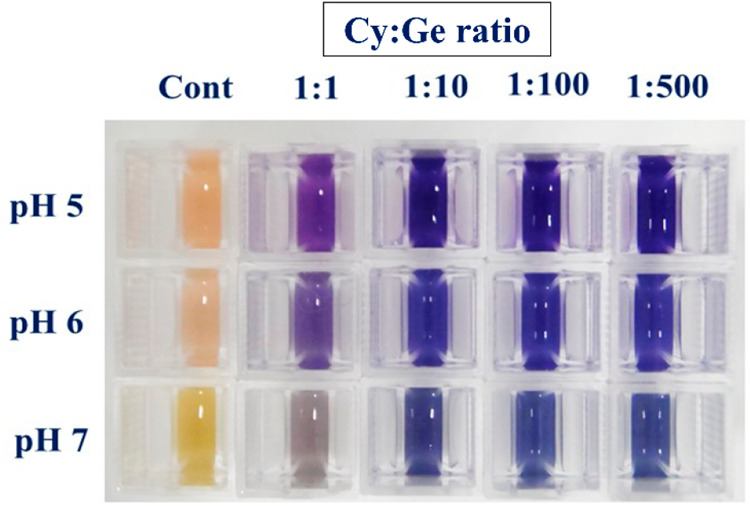
Change in visual appearance of the reaction mixtures of cyanidin-based anthocyanins isolated from Red Rubin sweet basil leaves and Ge ions added with different stoichiometric ratios (1:1, 1:10, 1:100, 1:500; Cy:Ge) at pH 5, 6, and 7.
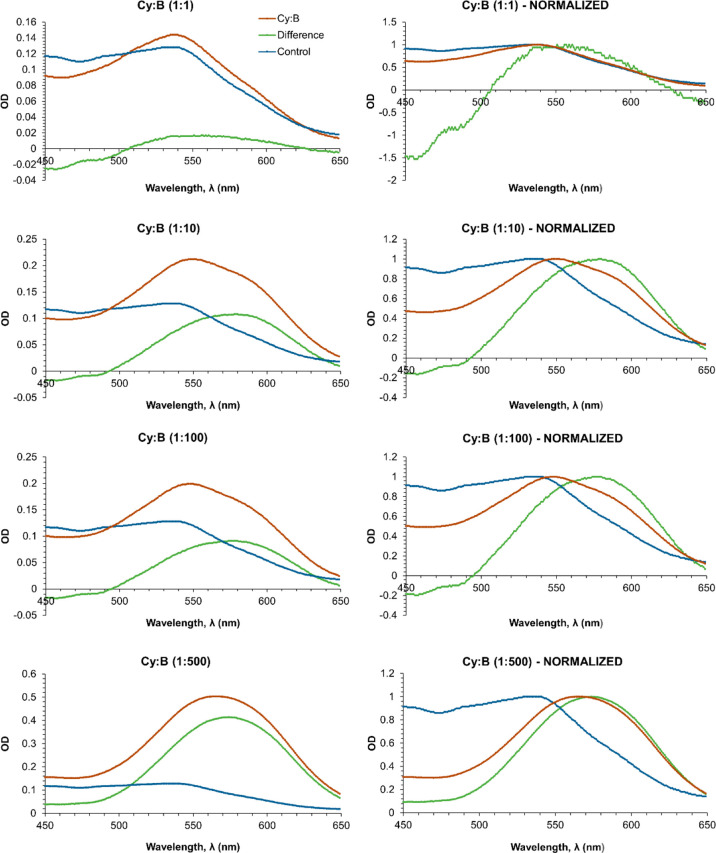
Addition of boric acid to the cyanidin-based anthocyanin solutions (Figure 2, right) results in a shorter red-shifting: at 1:500 ratios maximum OD takes place at 566 nm (B, on average). Also, reaching similar UV–vis curves as those obtained with Cy–Ge containing solutions requires larger Cy:B ratios as 1:500, yet of lower absorbance. Interestingly, the UV–vis spectrum at lower Cy:B ratios as 1:10 results in two bands: one centered at the same wavelength as the control (535 nm) and the other centered around 592 nm (Figure 2).
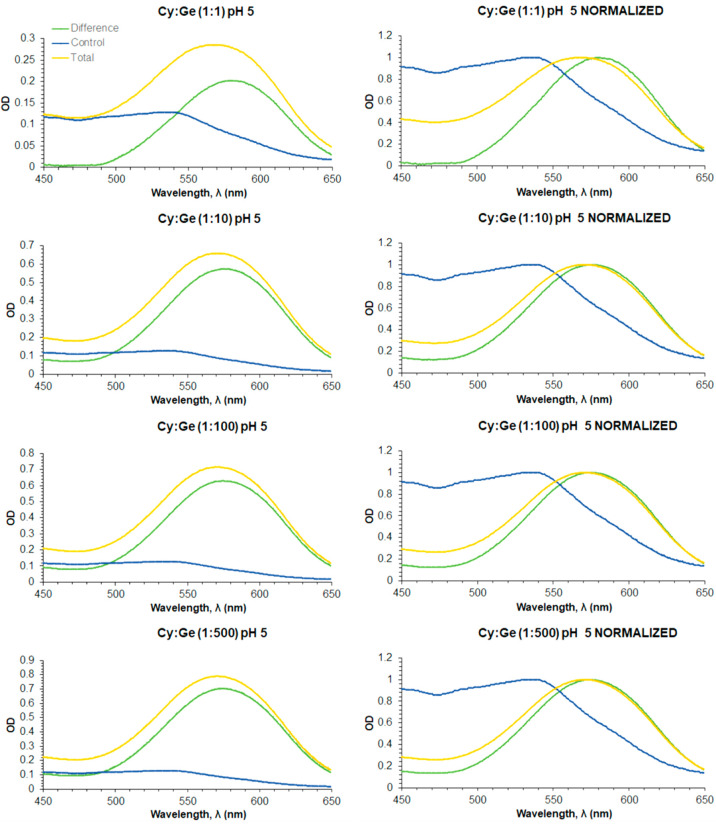
This is more evident when UV–vis spectrum of the control solution is subtracted from those of Cy–Md containing solutions, further supporting that with both metalloids there is a notable absorbance increase at 592 nm that would be the responsible of bluer, if so. The resulting spectra (Figures 4 and 5, left) have been also normalized (i.e., for each spectrum, absorbance values are divided by the value of the highest absorbance) to more clearly account for bathochromic shifts (Figures 4 and 5, right).
Figure 4.
UV–vis spectra of cyanidin-based anthocyanins solutions containing Ge at the various Cy:Ge ratios explored (yellow curves), at pH 5. The curves (green) resulting from subtracting the control solution (blue curves) spectrum (left) are also shown. Normalized curves (right) are also shown to more clearly note bathochromic shifts.
Figure 5.
UV–vis spectra of cyanidin-based anthocyanins solutions containing B at the various Cy:B ratios explored (red curves), at pH 5. The curves (green) resulting from subtracting the control solution (blue curves) spectrum (left) are also shown. Normalized curves (right) are also shown to more clearly note bathochromic shifts.
Two chemical phenomena could explain the absorbance increase at 535 nm when metalloids are added to Cy solutions and both could coexist. On one hand, the Cy–Md complexes formed absorb at nearly the same wavelength as free Cy species in control solutions (vide infra). On the other hand, as Cy–Md complexation would remove Cy colored species from equilibria (complexation with colored species is more favorable than that with colorless ones; see below), according to Le Châtelier’s principle, the equilibria would be restored by shifting from colorless to colored species increasing absorbance in the visible part of the spectrum.
Given that more than one species would contribute to the total UV–vis spectra, λmax would be the resulting sum of those contributions. Therefore, absorbance measurements should be performed away from the wavelength of maximum absorbance (at pH 5: Cy–Ge λmax = 571 nm; Cy–B λmax = 566 nm), where the differences in absorbance were the biggest between metalloid containing and control solutions.45 Thus, we have taken the absorbance value at 592 nm, A592, in all of the experiments. In addition, we have measured the absorbance at 535 nm, A535, (being λmax of control solution at pH 5) for comparison purposes.
An interesting result is found when A535/A592 ratios are calculated. In the 1:1 Cy–Ge-containing solution this ratio equals 0.91 while it decreases to 0.81 at the remaining ratios explored. This would explain the shift from purple to blue solutions when jumping from 1:1 to 1:10–1:500 ratios (Figure 2). However, these ratios in Cy–B-containing solutions follow 2, 1.2–1.3 and significantly reduce below 1 at the 1:500 ratio (0.91). Note that at pH 5, the A535/A592 ratio equals 2 in the control solution. From these data, it can be inferred that A535/A592 ratios below 1 would be required to obtain purple to blue hued solutions.
The increase in absorbance at longer wavelengths as far as 592 nm being responsible for bluer solutions would most likely correspond to formation of any complex of Cy–Ge/B.
Theoretical Results
In order to rationalize at a molecular level the experiments related to visible spectra and provide further information on the molecular structure of the cyanin–metalloid complexes, DFT and TD-DFT calculations were performed.
As reported in the Introduction, color forms of cyanin can be present in solution in cation, neutral, or anion forms whose molar fraction would depend on pH (see below). For neutral and anionic species, different tautomers can be drawn. In a previous work,46 we have found that the most favored neutral form is that obtained by deprotonation of the hydroxyl group at 4′, N4′, (Scheme 1) while two anionic species, obtained by further deprotonation of the hydroxyl group at 7, A74′, or at 5, A54′, are nearly iso-energetic (ΔEA54′→A74′ = 0.43 kcal·mol–1) and would exist in the pH equilibria (Scheme 1). UV–vis spectra have been simulated for all of these uncomplexed Cy forms (Tables 1 and S3). Also, UV–vis spectra of the neutral tautomers resulting from deprotonation at 5, N5, and 7, N7, have been computed (Table S3).
Table 1. Wavelength of Maximum Absorbance, λmax (nm), Together with the Corresponding Value for the Oscillator Strength, f, of the Most Populated Cy Color Species That Could Exist in Acid–Base Equilibria and Mole Fraction Distribution, xi, of Colored Species at the Different pH Values Tested.
| mole fraction,axi |
UV–vis spectra |
||||
|---|---|---|---|---|---|
| Cy species | pH 5 | pH 6 | pH 7 | λmax (nm) | f |
| cation | 0.5/0.0098 | 0.12/0.0010 | 0/0.0001 | 524.13 | 0.8284 |
| neutral N4′b | 0.5/0.0310 | 0.75/0.0312 | 0.5/0.0307 | 544.19 | 1.2722 |
| neutral N5c | 629.47 | 0.2975 | |||
| neutral N7 | 567.15 | 0.6907 | |||
| anion A54′ | 0/0.0002 | 0.12/0.0020 | 0.5/0.0194 | 624.08 | 0.7905 |
| anion A74′ | 621.07 | 1.1172 | |||
In italics, mole fraction is expressed in times one, obtained in this work, where hydration constant, Kh, (pKh = 3.01) has been included (see text).
Among the neutral forms, N4′ is by far the most predominant.
λ with maximum absorbance, λmax, does not correspond to the longest one. λmax occurs at 442.2 (f: 0.6173).
In addition, we have estimated the proportion of any of the Cy forms at pH 5–7 to determine the mixture of Cy forms in control solutions. This helped us in rationalizing the most likely complex to be formed (see below). Indeed, it is widely accepted that at low pH values (pH > 2) ACNs exist in the cation form as the predominant colored one. However, when pH increases, a mixture of various equilibrium forms would be present. According to previous studies,47 at pH 5 the mole fraction of the Cy cation, xC, equals that of the neutral one, xN, and any significant amount of anions would not be present (xC = xN = 0.5; xA = 0). Increasing pH would reduce the xC (0.12 at pH 6 and 0 at pH 7) and increase xN (0.75 at pH 6 and 0.5 at pH 7) and xA (0.12 at pH 6 and 0.5 at pH 7). However, in that work, colorless forms were not taken into account as the hydration constant, Kh, was not considered.
When this term is included (pKh = 3.01)48 as well as the two estimated acid ionization constants following the strategy reported by León-Carmona et al.47 (for further details, see the Supporting Information (SI))—that between cation and neutral species, Ka1, (pKa1 = 4.5) and that between neutral and anion forms, Ka2, (pKa2 = 7.2) (Scheme 1)—we are able to properly account for more realistic mole fractions.49 Low mole fractions of the colored species have been obtained (Table 1) indicating that Cy is mainly in its colorless form (Scheme 1), in line with the low absorbance of control solutions in the visible range. Moreover, when summing both simulated UV–vis spectra of the cation and N4′ supposing xC = xN = 0.5, the resulting one featured its maximum of absorbance at a wavelength value of 536 nm, being very similar to that of the control solution at pH 5. A similar result (λmax = 540 nm) is obtained when including mole fractions derived from the hydration constant (Table 1), but with this strategy, OD values were more compatible with experimental control solutions obtained here.
Our theoretical results are also in agreement with those reported in an investigation on ACN–Men+ interactions by means of Raman spectroscopy50 where it was found that Cy at pH 5 is mainly a colorless species, together with small amounts of the red cation and the purple neutral forms.
These previous studies,24,50,51 further indicate that as metal salts are added to ACN containing solutions, and complexation takes place, the pH dependent equilibria would shift from that of colorless to colored forms increasing absorbance in the visible region. Thus, at first, only colored forms of Cy have been considered for complexation.
According to what is found in the literature, GeO2 in solution would be present as Ge(OH)4 at the pH values explored experimentally, while boric acid would be as B(OH)3. Possible complexes of cyanin with B and Ge have been explored keeping in mind the following considerations: (i) cyanin acts as a bidentate ligand through the catechol moiety at the B-ring (O3′ and O4′); (ii) only 1:1 complexes have been explored; (iii) only those processes where neutral water is released have been considered.
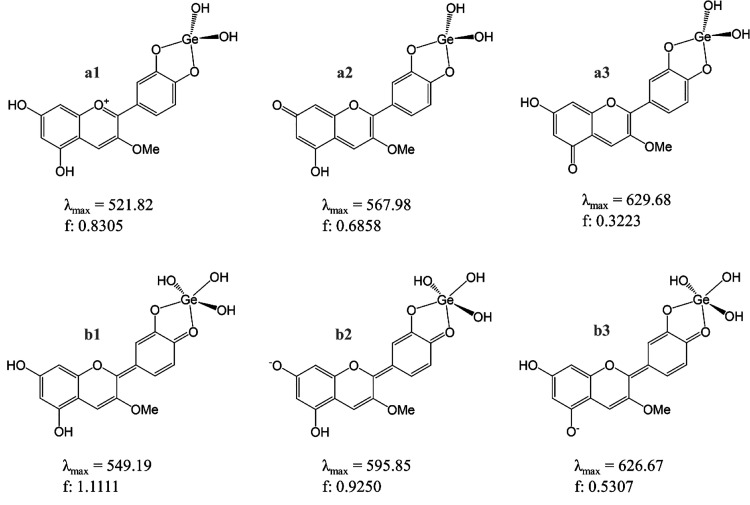
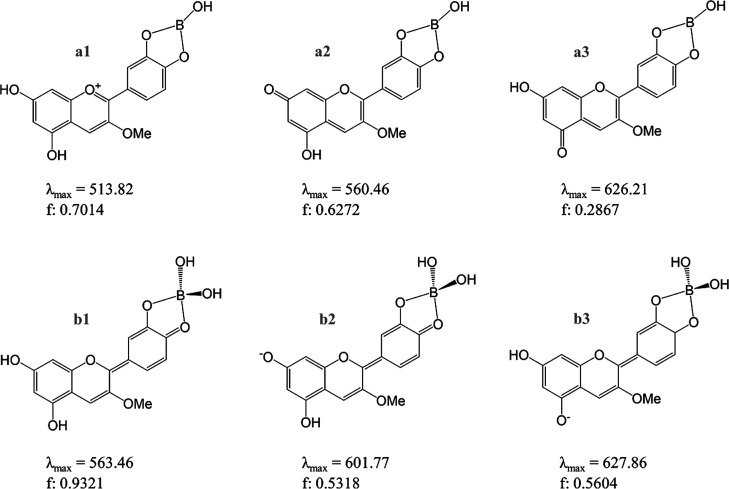
Bearing all of this in mind, two sets of complexes have been envisioned. Those where Ge(OH)4 (Scheme 2) or B(OH)3 (Scheme 3) lose two (a1, a2, a3) or one (b1, b2, b3) OH group(s). All of them have been optimized, and their corresponding UV–vis spectra have been simulated. The longest absorbance wavelength that otherwise stated matches the maximum absorbance wavelength, λmax, together with the value of the oscillator strength of the transition, f, are depicted in both Schemes 2 and 3. They correspond to the vertical HOMO to LUMO electronic transitions.
Scheme 2. Cyanidin-Based Complexes with Ge (Cy–Ge) Explored with Color Forms of Cyanin.
a1 is obtained from the Cy cation, C; a2, a3, and b1 are from N7, N5, and N4′, respectively; and b2 and b3 are from A74′ and A54′, respectively. The corresponding wavelength of maximum absorbance, λmax, nm, and oscillator strength, f, are shown for each complex.
Scheme 3. Cyanidin-Based Complexes with B (Cy–B) Explored with Color Forms of Cyanin.
a1 is obtained from the Cy cation, C; a2, a3, and b1 are from N7, N5, and N4′, respectively, and b2 and b3 are from A74′ and A54′, respectively. The corresponding wavelength of maximum absorbance, λmax, nm, and oscillator strength, f, are shown for each complex.
Looking at the λmax values depicted in Schemes 2 and 3 and those collected in Table 1, we can observe that, in general, they are similar when comparing any Cy–Md complexes and the Cy form which it derived from (Scheme 4).
Scheme 4. Main Resonance Forms of the Aglycon within the Metalloid Complex.
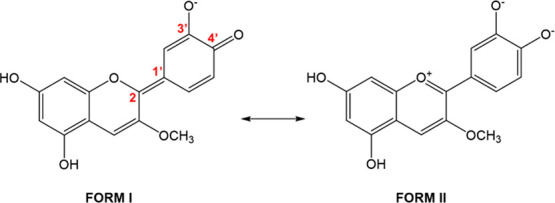
Further analysis indeed indicates that at the complex the molecular geometry of the Cy is partially retained. In particular, b1 resembles the quinoidal-like structure of N4′ while a1 is more compatible with that of the Cy cation (Schemes 4 and S2). This is supported by bond lengths: in b1 C–O4′ (1.30–1.31 Å) is clearly shorter than C–O3′ (1.34–1.35 Å), while in a1 C–O3′ and C–O4′ distances are longer and similar to each other (1.36–1.37 Å). Together, C2–C1′ distances also go in the same line, being longer in a1 than in b1 complexes.18
The replacement of O3′-H and O4′-(H) by O3′-B/Ge and O4′-B/Ge induces significant variations of the QTAIM electron charge, q(Ω), at the O3′ and O4′ atomic basins, q(O3′) and q(O4′), respectively. Indeed, both basins become significantly more negatively charged in a1(B) (Δq(O3′) = Δq(O4′) = 0.16 e) while, in b1(B), only O3′ experiences such an increase (Δq(O3′) = 0.14 e); q(O4′) remaining substantially unchanged. In contrast, in both a1(Ge) and b1(Ge), O–Ge bond formation involved charge variations that can be considered comparatively negligible, Δq(O3′/O4′) < 0.04 e. Besides, these oxygen atoms are involved directly in the complexation process, and only the charges at C3′ and, more notably, at C4′ are modified by reducing their positive charges (Δq(C3′) = 0.07 e; Δq(C4′) = 0.17–0.20 e) while the remaining atoms all over the aglycon hold a similar charge.
Concerning oxygen (Cy)–Md distances, OCy–B distances in a1 are shorter than those in b1 (1.39–1.40 Å vs 1.52 (O3′–B)–1.58 (O4′–B) Å). The same is also found in Cy–Ge complexes with OCy–Ge bond distances (1.80–1.81 Å in a1 vs 1.85 (O3′–Ge) and 1.97 (O4′–Ge) Å in b1). The Cy–Md bonding structure has been also explored by means of QTAIM analysis. Accordingly, electron density properties evaluated at OCy–Ge/B bond critical points (BCPs), ρb—positive ∇2ρb values and negative but small Hb values of the total energy density (Table S5)—fulfill the hallmarks of bonding to a metal atom. It is further noted that, bearing in mind that δ(A, B) values less than 0.2 indicate the ionic character of the A–B bonding,52 OCy–B bonds display a greater ionic character (δ(OCy, B) = 0.4) than OCy–Ge ones (δ(OCy,Ge) = 0.6) in a1 complexes and that the ionic character increases in b1 ones, with values of 0.3 and 0.4–0.5, respectively, in b1(B) and b1(Ge).
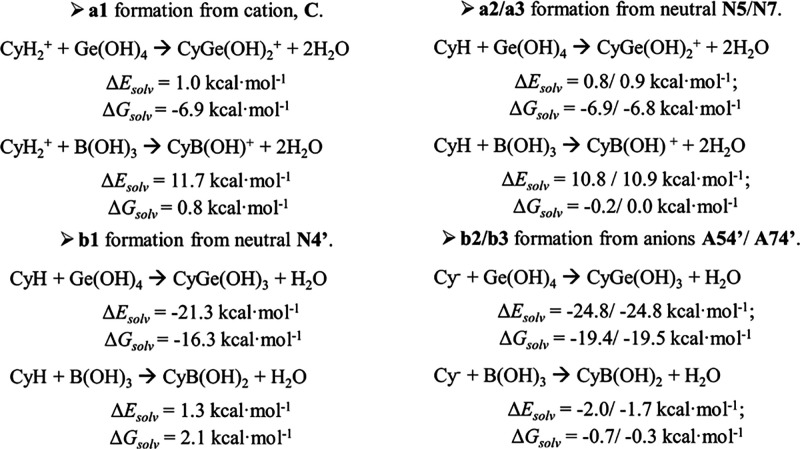
Energy of formation for each of the computed Cy–Md complex has been calculated to estimate the most stable one and to compare those of Ge with those of B. Scheme 5 collects the complexation reactions considered here between color forms of Cy with B(OH)3 or Ge(OH)4 leading to the different a1–a3/b1–b3 complexes (Schemes 2 and 3). ΔEsolv values indicate that complexes labeled as a1–a3 are much less favored than b1–b3. Also, it is clearly shown that complexation with Ge(OH)4 is highly favored over B(OH)3, when comparing the same processes.
Scheme 5. Main Complexation Reactions Involving Color Forms of Cyanin.
CyH2+ stands for the cation form, CyH stands for any of the three neutral tautomers, and Cy– stands for any of the anions, giving rise to a1–a3 and b1–b3 complexes. The ΔEsolv and ΔGsolv (kcal·mol–1) values for corresponding processes are shown.
For comparison, complexation with hemiacetal and chalcones has been explored. According to our calculations, complexation with colorless forms are not competitive with b1–b3 formation (Table S6) which would reinforce the above related findings, that metal complexation is more favored with colored forms over that with colorless ones. It is of note that metal complexes with colorless forms remain as colorless complexes.
Discussion
The molecular structure of ACN includes a fully delocalized π-conjugated system. When ACNs bind to metal ions, this decreases the energy needed to cause light-induced electron transition in this chromophore system.6 Thus, the most distinctive indicators of ACN–Men+ complex formation are the shift of maximum absorption toward longer wavelengths of the visible region (bathochromic shift) and the increase in the intensity of maximal absorbance intensity (so-called hyperchromic effect), which are accompanied by changes of color solution. To date, a great number of the studies have investigated those spectral markers exploring ACN–Men+ complexes,16,19,31 whereas the possibility that ACN can also bind to Md ions has only been proposed,16 but it has never been proven experimentally by UV–vis spectroscopy.
Here, larger hyperchromic effects are observed at pH 5 where bathochromic shifts of 35 and 30 nm have been recorded when Ge(OH)4 and B(OH)3 are added, respectively, with λmax values of 571 (Ge) and 566 nm (B). The addition of Ge(OH)4, even at equimolar ratios, to cyanin-containing solutions buffered at pH 5, produces a small pink to violet color change, supporting the idea that complexation is already occurring while a Ge content of 10 × [ACN] resulted in intense blue hues corresponding with the largest bathochromic shift. A larger excess of Ge produces absorbance increases but without further significant shifting of λmax. Thus, the color change induced by the addition of Ge(OH)4 is comparable with that observed with other metals such as Ga3+ or Fe3+.31 In contrast, the addition of B(OH)3 to ACN solutions has little effect on the spectra up to an excess of 500 × [ACN] where the largest bathochromic shift is observed, with similar numbers as those obtained with Cr3+,31 at pH 5 (Δλmax 30.5 nm with a metal excess of 500 × [ACN]).
When analyzing ACN–Men+ complexation, a sequential complexation mechanism has been proposed, in particular with Al3+,53 where the ACN anion form would be first formed and then complexation with the metal would take place. Another possible mechanism would proceed through concerted steps. Unfortunately, it is not straightforward to dismiss any of them as the ligand molecule, here, Cy, in its anion forms would absorb around the same region as the complexes formed (Table 1 and Schemes 2 and 3). However, neither boric acid nor germanium(IV) acid are expected to be able to remove protons from cation or neutral species to originate anions. Thus, the increasing of absorbance about 592 nm is here assigned to Cy–Md complexes rather than to the Cy anion formation.
Different Cy–Md (Ge/B) complexes have been envisioned, and UV–vis spectra simulations were performed. λmax was very close to that of the uncomplexed Cy from which it comes, suggesting that complexation with these Mds mainly would help in stabilizing the aglycon, which otherwise would suffer from oxidative processes,8 rather than in substantially modifying its molecular structure (vide supra). It has indeed been shown that Cy–Md complexation only leads to marked electron density charge variations at the atoms directly involved in the process: C4′, O3′, O4′, C3′, as noted previously, in Mg2+ and Al3+ complexes of Cy.26
Among the complexes explored, the most feasible ones, obtained when connecting mole fractions (Table 1) and complexation energies (Scheme 4), are those labeled as b1, b2, and b3 where Ge is in a pentavalent environment and B is in a tetravalent one. Complexes with Ge have resulted to be largely favored over those with B when the same processes were compared. This would be in line with a large excess of boric acid being required for a significant bathochromic shift, while even with Cy:Ge equimolar ratios a color change occurs and, thus, complexation is already observed. Indeed, Cy–Md formation is shown to be feasible by reaction of the most stable Cy quinoidal base with Ge(OH)4 (ΔEsolv = −21.32 kcal·mol–1) though this reaction is slightly unfavorable with B(OH)3 (ΔEsolv = 1.28 kcal·mol–1). Moreover, analysis of the electron density of these complexes allowed us to note that OCy–Ge bonding displays a lower ionic character than OCy–B bonding, as measured by the computed δ(OCy, M) delocalization index. For comparison, a similar ionic bonding character in b1–b3 complexes of B (δ(OCy, B) ∼ 0.3) has been previously noted in [CyAl(H2O)4]2+ complex (δ(OCy, Al) = 0.2).26
Combining experimental and theoretical results allow us to understand that the visible region of spectra of ACN–Md solutions is the result of more than one absorbent species. A reasonable interpretation of UV–vis spectra of metalloid-containing solutions of Cy is established considering mixtures of mainly b1–b3 complexes, with b1 as the most likely complex formed (that obtained from N4′, the most predominant form at pH 5). In addition, ΔEsolv values indicate that b2 and b3 complexes (formed by reaction of the metalloid with the anionic quinoidal bases A54′ and A74′) are slightly favored over b1. Notably, we have obtained that deprotonation of b1 leading to b2 or b3 is an easier process, with a lower computed pKa (6.5), than deprotonation of the uncomplexed N4′ giving rise to A54′ or A74′ forms (pKa (7.2), see the SI). Thus, some amounts of b2 and b3 could be present even at pH 5, producing a large red shifting. Together, non-negligible mole fractions of A54′ and A74′ anionic species would represent another source of b2 and b3 complexes.
When the pH rises from 5 to 7, larger amounts of b2 and b3 complexes would be present because of (i) the increasing population of the anion form in control solutions to complex with B/Ge and/or (ii) shifting of the pH equilibria from b1 to b2 and b3. In this situation, bathochromic shift and hypochromic effects should be noted in the spectra, as b2 and b3 feature longer λmax and lower f values.
The same explanation would work with B, but with less favored complexation energies. According to ΔEsol/ΔGsol values, we can rationalize that complexation with B would require larger excess of B(OH)3 to obtain similar bathochromic shifts as with Ge(OH)4. With B, the b1 complex formation process displays positive ΔEsolv and ΔGsolv values while those for b2 and b3 display slightly negative values. To overcome those unfavorable values, large excesses of the metalloid would force the reaction to proceed.
Overall, based on experimental and theoretical evidence, the elucidation of UV–vis spectra of Cy-containing solutions with metalloid ions, namely Ge and B, is made. Thus, the blue hue is identified mainly with the formation of complexes labeled as b1–b3, whose mixture at different ratios would produce an increase in absorbance at the wavelength centered around 592 nm. Together, uncomplexed Cy would be contributing to UV–vis spectra of Md-containing Cy solutions, increasing absorbance at a wavelength centered at 535 nm, due to the equilibria shifting from colorless to colored (mainly cation and neutral) forms to globally obtain UV–vis spectra characterized by λmax of 571 (Ge) or 566 (B) nm.
To conclude, the present manuscript highlights for the first time the possibility that two metalloids, namely B and Ge, can complex with anthocyanins, thereby raising the possibility that anthocyanin–metalloid complexation can also occur for other metalloid ions, an aspect which should be considered in future experiments.
Acknowledgments
L.E. thanks Universidad de Vigo and Xunta de Galicia for financial support and “Centro de Supercomputación de Galicia” (CESGA) for free access to its computational facilities. M.Q. thanks Xunta de Galicia for her predoctoral contract. L.E. and R.A.M. thank Xunta de Galicia for financial support through the project GRC2019/24.
Supporting Information Available
The Supporting Information is available free of charge at https://pubs.acs.org/doi/10.1021/acs.jafc.0c06827.
Information of hyperchromic and bathochromic shifts in red basil anthocyanins with pH at different ANC:Md stoichiometry ratios; information on pH equilibria of the uncomplexed cyanidin-3-OMe; strategy followed to estimate the first and second pKa of Cy; molecular geometry comparison between cation and N4′ of Cy; selected QTAIM electron density properties of the metalloid–Cy bonding and metalloid complexation with colorless species of Cy (PDF)
The authors declare no competing financial interest.
Supplementary Material
References
- Grotewold E. The genetics and biochemistry of floral pigments. Annu. Rev. Plant Biol. 2006, 57, 761–780. 10.1146/annurev.arplant.57.032905.105248. [DOI] [PubMed] [Google Scholar]
- Landi M.; Tattini M.; Gould K. S. Multiple functional roles of anthocyanins in plant-environment interactions. Environ. Exp. Bot. 2015, 119, 4–17. 10.1016/j.envexpbot.2015.05.012. [DOI] [Google Scholar]
- Yoshida K.; Mori M.; Kondo T. Blue flower color development by anthocyanins: from chemical structure to cell physiology. Nat. Prod. Rep. 2009, 26, 884. 10.1039/b800165k. [DOI] [PubMed] [Google Scholar]
- Hatier J. H. B.; Gould K. S.. Anthocyanin function in vegetative organs. In Anthocyanins: Biosynthesis, Functions, and Applications; Gould K. S., Davies K. M., Winefield C., Eds.; Springer: New York, 2009; pp 1–20. [Google Scholar]
- Ellestad G. A. Structure and chiroptical properties of supramolecular flower pigments. Chirality 2006, 18, 134–144. 10.1002/chir.20228. [DOI] [PubMed] [Google Scholar]
- Fedenko V. S.; Shemet S. A.; Landi M. UV–vis spectroscopy and colorimetric models for detecting anthocyanin-metal complexes in plants: An overview of in vitro and in vivo techniques. J. Plant Physiol. 2017, 212, 13–28. 10.1016/j.jplph.2017.02.001. [DOI] [PubMed] [Google Scholar]
- Andersen Ø. M.; Jordheim M.. The Anthocyanins. In Flavonoids, Chemistry Biochemistry and Application; Andersen O. M., Markham K. R., Eds.; CRC Press: Boca Raton, FL, 2006; pp 471–552. [Google Scholar]
- Tattini M.; Landi M.; Brunetti C.; Giordano C.; Remorini D.; Gould K. S.; Guidi L. Epidermal coumaroyl anthocyanins protect sweet basil against excess light stress: multiple consequences of light attenuation. Physiol. Plant. 2014, 152, 585–598. 10.1111/ppl.12201. [DOI] [PubMed] [Google Scholar]
- Dangles O.; Fenger J. A. The chemical reactivity of anthocyanins and its consequences in food science and nutrition. Molecules 2018, 23, 1970–1992. 10.3390/molecules23081970. [DOI] [PMC free article] [PubMed] [Google Scholar]
- Buchweitz M.; Brauch J.; Carle R.; Kammerer D. R. Application of ferric anthocyanin chelates as natural blue food colorants in polysaccharide and gelatin based gels. Food Res. Int. 2013, 51, 274–282. 10.1016/j.foodres.2012.11.030. [DOI] [Google Scholar]
- Buchweitz M.; Brauch J.; Carle R.; Kammerer D. R. Colour and stability assessment of blue ferric anthocyanin chelates in liquid pectin-stabilised model systems. Food Chem. 2013, 138, 2026–2035. 10.1016/j.foodchem.2012.10.090. [DOI] [PubMed] [Google Scholar]
- Sigurdson G. T.; Giusti M. M. Bathochromic and hyperchromic effects of aluminum salt complexation by anthocyanins from edible sources for blue color development. J. Agric. Food Chem. 2014, 62, 6955–6965. 10.1021/jf405145r. [DOI] [PubMed] [Google Scholar]
- Okoye C. O. B.; Chukwuneke A. M.; Ekere N. R.; Ihedioha J. N. Simultaneous ultraviolet-visible (UV-vis) spectrophotometric quantitative determination of Pb, Hg, Cd, As and Ni ions in aqueous solutions using cyanidin as a chromogenic reagent. Int. J. Phys. Sci. 2013, 8, 98–102. 10.5897/IJPS12.670. [DOI] [Google Scholar]
- Okoye C. O. B.; Okon E. E.; Ekere N. R.; Ihedioha J. N. Simultaneous UV-VIS spectrophotometric quantitative determinations of cyanidin complexes of Co, Zn, Cr, Cu, and Fe ions in mixed aqueous solutions. Int. J. Chem. Anal. Sci. 2012, 3, 1662–1664. [Google Scholar]
- Takeda K.; Hayashi K. Metallo anthocyanins. I. Reconstruction of commelinin from its components, awobanin, flavocommelin and magnesium. Proc. Jpn. Acad., Ser. B 1977, 53, 1–5. 10.2183/pjab.53.1. [DOI] [Google Scholar]
- Shiono M.; Matsugaki N.; Takeda K. Structure of the blue cornflower pigment. Nature 2005, 436, 791. 10.1038/436791a. [DOI] [PubMed] [Google Scholar]
- Landi M.; Remorini D.; Pardossi A.; Guidi L. Sweet basil (Ocimum basilicum) with green or purple leaves: which differences occur in photosynthesis under boron toxicity?. J. Plant Nutr. Soil Sci. 2013, 176, 942–951. 10.1002/jpln.201200626. [DOI] [Google Scholar]
- Landi M.; Guidi L.; Pardossi A.; Tattini M.; Gould K. S. Photoprotection by foliar anthocyanins mitigates effects of boron toxicity in sweet basil (Ocimum basilicum). Planta 2014, 240, 941–953. 10.1007/s00425-014-2087-1. [DOI] [PubMed] [Google Scholar]
- Trouillas P.; Sancho-García J. C.; De Freitas V.; Gierschner J.; Otyepka M.; Dangles O. Stabilizing and modulating color by copigmentation: insights from theory and experiment. Chem. Rev. 2016, 116, 4937–4982. 10.1021/acs.chemrev.5b00507. [DOI] [PubMed] [Google Scholar]
- Estévez L.; Sánchez-Lozano M.; Mosquera R. A. Complexation of common metal cations by cyanins: Binding affinity and molecular structure. Int. J. Quantum Chem. 2019, 119, e25834–e25844. 10.1002/qua.25834. [DOI] [Google Scholar]
- Adamo C.; Jacquemin D. The calculations of excited-state properties with Time-Dependent Density Functional Theory. Chem. Soc. Rev. 2013, 42, 845–856. 10.1039/C2CS35394F. [DOI] [PubMed] [Google Scholar]
- Hale K. L.; Tufan H. A.; Pickering I. J.; George G. N.; Terry N.; Pilon M.; Pilon-Smits E. A. H. Anthocyanins facilitate tungsten accumulation in Brassica. Physiol. Plant. 2002, 116, 351–358. 10.1034/j.1399-3054.2002.1160310.x. [DOI] [Google Scholar]
- Takeda K.; Kubota R.; Yagioka C. Copigments in the blueing of sepal colour of Hydrangea macrophylla. Phytochemistry 1985, 24, 1207–1209. 10.1016/S0031-9422(00)81102-4. [DOI] [Google Scholar]
- Elhabiri M.; Figueiredo P.; Toki K.; Saito N.; Brouillard R. Anthocyanin–aluminium and – gallium complexes in aqueous solution. J. Chem. Soc., Perkin Trans. 2 1997, 355–362. 10.1039/a603851d. [DOI] [Google Scholar]
- Schreiber H. D.; Swink A. M.; Godsey T. D. The chemical mechanism for Al3+ complexing with delphinidin: A model for the bluing of Hydrangea sepals. J. Inorg. Biochem. 2010, 104, 732–739. 10.1016/j.jinorgbio.2010.03.006. [DOI] [PubMed] [Google Scholar]
- Estevez L.; Otero N.; Mosquera R. A. Molecular structure of cyanidin metal complexes: Al(III) versus Mg(II). Theor. Chem. Acc. 2011, 128, 485–495. 10.1007/s00214-010-0829-0. [DOI] [Google Scholar]
- Dai L. P.; Dong X. J.; Ma H. H. Antioxidative and chelating properties of anthocyanins in Azolla imbricata induced by cadmium. Pol. J. Environ. Stud. 2012, 21, 837–844. [Google Scholar]
- Park W.; Han K. H.; Ahn S. J. Differences in root-to-shoot Cd and Zn translocation and by HMA3 and 4 could influence chlorophyll and anthocyanin content in Arabidopsis Ws and Col-0 ecotypes under excess metals. Soil Sci. Plant Nutr. 2012, 58, 334–348. 10.1080/00380768.2012.684643. [DOI] [Google Scholar]
- Somaatmadja D.; Powers J. J.; Hamdy M. H. Anthocyanins. VI. Chelation studies on anthocyanins and other related compounds. J. Food Sci. 1964, 29, 655–660. 10.1111/j.1365-2621.1964.tb00426.x. [DOI] [Google Scholar]
- Buchweitz M.; Carle R.; Kammerer D. R. Bathochromic and stabilising effects of sugar beet pectin and an isolated pectic fraction on anthocyanins exhibiting pyrogallol and catechol moieties. Food Chem. 2012, 135, 3010–3019. 10.1016/j.foodchem.2012.06.101. [DOI] [PubMed] [Google Scholar]
- Sigurdson G. T.; Robbins R. J.; Collins T. M.; Giusti M. M. Evaluating the role of metal ions in the bathochromic and hyperchromic responses of cyanidin derivatives in acidic and alkaline pH. Food Chem. 2016, 208, 26–34. 10.1016/j.foodchem.2016.03.109. [DOI] [PubMed] [Google Scholar]
- Hale K. L.; McGrath S. P.; Lombi E.; Stack S. M.; Terry N.; Pickering I. J.; George G. N.; Pilon-Smits E. A. H. Molybdenum sequestration in Brassica: a role for anthocyanins?. Plant Physiol. 2001, 126, 1391–1402. 10.1104/pp.126.4.1391. [DOI] [PMC free article] [PubMed] [Google Scholar]
- Chemistry of Europe’s agricultural soils, part A. Methodology and interpretation of the GEMAS data set; Reimann C., Birke M., Demetriades A., Filzmoser P., O’Connor P., Eds.; Schweizerbart Science Publishers: Germany, 2014. [Google Scholar]
- Wiche O.; Székely B.; Moschner C.; Heilmeier H. Germanium in the soil-plant system-a review. Environ. Sci. Pollut. Res. 2018, 25, 31938–31956. 10.1007/s11356-018-3172-y. [DOI] [PubMed] [Google Scholar]
- Rosenberg E. Environmental speciation of germanium. Ecol. Chem. Eng. 2007, 14, 707–732. [Google Scholar]
- Hayes J. E.; Pallotta M.; Baumann U.; Berger B.; Langridge P.; Sutton T. Germanium as a tool to dissect boron toxicity effects in barley and wheat. Funct. Plant Bio. 2013, 40, 618–627. 10.1071/FP12329. [DOI] [PubMed] [Google Scholar]
- Cakmak I.; Kurz H.; Marschner H. Short-term effects of boron, germanium and high light intensity on membrane permeability in boron deficient leaves of sunflowers. Physiol. Plant. 1995, 95, 11–18. 10.1111/j.1399-3054.1995.tb00801.x. [DOI] [Google Scholar]
- Lo Piccolo E.; Landi M. Red-leafed species for urban “greening” in the age of global climate change. J. For. Res. 2021, 32, 151. 10.1007/s11676-020-01154-2. [DOI] [Google Scholar]
- Frisch M. J.; et al. Gaussian 09, Revision D.01; Gaussian, Inc., Wallingford CT, 2009.
- Tomasi J.; Mennucci B.; Cammi R. Quantum mechanical continuum solvation models. Chem. Rev. 2005, 105, 2999–3093. 10.1021/cr9904009. [DOI] [PubMed] [Google Scholar]
- Stratmann R. E.; Scuseria G. E.; Frisch M. J. An efficient implementation of time-dependent density-functional theory for the calculation of excitation energies of large molecules. J. Chem. Phys. 1998, 109, 8218–8224. 10.1063/1.477483. [DOI] [Google Scholar]
- QTAIM Bader R. F. W.Atoms in Molecules–A Quantum Theory; International Series of Monographs in Chemistry, No 22, Oxford University Press: Oxford, 1990. [Google Scholar]
- Bader R. F. W. A quantum theory of molecular structure and its applications. Chem. Rev. 1991, 91, 893–928. 10.1021/cr00005a013. [DOI] [Google Scholar]
- Todd A. K.AIMAll, version 16.10.09; TK Gristmill Software, Overland Park KS, USA, 2016.
- Dimitrić Marković J. M.; Veselinović D. S.; Baranac J. M.; Brdarić T. P. Spectroscopic and theoretical study of cyanidin–aluminum (III) complexes. Spectrosc. Lett. 2008, 41, 104–115. 10.1080/00387010701799704. [DOI] [Google Scholar]
- Estevez L.; Mosquera R. A. Conformational and substitution effects on the electron distribution in a series of anthocyanidins. J. Phys. Chem. A 2009, 113, 9908–9919. 10.1021/jp904298z. [DOI] [PubMed] [Google Scholar]
- León-Carmona J. R.; Galano A.; Alvarez-Idaboy J. R. Deprotonation routes of anthocyanidins in aqueous solution, pKa values, and speciation under physiological conditions. RSC Adv. 2016, 6, 53421–53429. 10.1039/C6RA10818K. [DOI] [Google Scholar]
- Vidot K.; Achir N.; Mertz C.; Sinela A.; Rawat N.; Prades A.; Dangles O.; Fulcrand H.; Dornier M. Effect of temperature on acidity and hydration equilibrium constants of delphinidin-3-O- and cyaniding-3-O-sambubioside calculated from uni- and multiwavelength spectroscopic data. J. Agric. Food Chem. 2016, 64, 4139–4145. 10.1021/acs.jafc.6b00701. [DOI] [PubMed] [Google Scholar]; b Dangles O.; Fenger J. A. The Chemical reactivity of anthocyanins and its consequences in food science and nutrition. Molecules 2018, 23, 1970–1992. 10.3390/molecules23081970. [DOI] [PMC free article] [PubMed] [Google Scholar]
- Pina F. Chemical Applications of anthocyanins and related compounds. a source of bioinspiration. J. Agric. Food Chem. 2014, 62, 6885–6897. 10.1021/jf404869m. [DOI] [PubMed] [Google Scholar]
- Buchweitz M.; Gudi G.; Carle R.; Kammerer D. R.; Schulz H. Systematic investigations of anthocyanin-metal interactions by Raman spectroscopy. J. Raman Spectrosc. 2012, 43, 2001–2007. 10.1002/jrs.4123. [DOI] [Google Scholar]
- Dangles O.; Elhabiri M.; Brouillard R. Kinetic and thermodynamic investigation of the aluminium–anthocyanin complexation in aqueous solution. J. Chem. Soc., Perkin Trans. 2 1994, 2587–2596. 10.1039/P29940002587. [DOI] [Google Scholar]
- Schreiber H. D.; Jones A. H.; Lariviere C. M.; Mayhew K. M.; Cain J. B. Role of aluminum in red-to-blue color changes in Hydrangea macrophylla sepals. BioMetals 2011, 24, 1005–1015. 10.1007/s10534-011-9458-x. [DOI] [PubMed] [Google Scholar]
Associated Data
This section collects any data citations, data availability statements, or supplementary materials included in this article.


