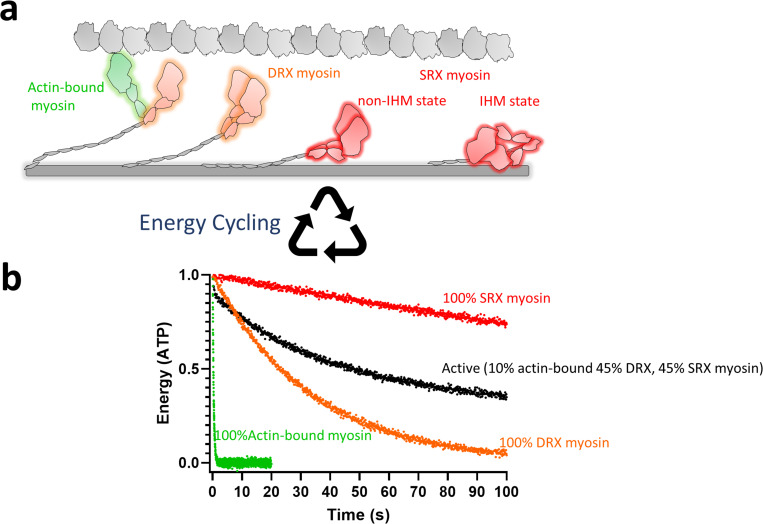
Figure 1. Schematic representation of the possible different functional states of myosin.
(a) Highlighted in green are actin-bound myosins, which are most active and utilize maximum ATP. This myosin state is in equilibrium with an off-actin state, shown in orange, the DRX state of myosin, which has 100-fold less activity than the actin-interacting form. Myosins in the DRX state are in equilibrium with those in the SRX state, as shown in red, which has a further 10-fold less activity than the DRX state. The SRX state of myosin could be due to either a traditional IHM state or a non-IHM state. Actin is shown as gray globular domains, and the myosin thick-filament shaft is shown as a gray cylindrical rod. (b) Simulated energy (ATP) utilization by different myosin states is shown. The ATP turnover rate for the actin-bound myosin, DRX myosin, and SRX myosin was assumed to be 3 s−1, 0.03 s−1, and 0.003 s−1, respectively. A standard deviation of 0.1 units was used to generate random Gaussian noise. The simulated curves were generated using the GraphPad Prism software.

