Abstract
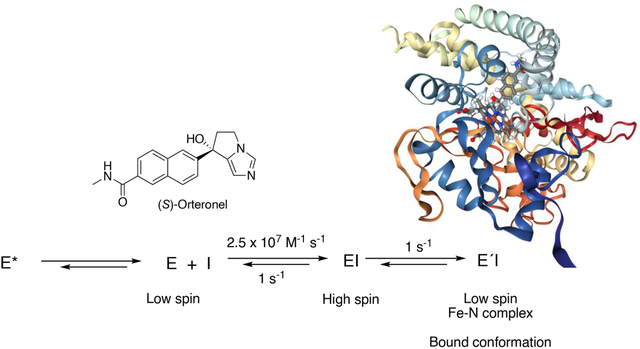
Orteronel (TAK-700) is a substituted imidazole that was developed for the treatment of castration-resistant prostate cancer but was dropped in Phase III clinical trials. Both enantiomers of this inhibitor of cytochrome P450 (P450) 17A1 show some selectivity in differentially blocking the 17α-hydroxylation and lyase activities of the enzyme. Although both enantiomers of this compound have sub-μM IC50 values and bind to the enzyme with a Type II spectral change (indicative of nitrogen-iron bonding) and reported Kd values of 56 and 40 nM (R- and S-, respectively), the rates of binding to P450 17A1 were relatively slow. We considered the possibility that the drug is a slow, tight-binding inhibitor. Analysis of the kinetics of binding revealed rapid formation of an initial complex, presumably in the substrate binding site, followed by a slower change to the spectrum of a final iron complex. Similar kinetics were observed in the interaction of another inhibitor, the triazole (S)-seviteronel (VT-464), with P450 17A1. Kinetic tests and modeling indicate that the further change to the iron-complexed form of the orteronel- or seviteronel-P450 complex is not a pre-requisite for enzyme inhibition. Accordingly, the inclusion of heme-binding heterocyclic nitrogen moieties in P450 17A1 inhibitors may not be necessary to achieve inhibition but may nevertheless augment the process.
Keywords: Cytochrome P450, P450 17A1, CYP17A1, enzyme inhibition, orteronel, TAK-700, seviteronel, VT-464, prostate cancer, androgen inhibition
Graphical Abstract
INTRODUCTION
Cytochrome P450 (P450, CYP) 17A1 is the enzyme that converts the Δ4 steroid progesterone to 17α-hydroxy (OH) progesterone and then to androstenedione (Scheme 1).1 It also converts the Δ5 steroid pregnenolone to 17α-OH pregnenolone and on to dehydroepiandrosterone, which can be oxidized to androstenedione by 3β-hydroxysteroid dehydrogenase. P450 17A1 is present in gonadal tissues, including the adrenals and testes. The production of androgens is important for normal reproductive function, and androgens are also necessary for synthesis of estrogens. The 17α-hydroxy steroids are also used in the biosynthesis of mineralocorticoids and glucocorticoids.
Scheme 1.
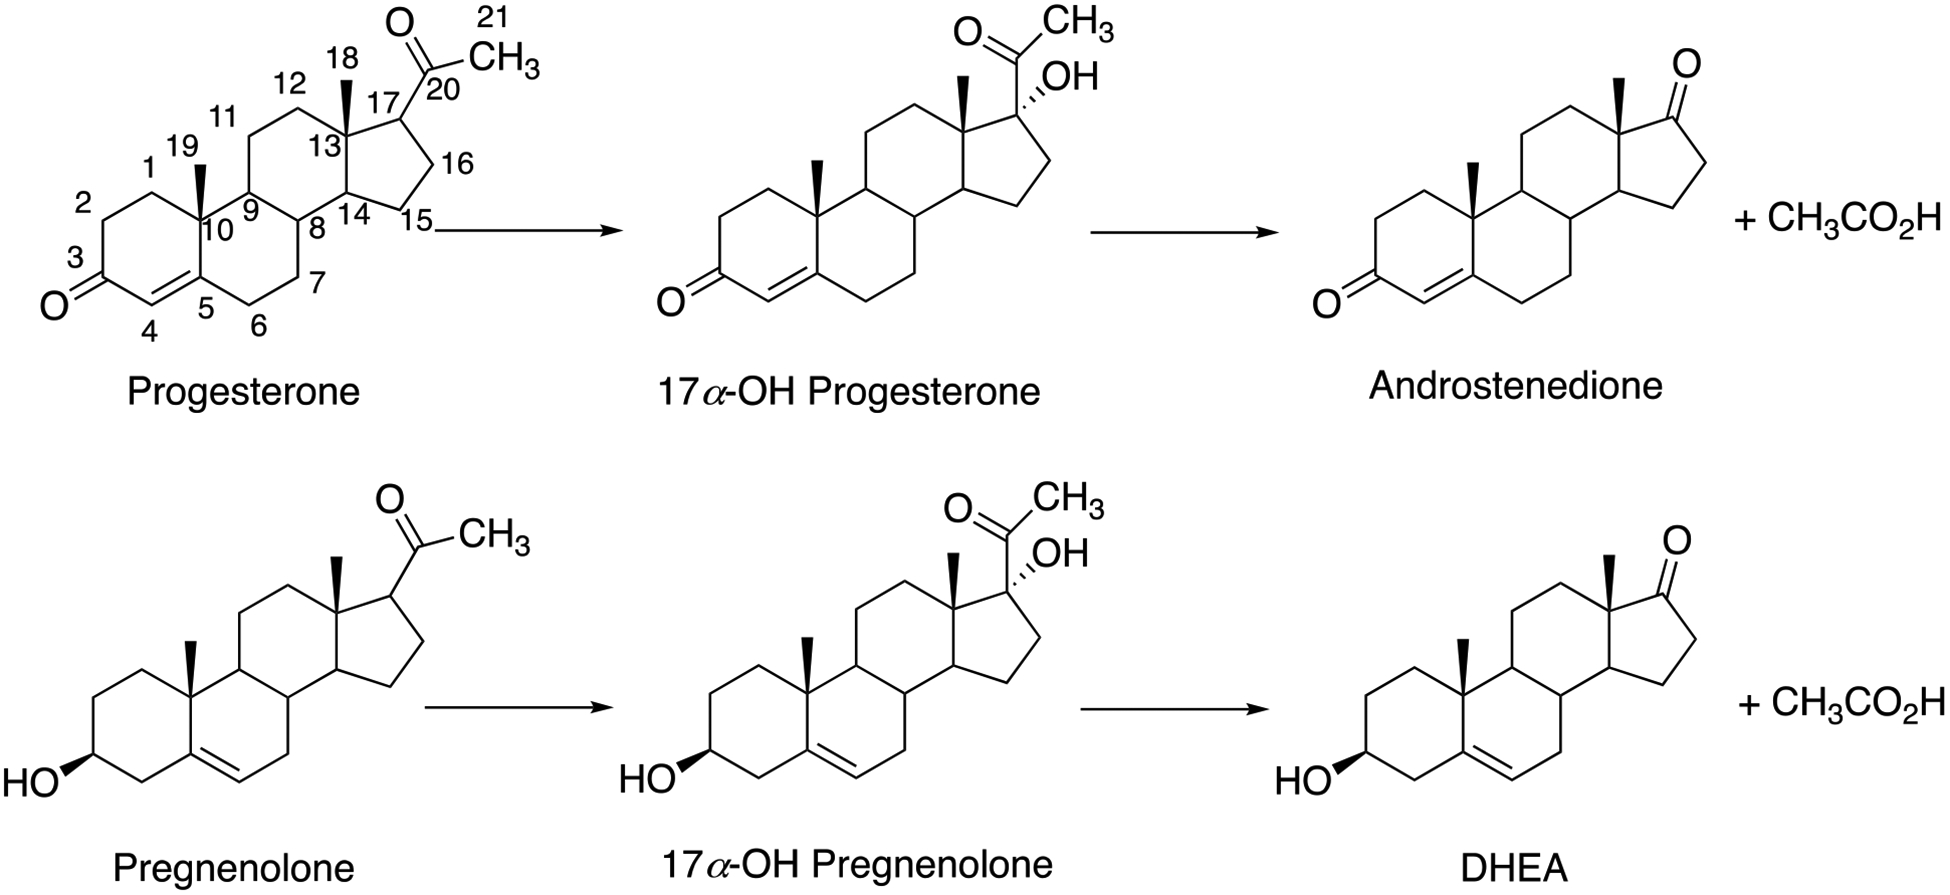
Reactions catalyzed by P450 17A1. DHEA, dehydroepiandrosterone.
One approach to treating prostate cancer is by suppression of androgen synthesis, i.e. inhibiting P450 17A1 (Scheme 1). A number of inhibitors have been considered, and one (abiraterone acetate, a prodrug) is currently on the market.2, 3 One goal in P450 17A1 inhibition is to preferentially inhibit the lyase step compared to the initial 17α-hydroxylation step (Scheme 1), because the 17α-OH steroids are needed to produce cortisol. In clinikcal practice, administration of abiraterone currently involves supplementation with prednisone. Some discernment of inhibition of the two reactions has been reported with drug candidates, one of which is orteronel (TAK-700) (Scheme 2).4 Both enantiomers are inhibitory, with the (S)-enantiomer being more potent. Another naphthalene-containing non-steroidal drug candidate is seviteronel (VT-464), and the (S)-enantiomer is more inhibitory (Scheme 2).6 Although orteronel was dropped in Phase III clinical studies, seviteronel is apparently still under development at this time. We5 and others6 have considered the selectivity of orteronel for the lyase reaction. However, as pointed out by Petrunak et al.,6 the apparent potency of inhibition and the selectivity are dependent upon the experimental design.
Scheme 2.

(R)- and (S)- enantiomers of orteronel and (S)-seviteronel.
Crystal structures of P450 17A1 bound to both the (R)- and (S)-enantiomers of orteronel and to (S)-seviteronel have been reported by the Scott laboratory.6 The protein structures differ for the two enantiomers, suggesting that conformational changes are involved in achieving these differences. Structures of unliganded P450 17A1 are not available for comparison. As we noted previously,7 selective inhibition of the two P450 17A1 reactions is not possible using a single binding site unless conformational changes are involved.
The crystal structures of human P450 17A1 bound to abiraterone, galeterone (TOK-001), (S)-seviteronel, and (R)- and (S)-orteronel all show the interaction of a heterocyclic ring nitrogen atom with the heme iron, i.e. a classic Type II complex with an associated low-spin spectrum and a UV-visible Soret λmax near 430 nm.6, 8 Such binding is also seen in the abiraterone complexes of both zebrafish P450 17A1 and 17A2.9, 10 Consideration of the known inhibitors of P450 17A16, 11, 12 might suggest that the presence of iron-heterocyclic nitrogen bonding is critical for P450 17A1 inhibitors.
In the course of our studies on the mechanisms and kinetics of binding of steroids to P450 17A1,7 we identified conformational selection as a mechanism in substrate selection, i.e. multiple conformations of P450 17A1 existing in solution prior to binding and selecting for substrate recognition. This mechanism was also implicated for abiraterone,7 which is also a steroid. Surprisingly the kinetics of orteronel binding were very different than observed for the steroids, and we further investigated these. The results indicate rapid binding followed by a change to the final spectrally-observed complex with orteronel, presumably the one characterized by its crystal structure(s).6 Similar behavior was observed with (S)-seviteronel. Some enzyme inhibitors, including drugs, act through slow, tight-binding inhibition, characterized by initial loose fitting to an enzyme followed by a slower transition to a more tightly bound form.13–17 We considered such a mechanism but have ruled it out in favor of one in which the initial binding of the enzyme is tight and leads directly to inhibition.
RESULTS
Kinetics of orteronel binding.
Previous work on the binding of several steroids (including substrates, products, and the inhibitor abiraterone) showed multiphasic kinetics, which could be described in terms of a conformational selection mechanism, as opposed to induced fit.7 Binding of the substituted imidazole inhibitor orteronel yields a classic Type II Soret difference spectrum, with a λmax at 430 nm and λmin at 410 nm.5, 6
Mixing (final concentrations of) 2 μM P450 17A1 and 2 μM (S)-orteronel yielded a plot (ΔA430-A410) that was first-order with regard to each component (Figure 1A), but the rate was slower than might be expected for a strong inhibitor (IC50 0.27 μM, Kd 40 nM).6 Similar kinetics were observed with (R)-orteronel. Fitting the data to a plot of 1/[unbound P450 17A1] vs. time (Figure 1B) yielded an estimated on-rate constant of 7.5 × 10⁵ M−1 s−1 for the initial portion of the reaction, which is less than expected for diffusion-limited binding.19, 20
Figure 1.
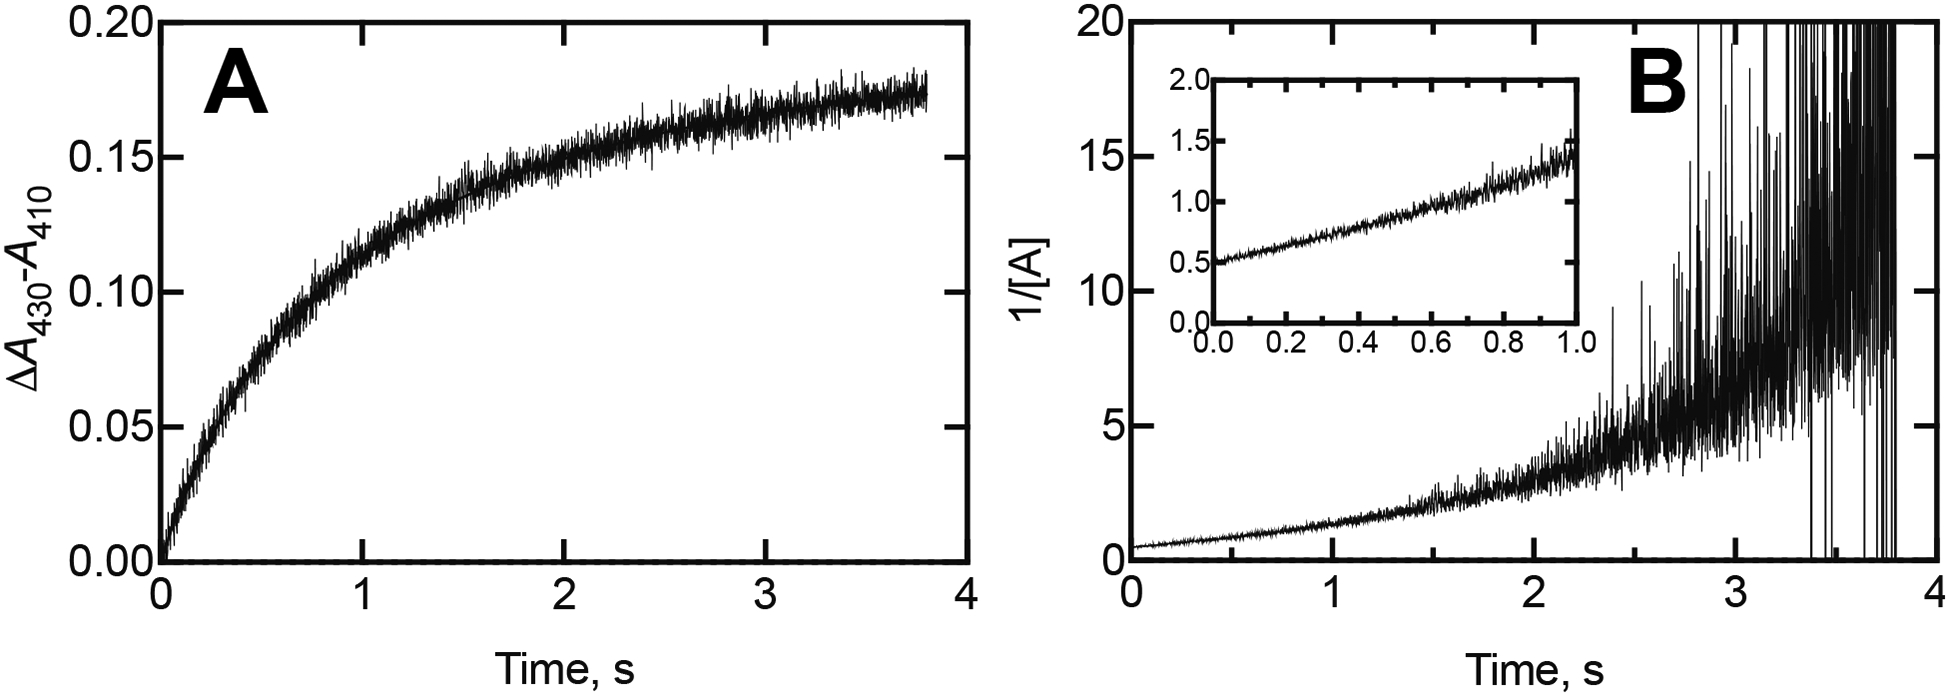
Kinetics of spectral changes observed in binding of (S)-orteronel with P450 17A1. The final concentrations of the compound and P450 were both 2 μM. (A) Plot of ΔA430-A410 (wavelengths for maximum difference) vs. time. (B) Plot of reciprocal of residual unbound concentration vs. time (residual unbound concentrations determined by subtraction from 2 μM, in an Excel file). With equimolar starting concentrations, the rate constant for a reaction A + B → AB, if beginning with equimolar concentrations of A and B, is mathematically equivalent to 2A → AB and can be estimated, using the expression kt = 1/[A]t – 1/[A]0,18 to be 7.5 × 10⁵ M−1 s−1 in this case (using the first 400 ms of data). (A: P450 17A1; B: orteronel; C: P450-orteronel complex)
Spectra of P450 17A1 and orteronel complexes
The slow kinetics suggested that the binding of orteronel might be more complex than a simple 2-component system. Analysis of the reactions presented in Figures 1 and 2 by singular value decomposition (SVD) suggested the possibility of an intermediate species (Figure 3A). Species 2 resembles the unbound enzyme (Species 1), but is not identical, and is converted to the (final) Species 3. The difference spectrum calculated between Species 3 and Species 1 has a λmax of 430 nm and λmin of 410. SVD analysis of the (S)-orteronel data yielded a rate of conversion of Species 1 to Species 2 of 37 s−1 and from Species 2 to Species 3 at a rate of 0.93 s−1, and the results with the (R)-enantiomer were similar (Figure 3B, 3E).
Figure 2.
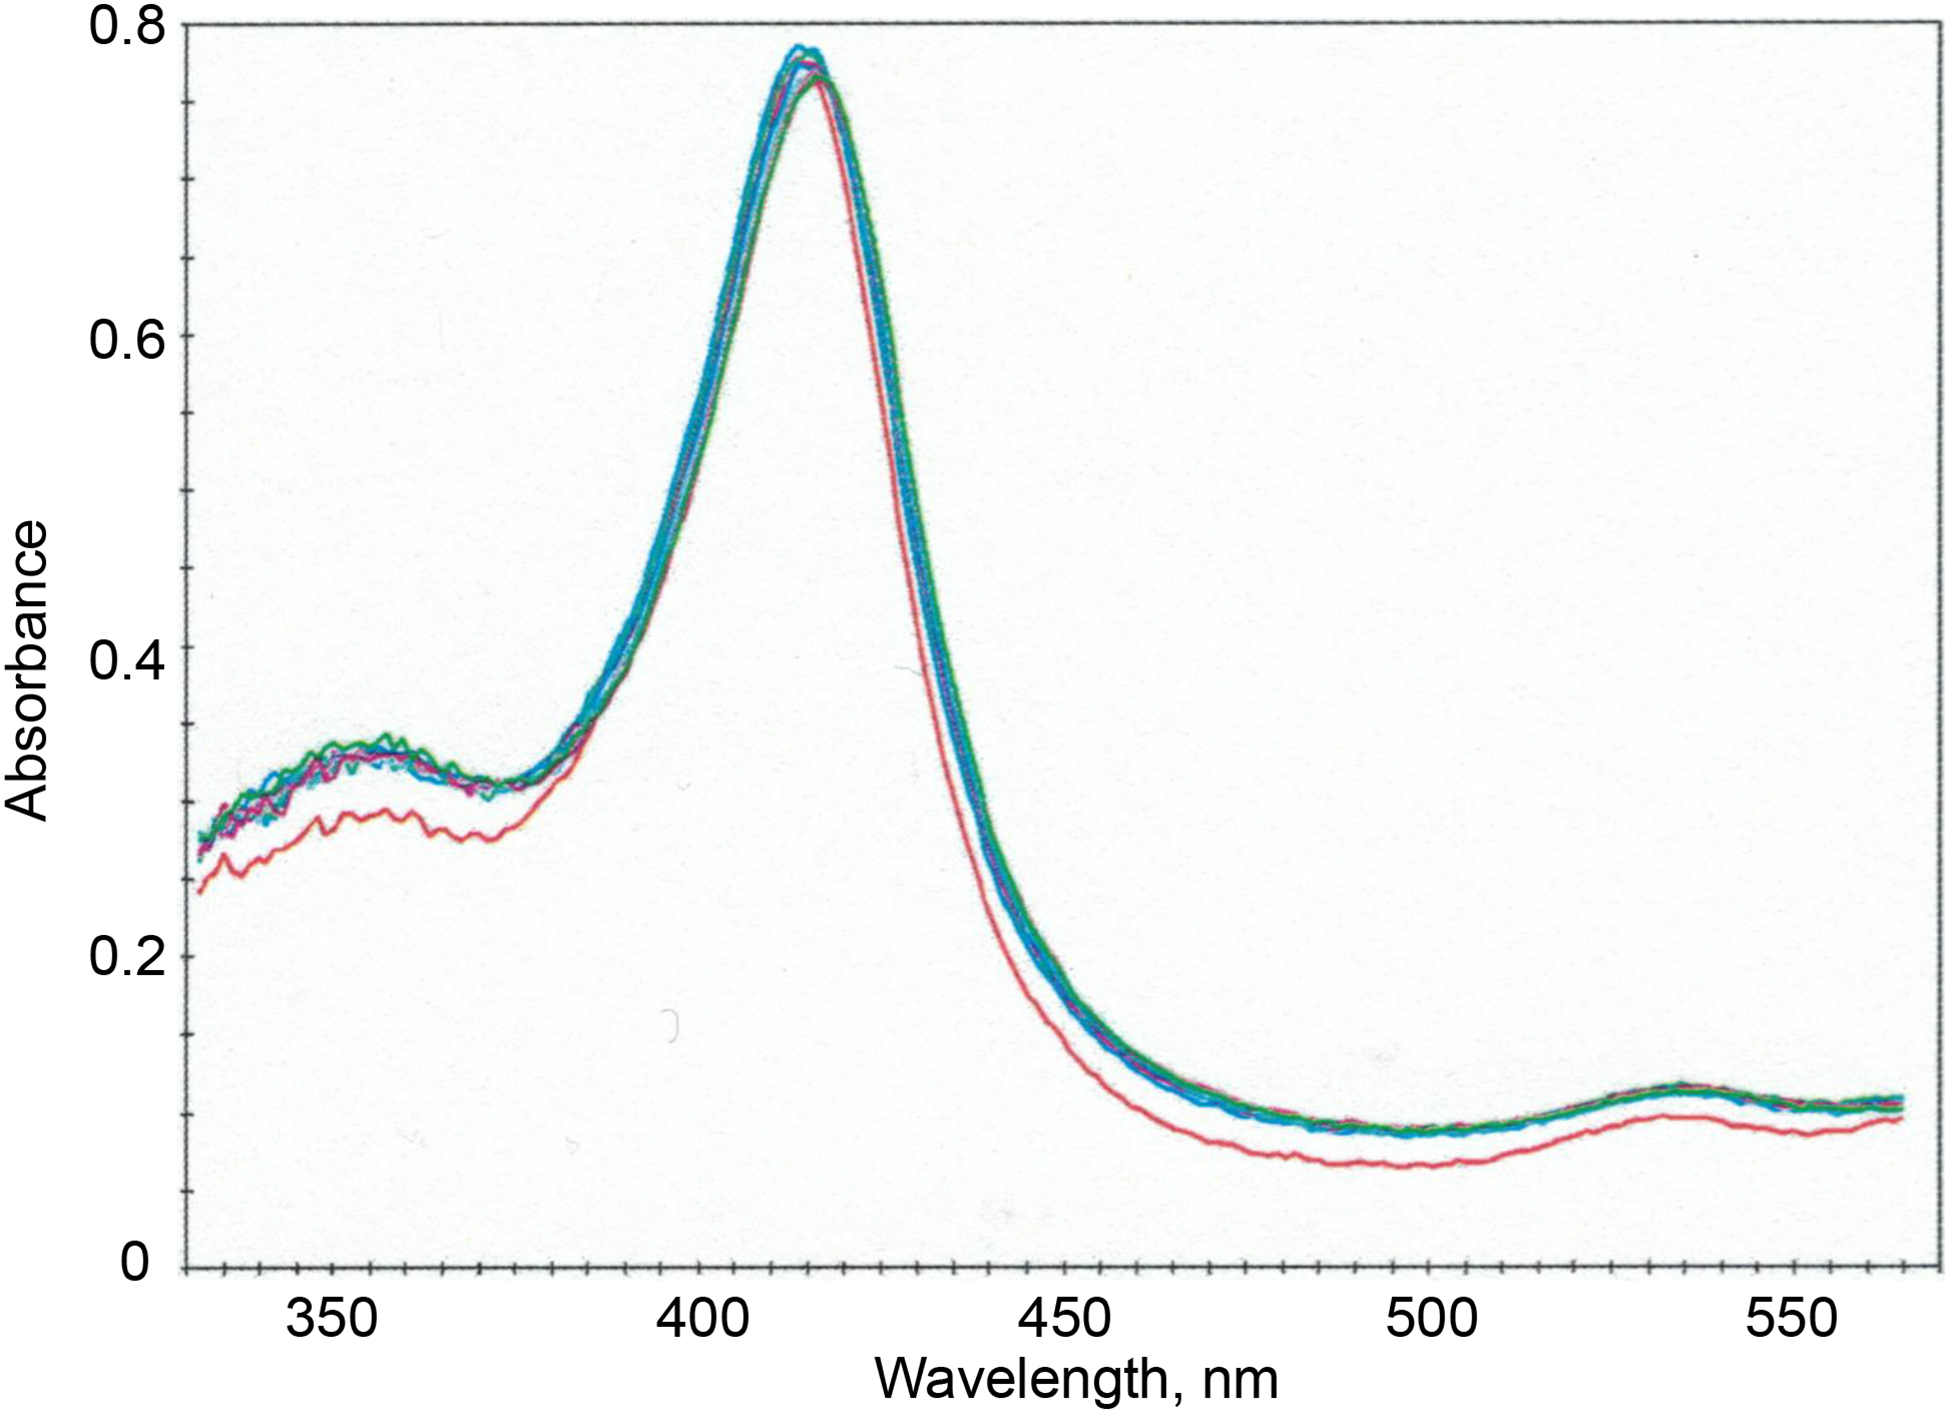
Raw spectra recorded after mixing 2 μM P450 17A1 with 20 μM (S)-orteronel (final concentrations after mixing), spaced over 4 s.
Figure 3.
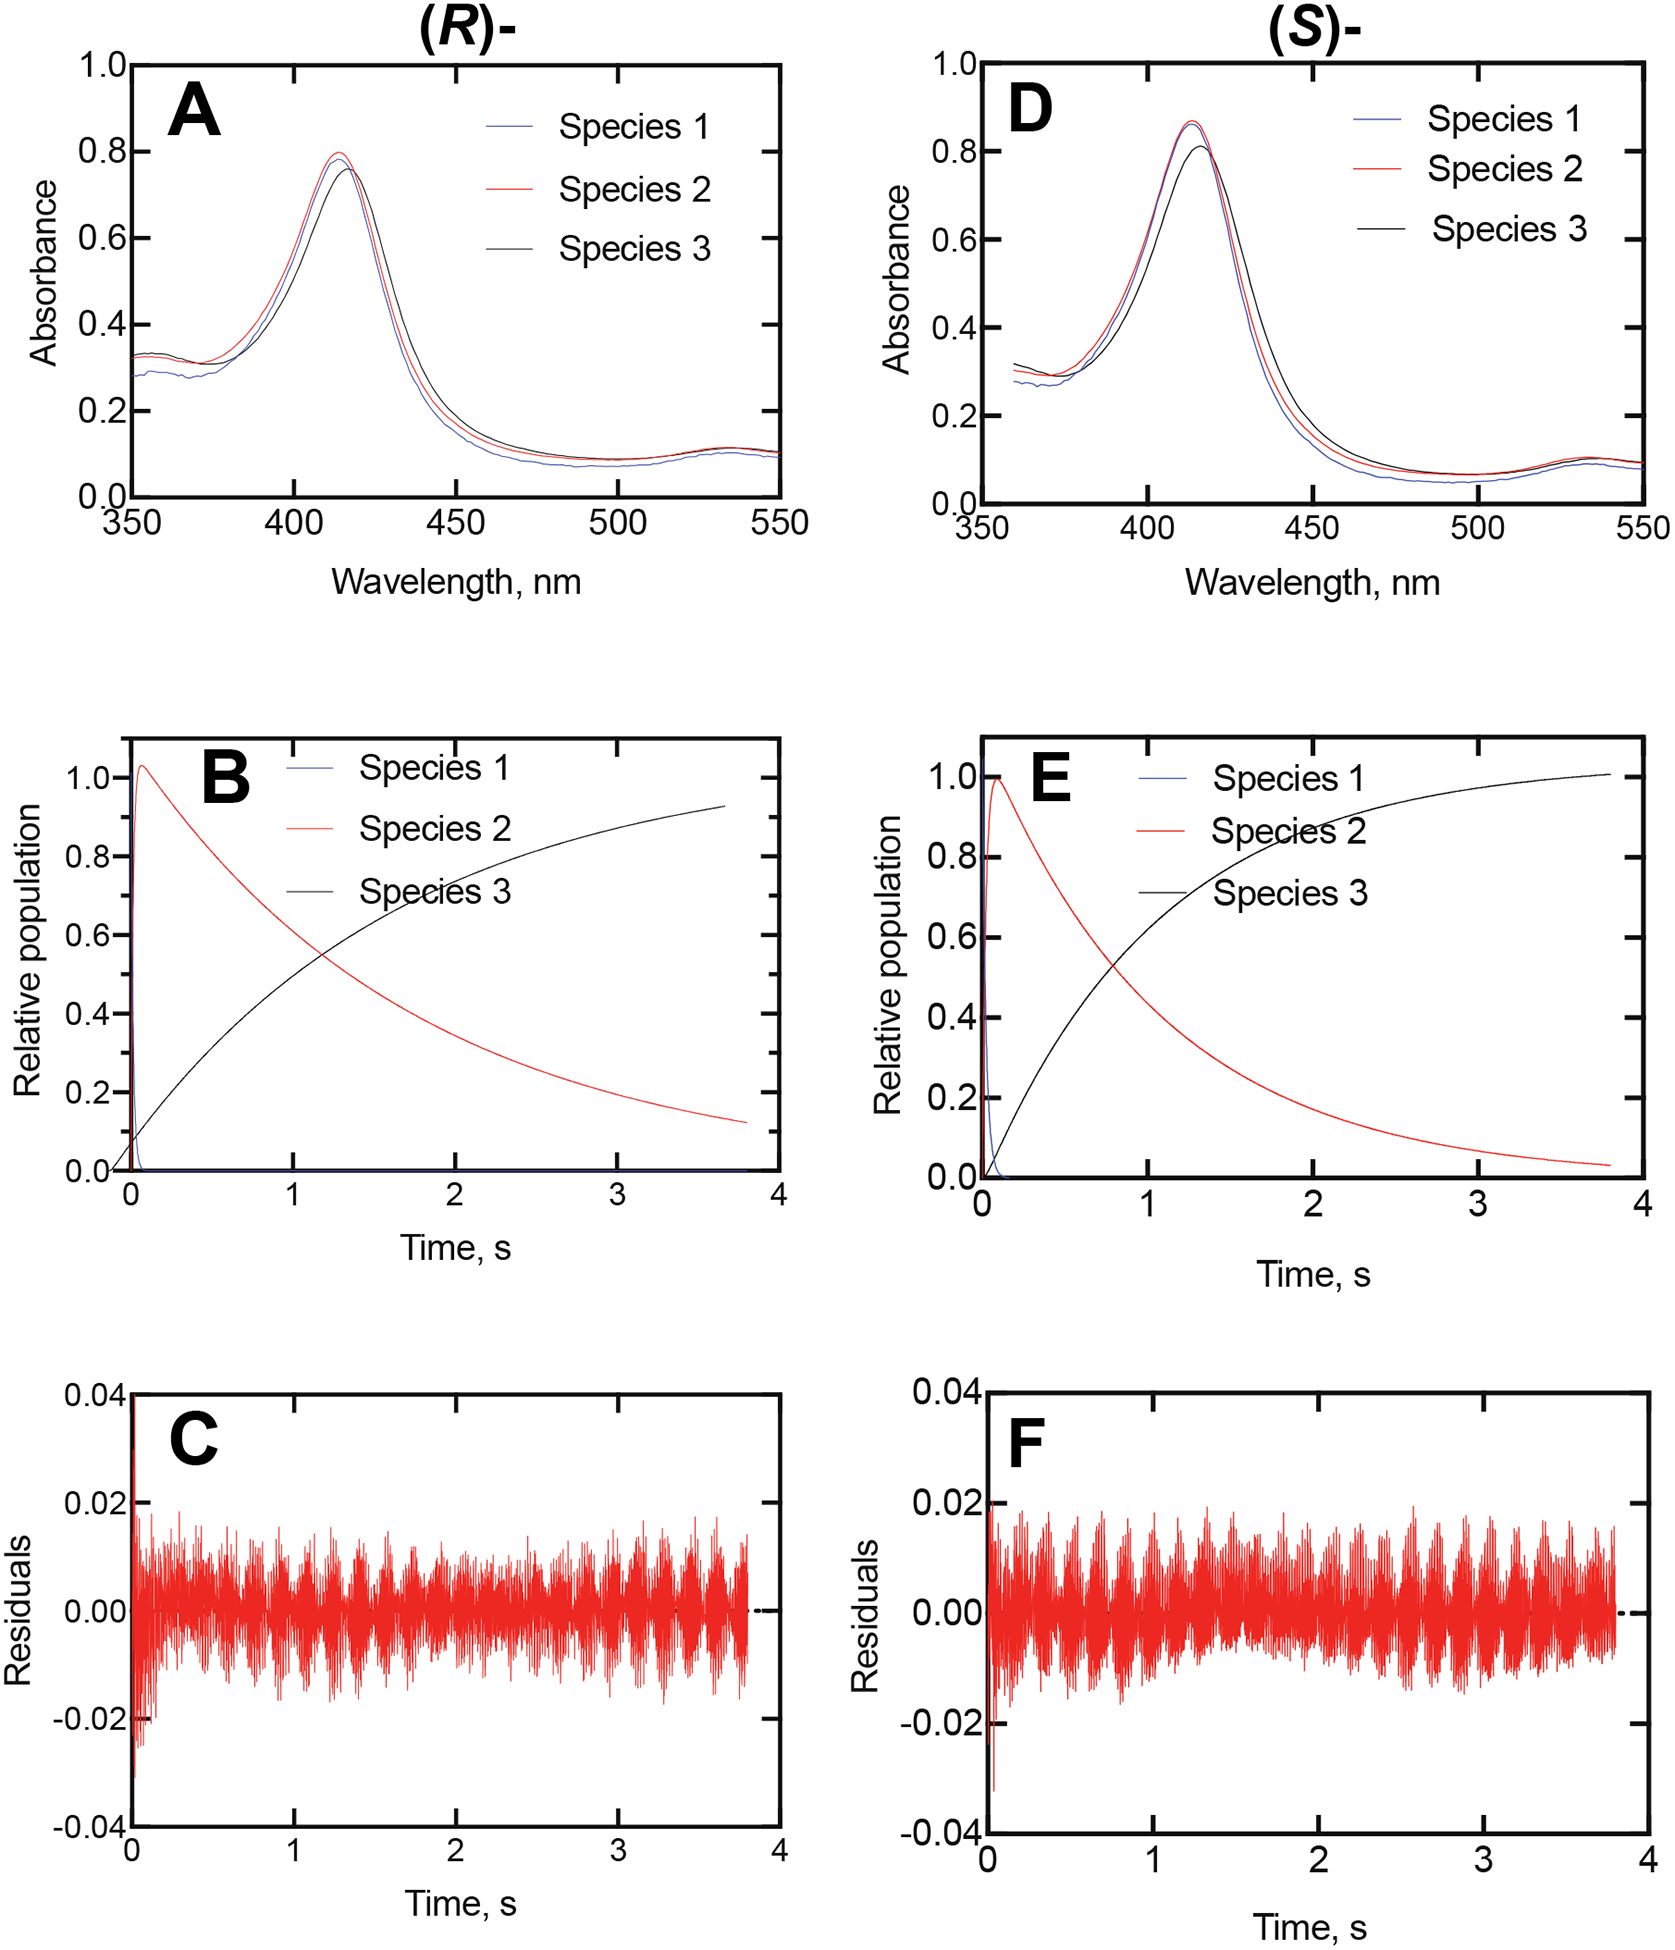
Global fitting of kinetic data from Figure 2. Parts A-C: (R)-Orteronel; Parts D-F: (S)- Orteronel. (A) Fitting of total data (4,000 spectra collected over 4 s) using OLIS GlobalWorks singular value decomposition (SVD) with a 3-component system. (B) SVD fitting of the three species from Part A. Species 1 converted to Species 2 at a rate of 73 ± 6 s−1 and species 2 converted to Species 3 at 0.55 ± 0.10 s−1. (C) Residuals analysis from Part B. (D) Fitting of total data (4,000 spectra collected over 4 s) using OLIS GlobalWorks SVD with a 3-component system. (E) SVD fitting of the three species from Part D. Species 1 converted to Species 2 at a rate of 37 ± 2 s−1 and species 2 converted to Species 3 at 0.93 ± 0.02 s−1. (F) Residuals analysis from Part E.
Some of the spectra were selected from individual experiments. Reaction of 2 μM P450 17A1 with 20 μM (S)-orteronel (final concentrations) is shown in Figures 2 and 4A, with the actual spectral traces at 35 ms and 3.85 s shown. These resemble those predicted by SVD analysis (Figure 3A, 3D). Traces at 360, 390, 413, and 430 nm are shown in Figure 4B, documenting the varying changes in the absorbance at these wavelengths and validating the SVD modeling. The ΔA390 data were fit to a biphasic plot of k1 at 60 ± 7 s−1 (increase) and k2 of 0.88 ± 0.04 s−1 (Figure 4C, 4D), similar to Figure 3B, 3E.
Figure 4.
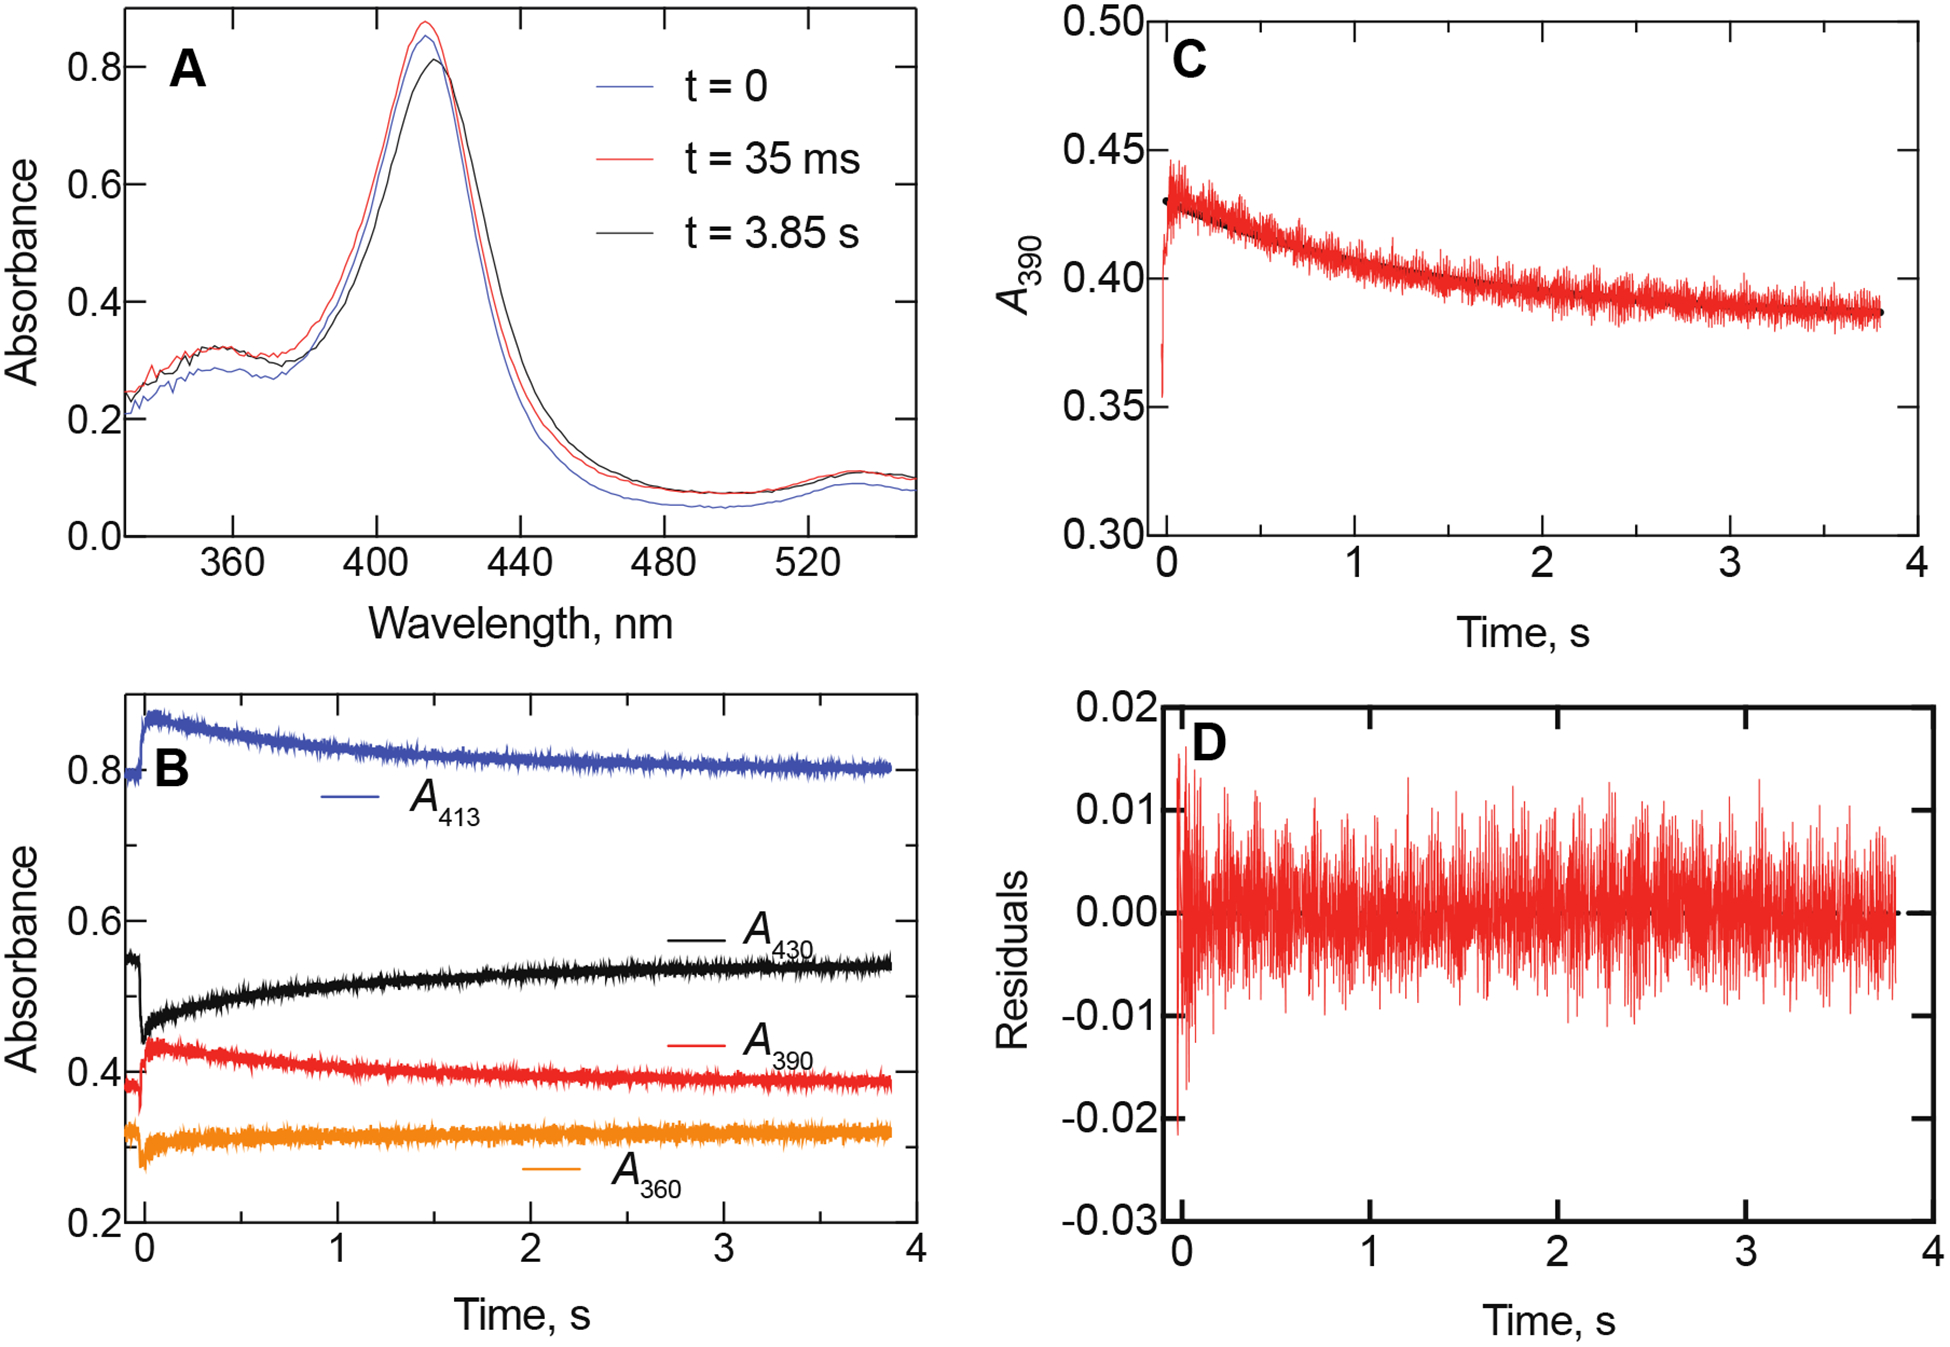
Spectral changes observed in reaction of (S)-orteronel with P450 17A1. The P450 concentration was 2 μM and the (S)-orteronel concentration was 20 μM (final concentrations in observation cell). A total of 4,000 spectra was collected over a period of 4 s. (A) The spectra are shown at times 0, 35 ms, and 3.85 s. Compare with Figure 3A. (B) Kinetic traces are shown for different wavelengths. Note the opposite directions of the changes following mixing and the gradual changes following the initial response. (C) Plot of ΔA390 changes. The rate of the initial increase was 60 ± 7 s−1 and the second (decrease) was 0.88 ± 0.04 s−1. (D) Residuals trace for plot and rate estimates in Part D.
Traces of ΔA430-A410 were obtained with a lower concentration of P450 17A1 (1 μM, final concentration) and varying concentrations of (S)-orteronel (Figure 5A). The binding was slow and not complete even after 8 seconds (8 second data not shown). A plot of the absorbance changes at 4 seconds vs. the orteronel concentration was consistent with tight binding (i.e., Kd 40 nM) (Figure 5B).5, 6 A plot of the single-exponential rates of binding vs. orteronel concentration suggested a hyperbolic fit (Figure 5C). The first portion of the plot yields a possible rate constant of ~ 5 × 10⁵ M−1 s−1 (compare with Figure 1B). The rates of the initial change (ΔA392-A416) were linear with respect to the orteronel concentration (Figure 5D), yielding an apparent on-rate constant of ~ 2.5 × 10⁷ M−1 s−1.
Figure 5.
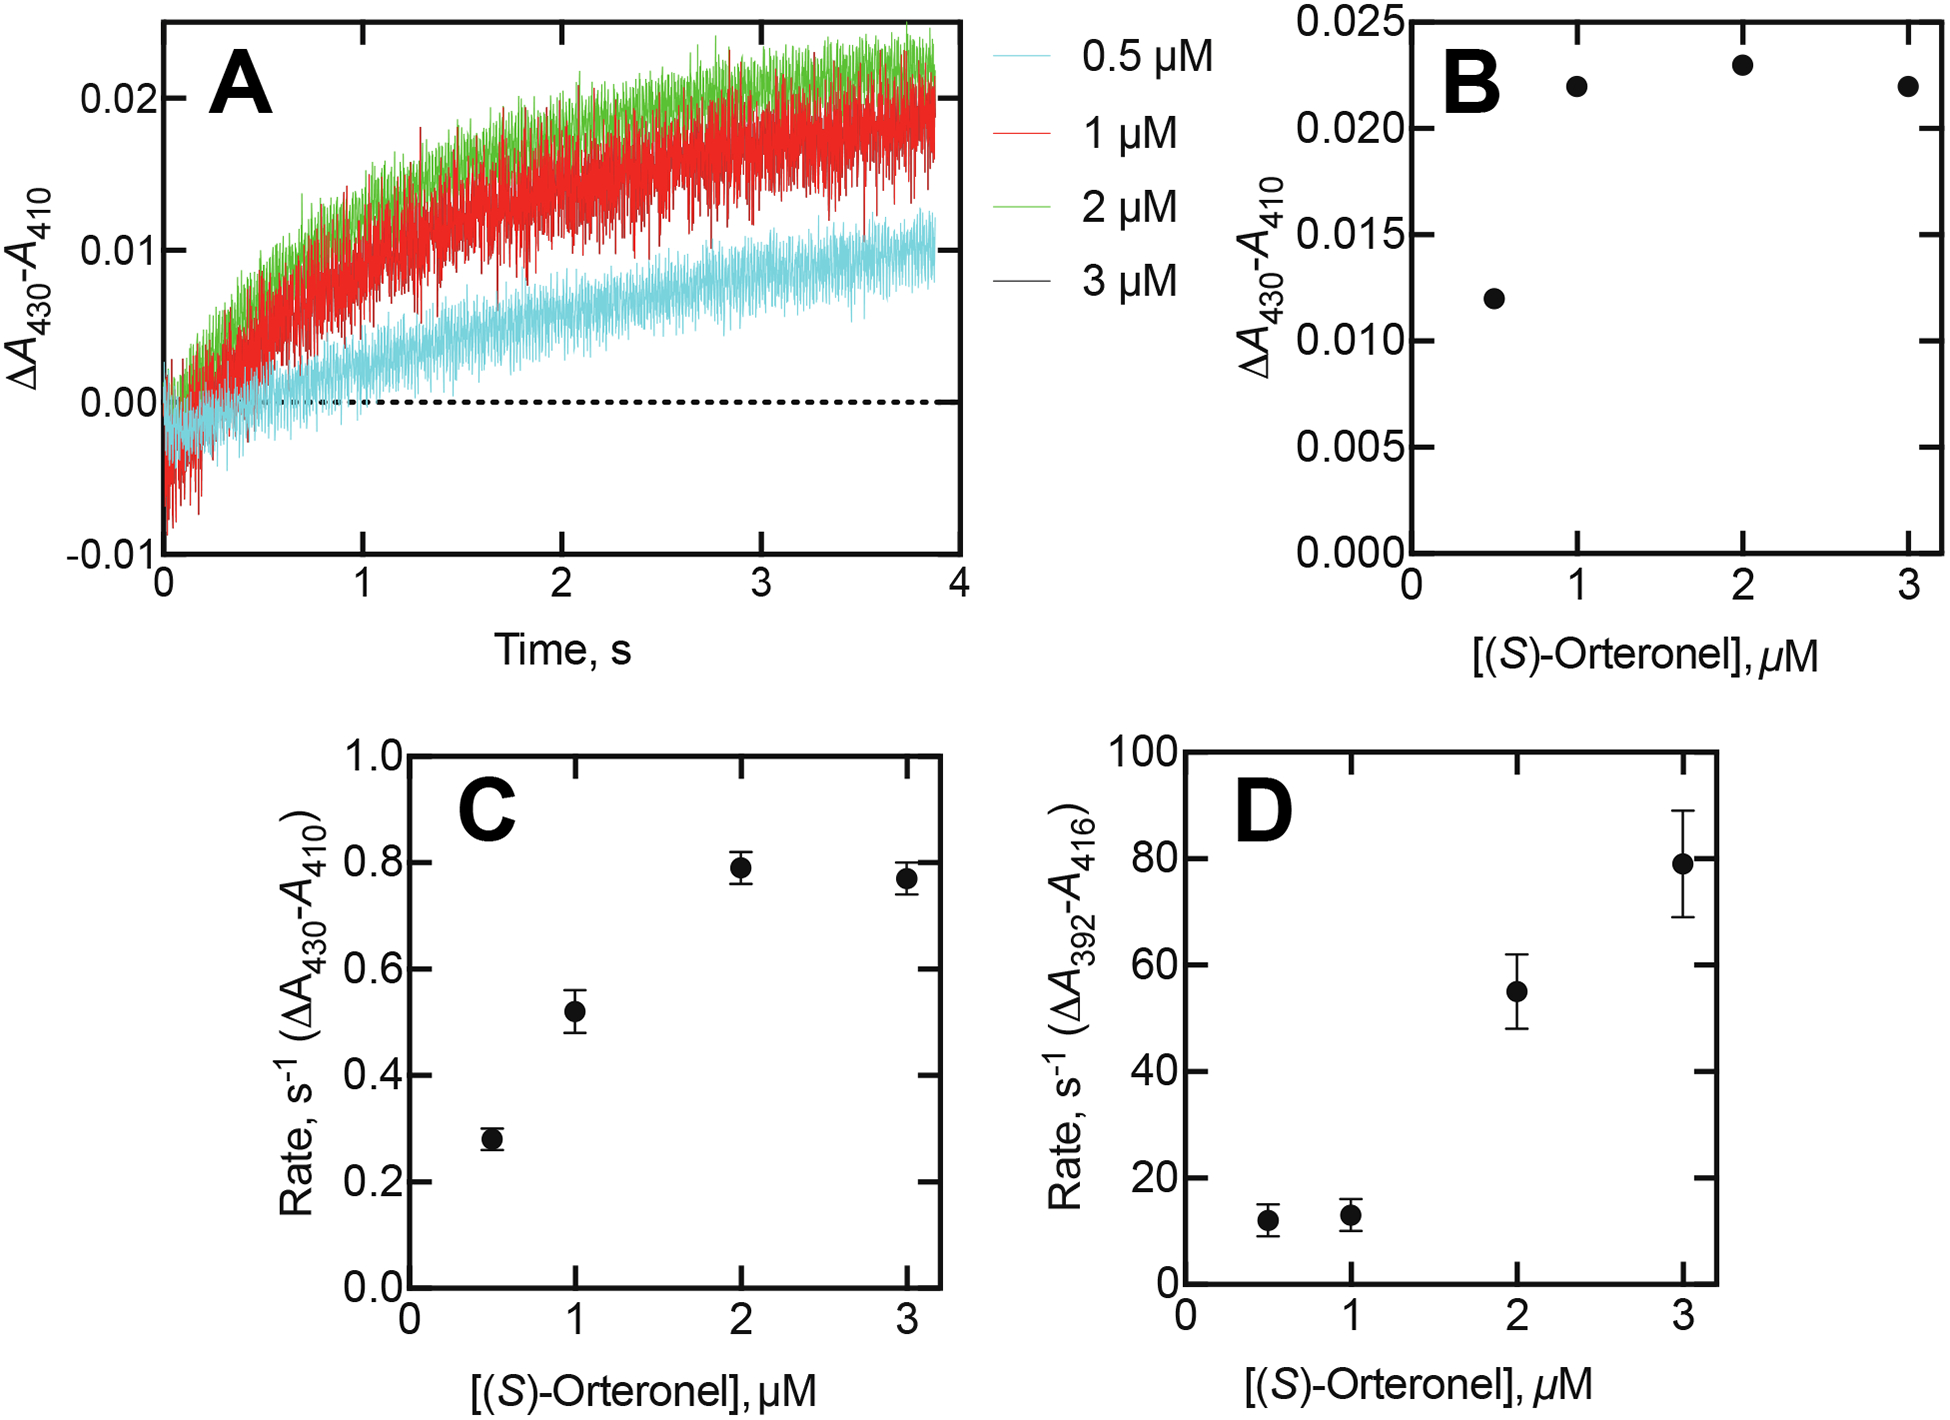
Kinetics of P450 17A1 spectral changes observed with varying concentrations of (S)-orteronel. See Figure 1. The P450 17A1 concentration was 1 μM (final concentration in observation cell), and the orteronel concentrations are indicated. (A) ΔA430-A410 traces. (B) Magnitude of spectral change observed after 4 s. (C) Rates of changes (Part A) as a function of orteronel concentration (estimated from fits to single exponentials). (D) Rates of ΔA392-A416 changes plotted versus orteronel concentration.
Spectra of P450 17A1 and (S)-seviteronel complexes
Seviteronel (VT-464) is another non-steroidal, naphthalene-based drug candidate, which is still in clinical trials. It is also a strong inhibitor of P450 17A1 and was of interest in terms of the unexpected kinetic results obtained with orteronel (Figures 2–4).
Steady-state spectroscopy showed a classic Type II binding spectrum with P450 17A1 (Figure 6), due to the triazole moiety. Mixing P450 17A1 and (S)-seviteronel yielded a series of spectra, and SVD global fitting indicated similarity to those observed with (R)- and (S)-orteronel (Figure 3), although possibly with different rate constants (Figure 7).
Figure 6.
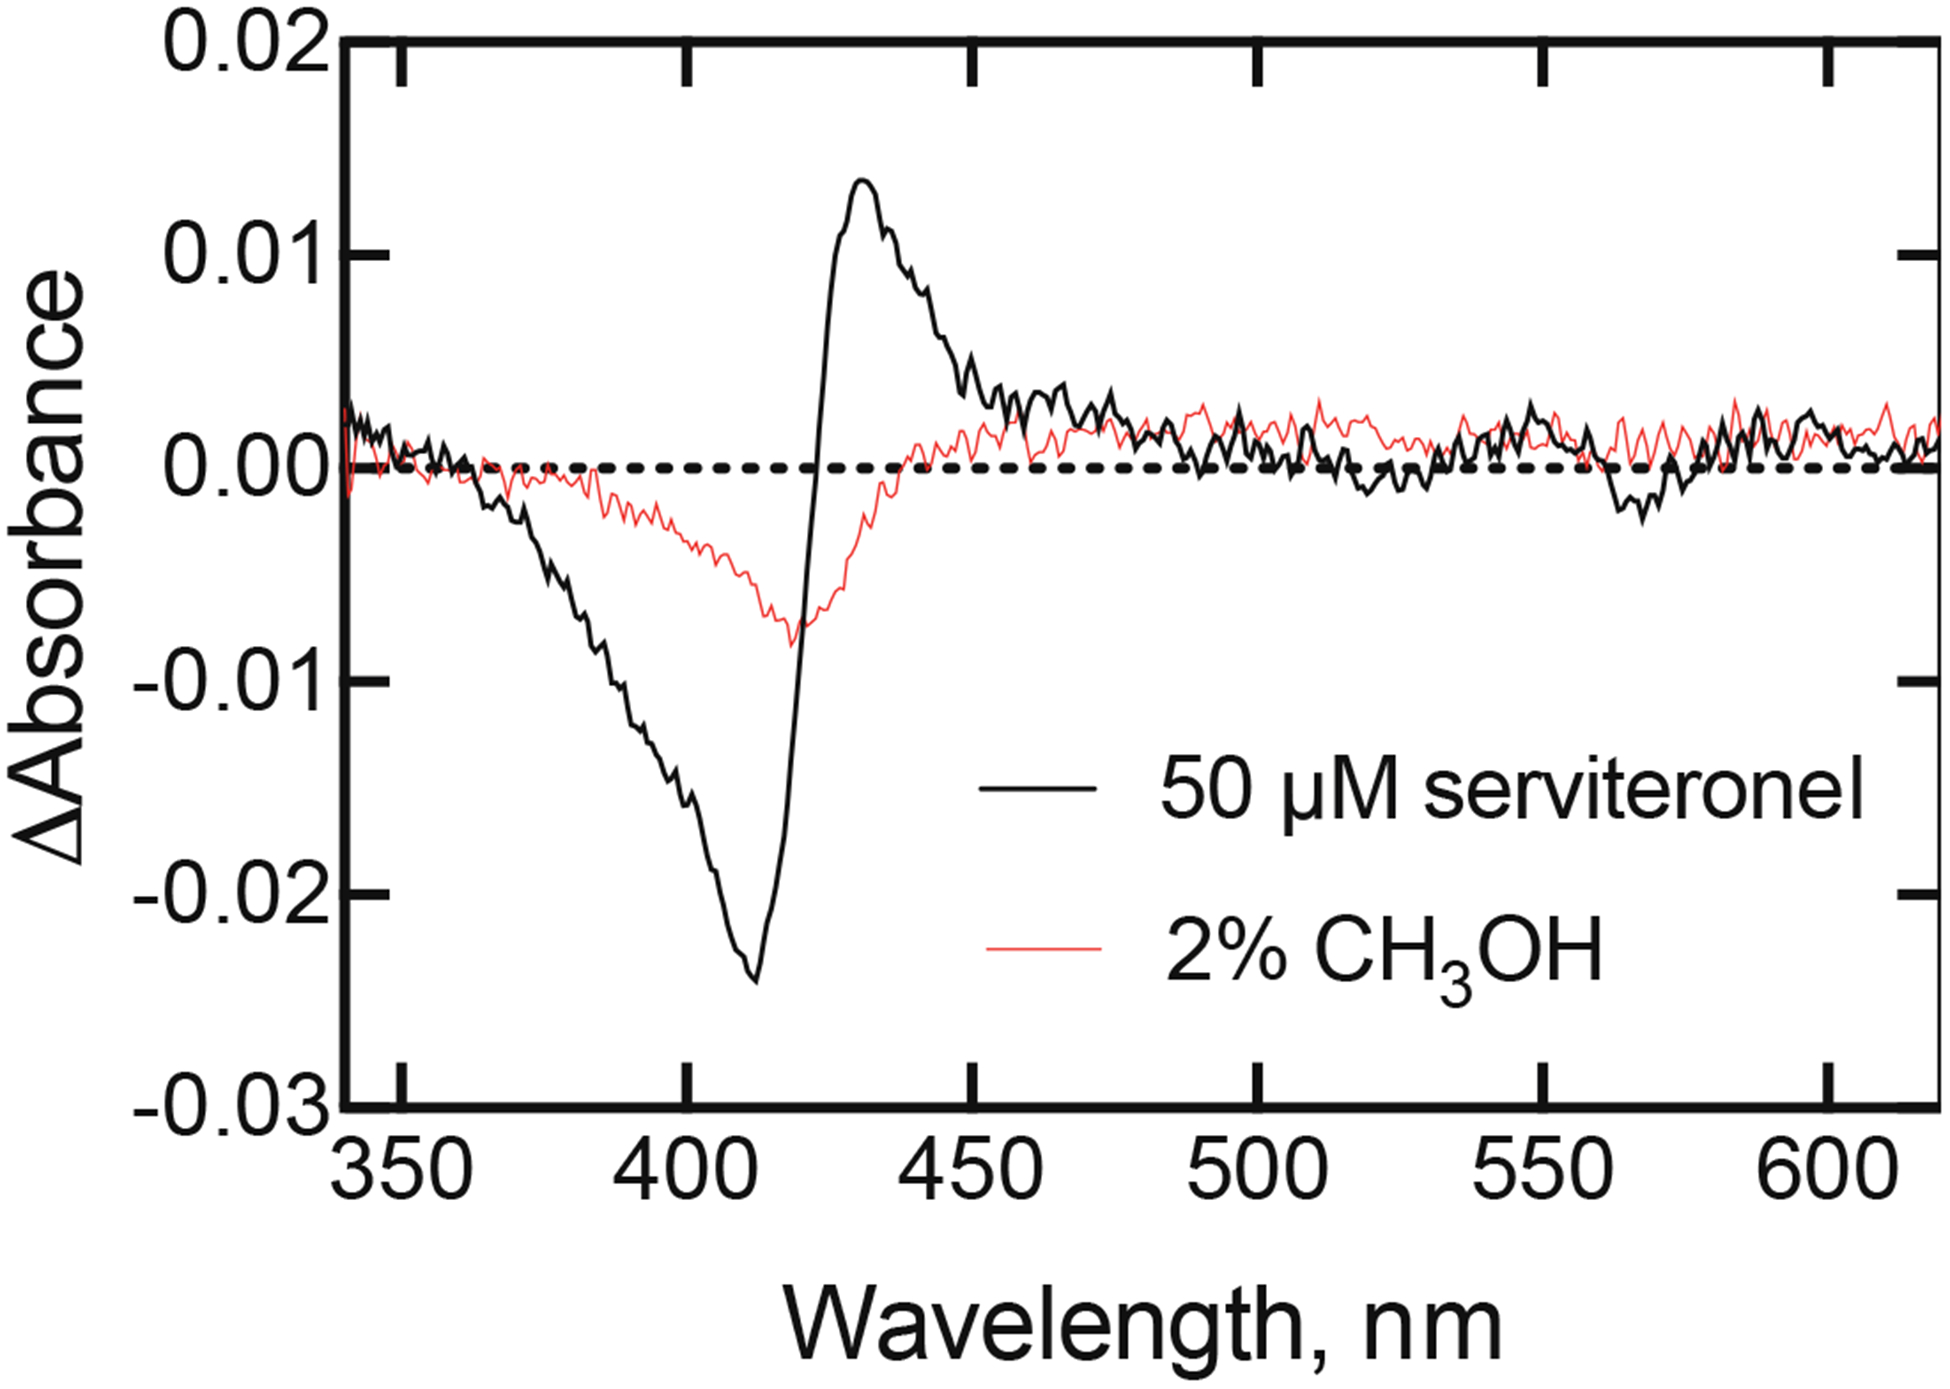
Difference spectra of P450 17A1 with methanol and (S)-seviteronel. The concentration of P450 17A1 was 1 μM (in 50 mM potassium phosphate buffer, pH 7.4). Methanol was added to 2% (v/v) and the spectrum was recorded, subtracting the original spectrum. The decrease in absorbance at 420 nm (~ 0.005 compared to 0.14) is approximately what would be expected for the dilution effect. Note that the absorbance changes at several wavelengths (e.g. 390 nm, 430 nm) are not in the same direction as the initial spectral complex formed with orteronel or seviteronel and the methanol effect cannot explain the observed changes (Figures 4,B, 8B). (S)-Seviteronel (50 μM) was then added (along with another 0.5% methanol, v/v) and the 2% methanol spectrum was subtracted from this.
Figure 7.
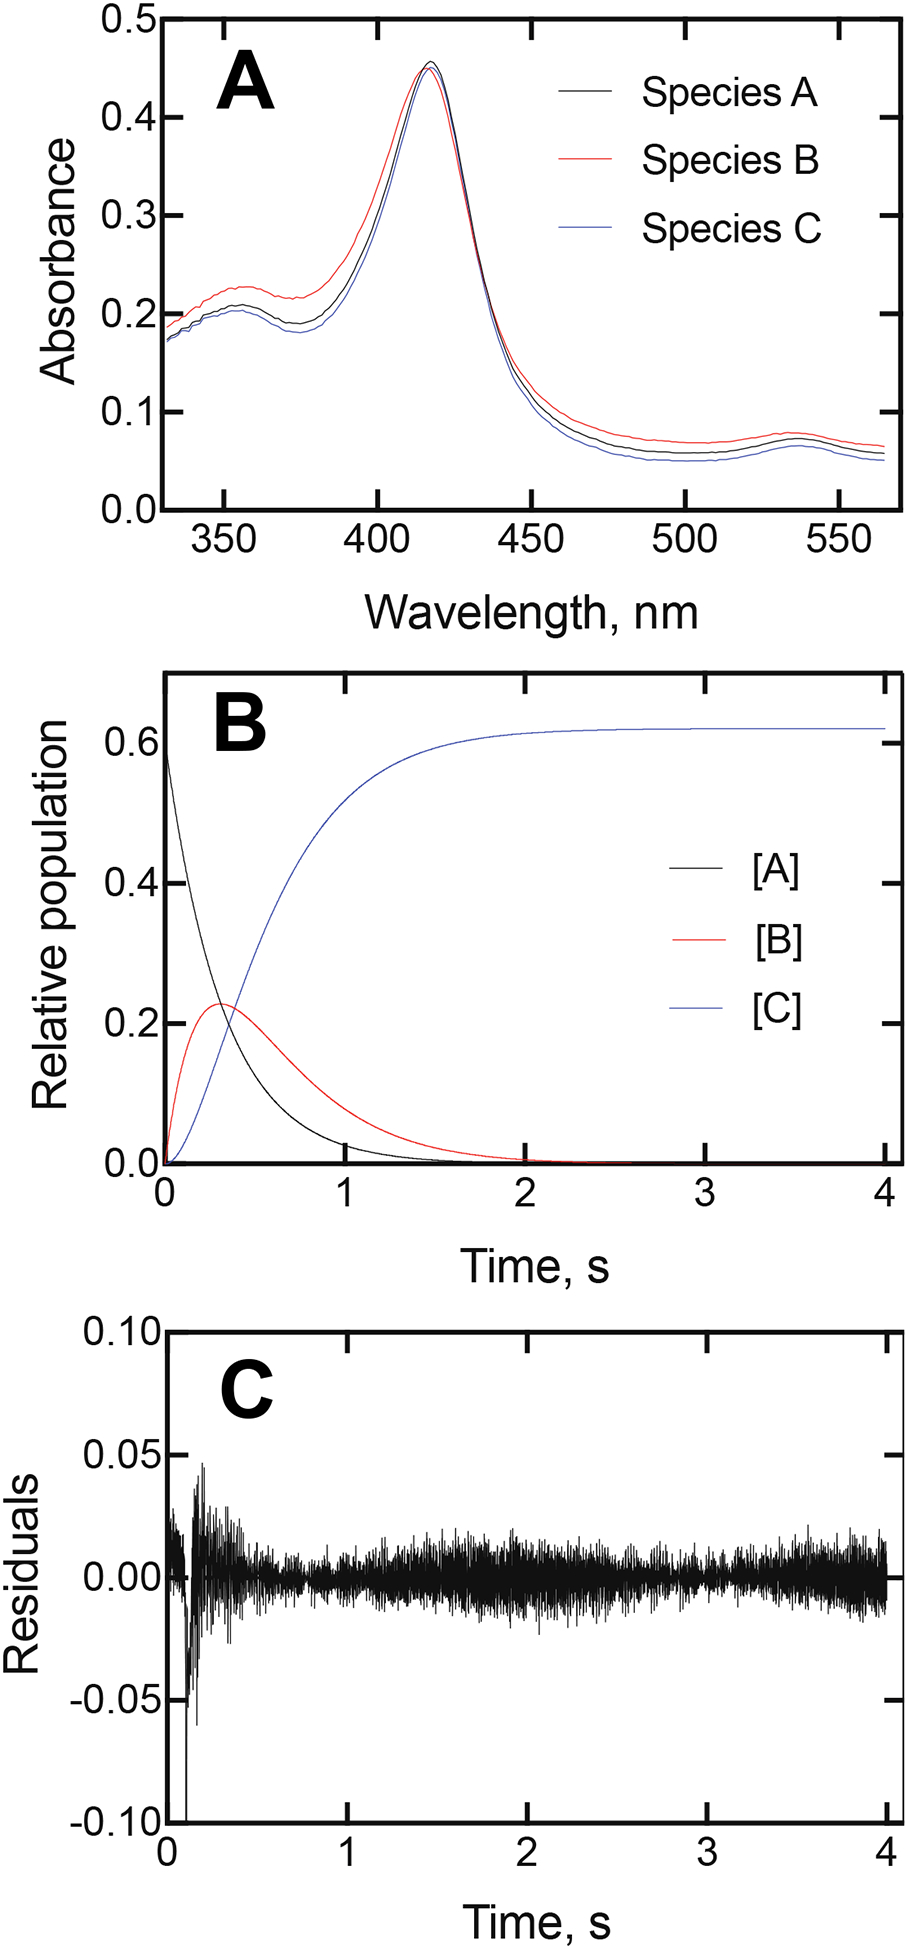
Global fitting of mixing of 2 μM P450 17A1 and 20 μM (S)-seviteronel (final concentrations, in 50 mM potassium phosphate buffer, pH 7.4). (A) Global fitting to a 3-species system using OLIS GlobalWorks SVD. (B) Time courses predicted from Part A. (C) Residuals traced for kinetic fits in Part B.
Actual analysis of the spectra recorded at different times did show three spectra (at times of 115 ms (mixing, corrected t= 0), 180 ms (actually 65 ms after mixing occurred), and 4 s (Figure 8A). Although (as in Figure 4), the spectra are very similar, Analysis of kinetic traces at the critical wavelengths (Figure 6) showed (i) the existence of an intermediate species at 180 ms and (ii) absorbance changes in opposite directions at these wavelengths (Figure 8B).
Figure 8.
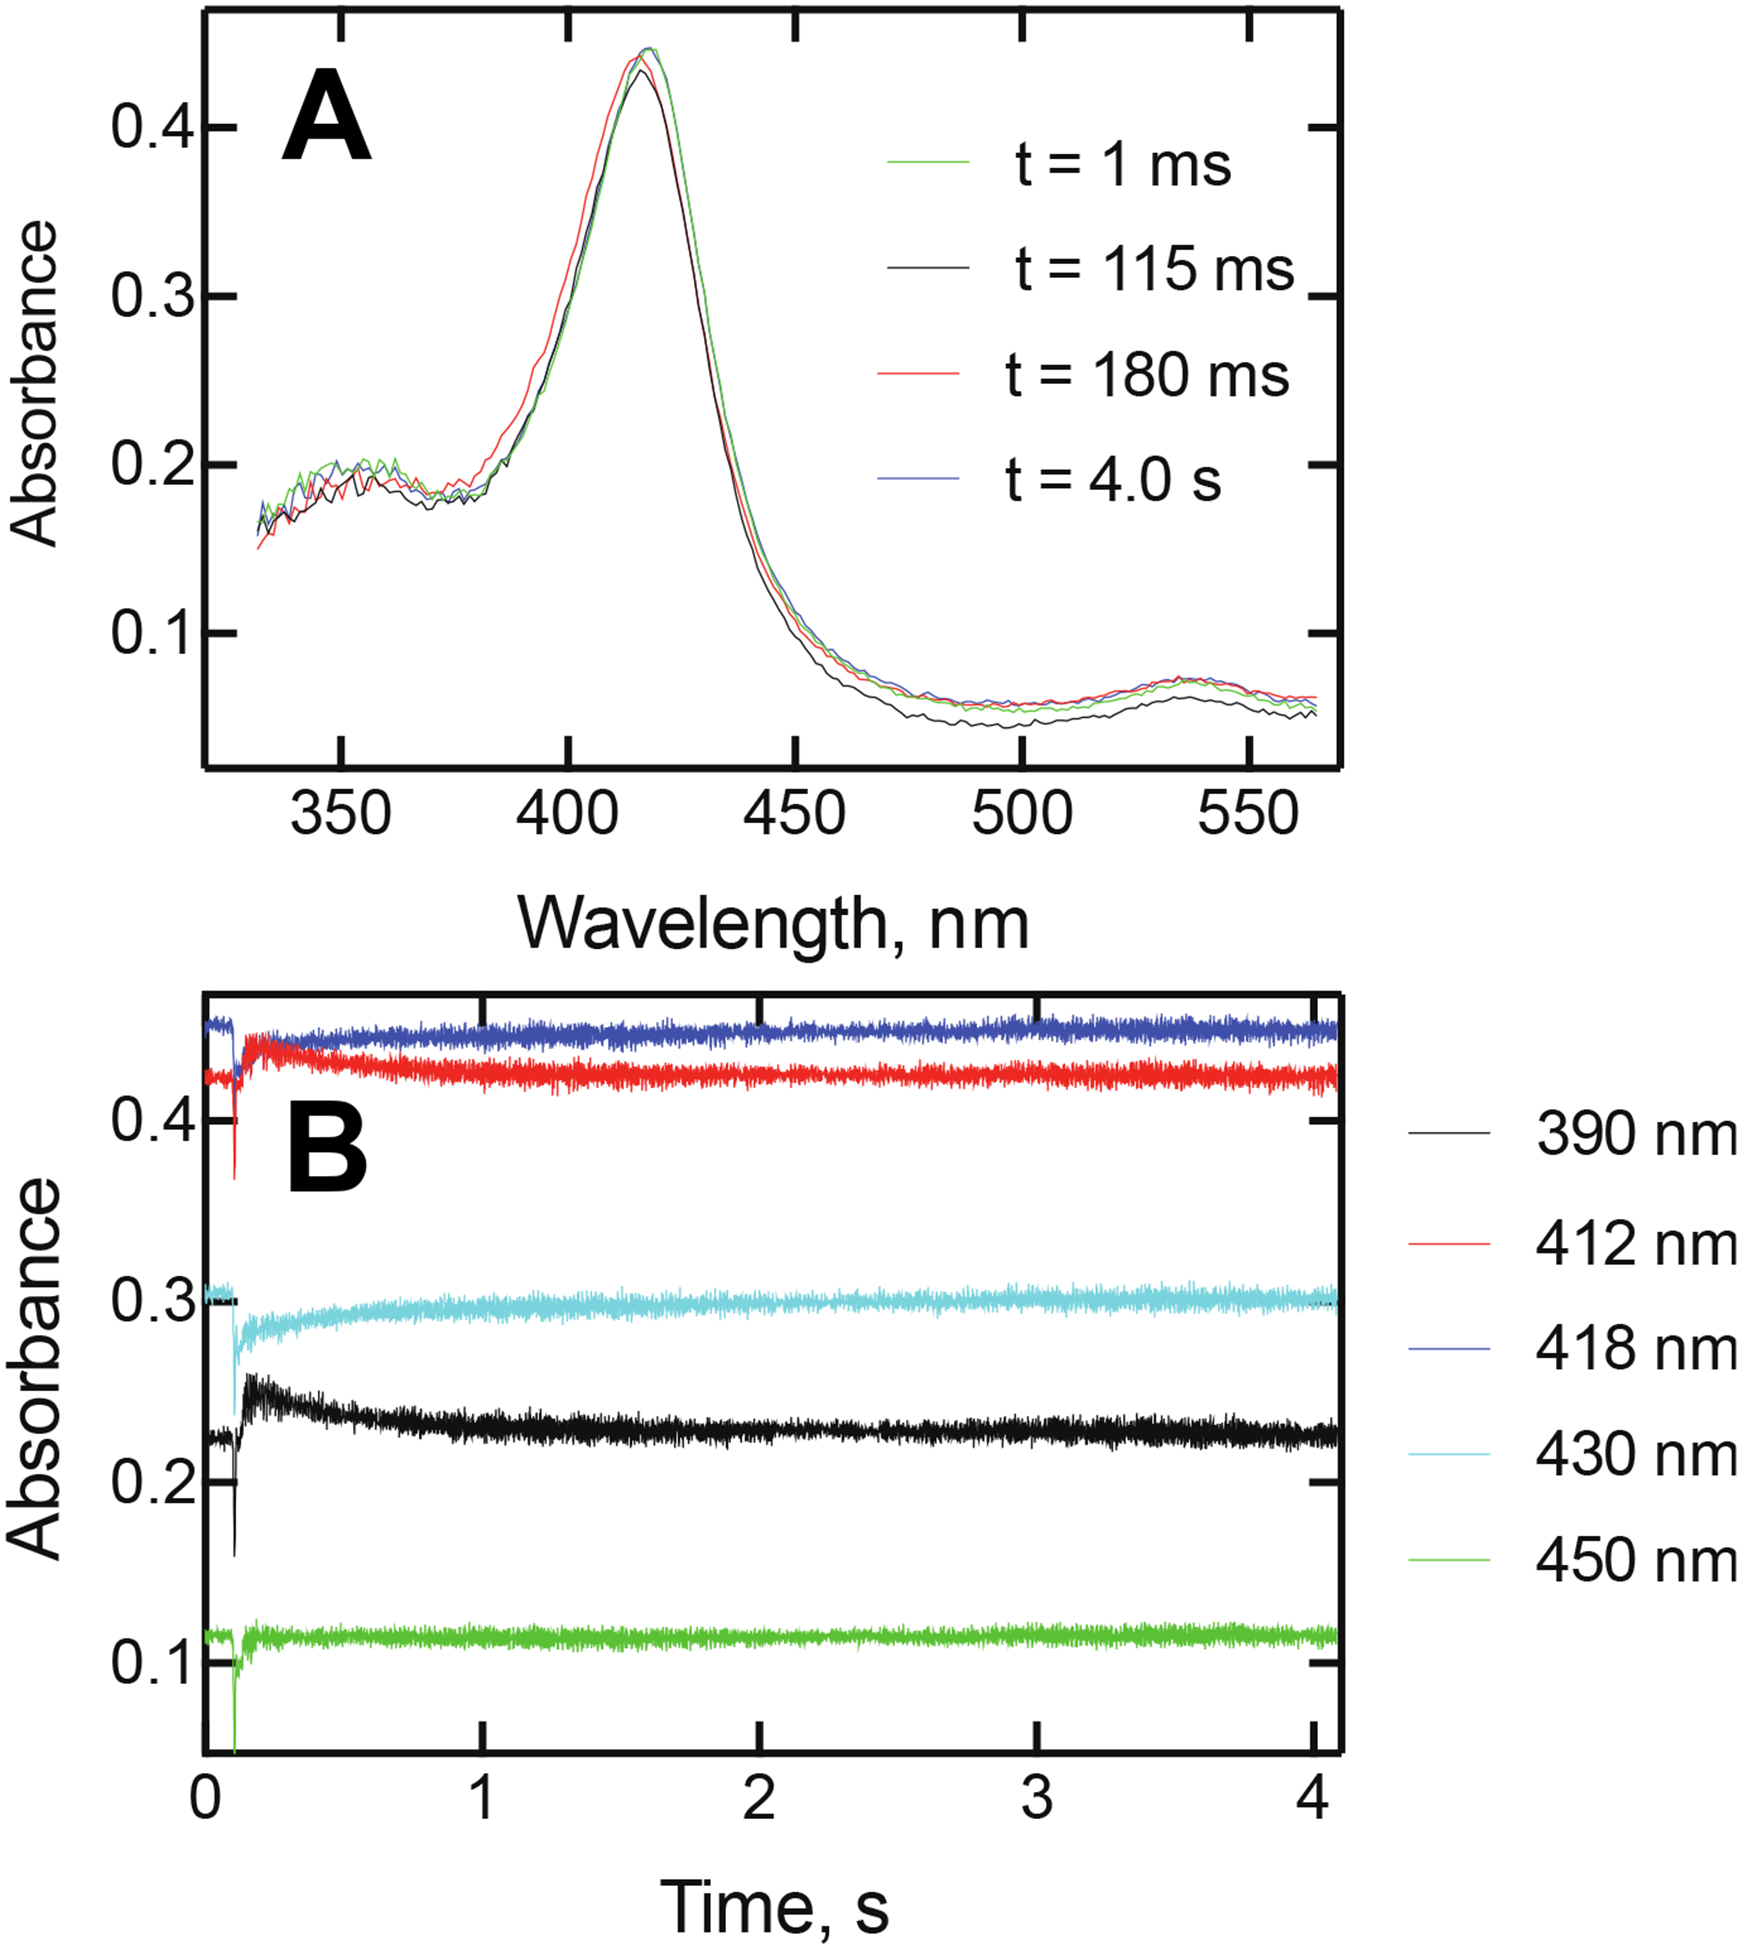
Spectra and kinetics of reaction of P450 17A1 with (S)-seviteronel. (A) Spectra of P450 17A1 species obtained upon mixing 2 μM P450 17A1 and 20 μM (S)-seviteronel (final concentrations after mixing, methanol concentration 0.1%, v/v) in 50 mM potassium phosphate buffer (pH 7.4). The spectra were collected at the indicated times. The 115 ms spectrum (red) is immediately prior to the mixing step and in of unliganded P450 17A1. The peak shifted to the 180 ms spectrum (elapsed time 65 ms) at its maximum intensity and then changed to the t = 4 s spectrum. (B) Traces of absorbance at 390, 412, 418, 430, and 450 nm. Note opposite directions for absorbance changes after mixing. The 450 nm trace is included to show the lack of absorbance drift, aside from the initial mixing artifact.
Further analysis of the spectral changes (Figure 9) showed, as in the case of orteronel (Figure 4C), biphasic changes with rather similar rates. In this case the rate of the first step was 44–45 s−1 and the rate of the second reaction was 1.9 s−1 (compare with 60 and 0.88 s−1 for orteronel, Figure 4C).
Figure 9.
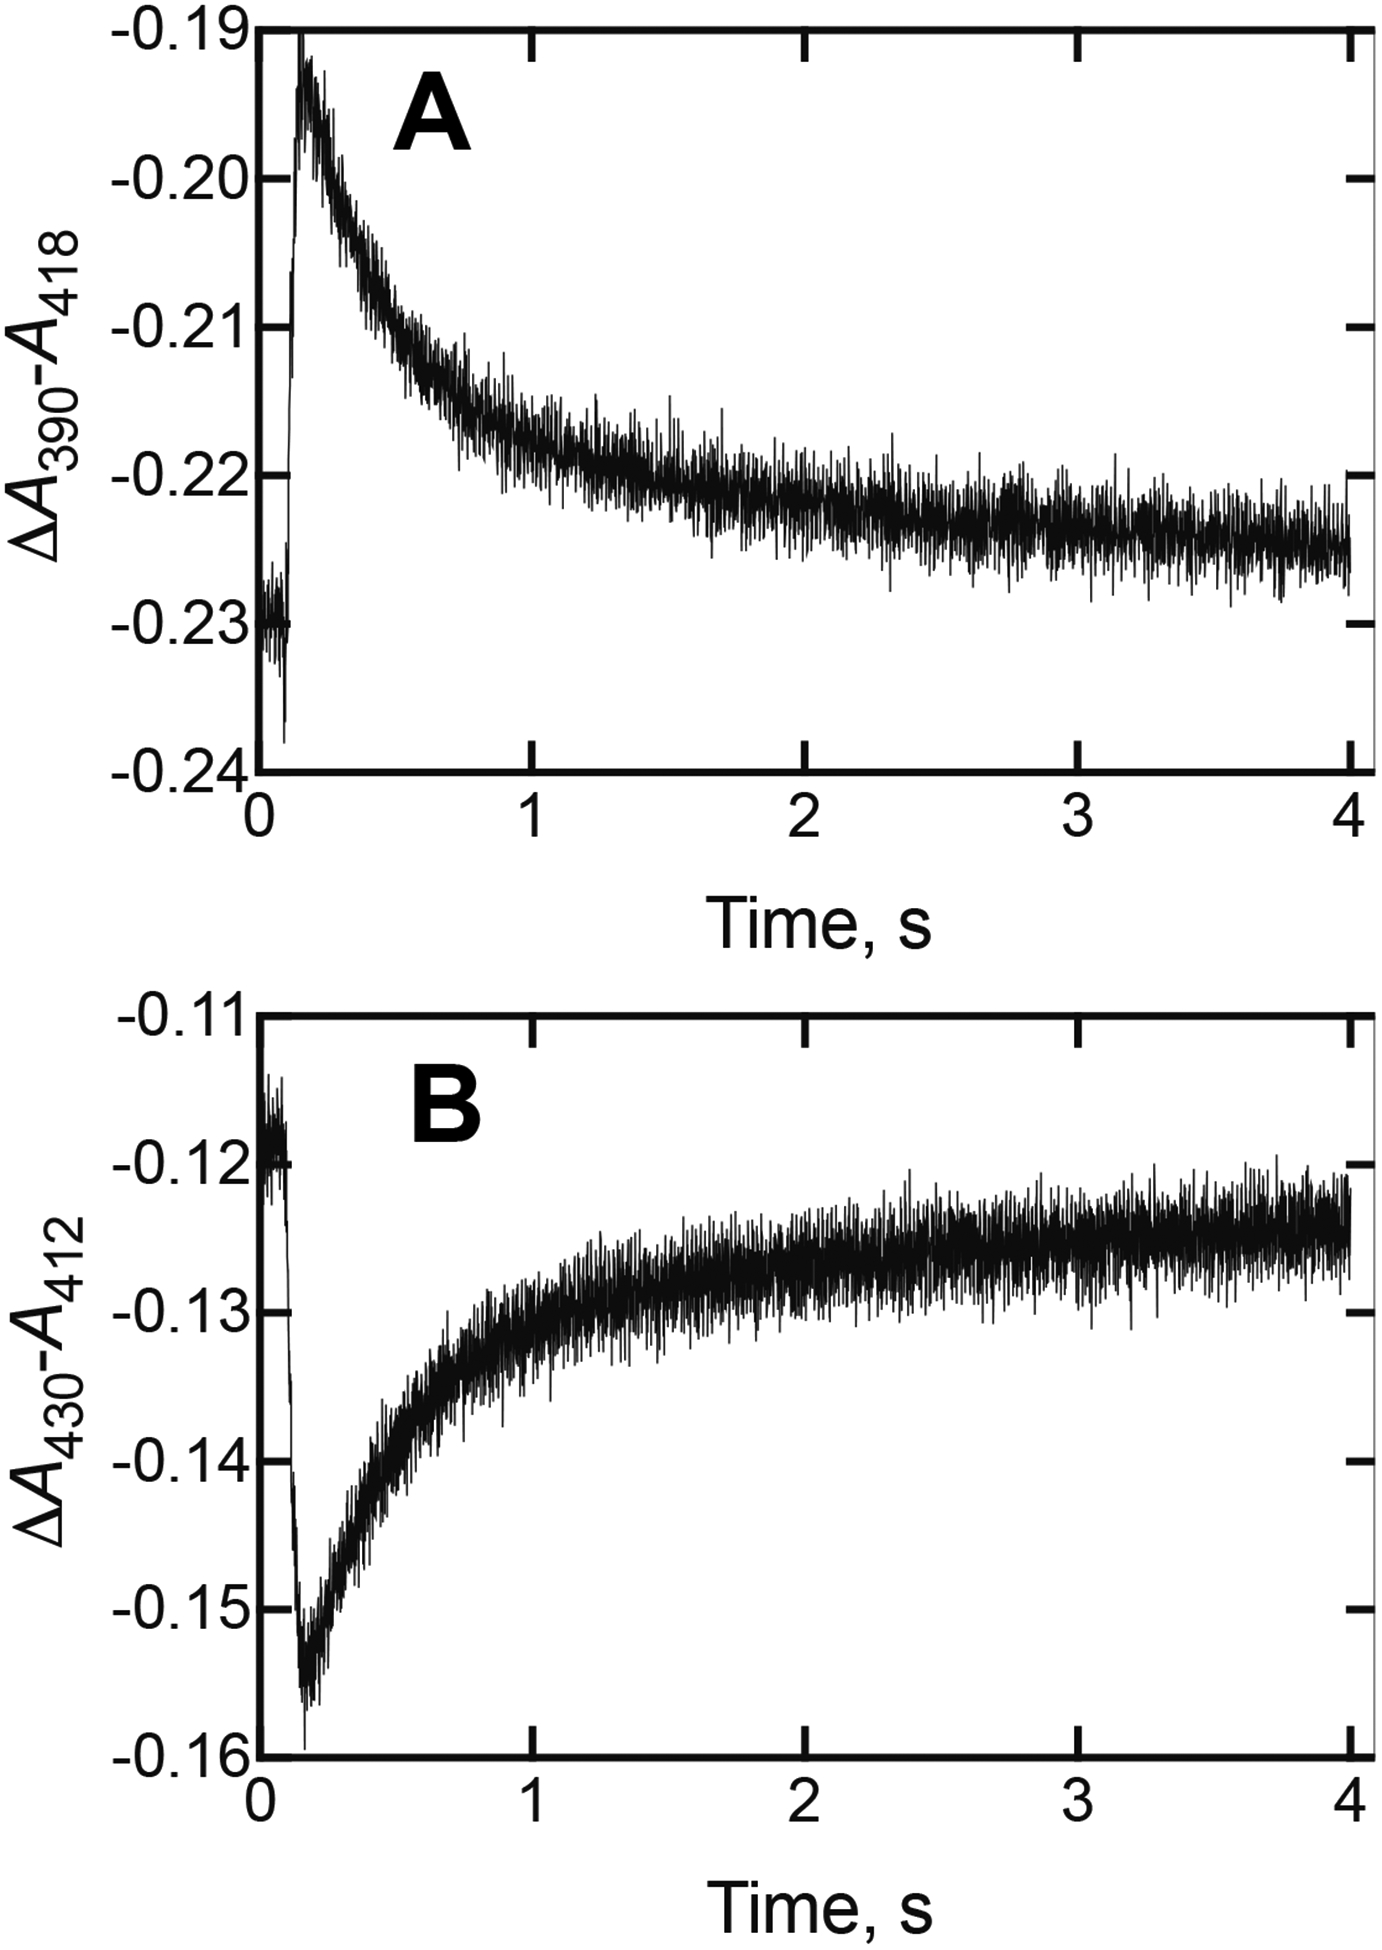
Kinetic analysis of spectral changes observed upon mixing P450 17A1 and (S)-seviteronel (Figures, 7, 8). (A) Plot of ΔA390-A418 vs. time. The two changes were separated (115–180 ms and 180 ms −4 s) and fit to first-order rates of 44 ± 3 s−1 and 1.9 ± 0.1 s−1, using the OLIS GlobalWorks software and single-exponential fitting. (B) Plot of ΔA430-A412 vs. time, which was fit in the same way to first-order rates of 45 ± 2 s−1 and 1.9 ± 0.1 s−1.
Kinetic analysis of inhibition mechanism
The multi-step binding of both (R)- and (S)-enantiomers of orteronel to P450 17A1 (Figures 1–5) raised the possibility that the inhibition could be the result of a slow, tight-binding mechanism, which has been demonstrated for several enzyme inhibitors21–24 but to our knowledge has not been documented with a P450. We considered two alternative mechanisms (Table 1): (i) a slow, tight-binding mechanism in which the initial binding of the inhibitor (I) is loose (Kd ~ 10 μM) and then conversion to a more tightly bound form (ÉI) occurs at a rate of ~ 1 s−1 (Figures 3, 4; Table 1A) with a forward to reverse equilibrium of 1000. The value k5 = 1 s−1 is drawn from the spectral work (Figures 3, 4) and k−5 =0.001 s−1 is arbitrary (but will influence some of the fitting). The value 0.001 s−1 corresponds to a t1/2 of 13 min, which seems reasonable in light of the literature on slow, tight-binding inhibitor drugs.13, 15, 16 (ii) The alternative mechanism has tight binding of the initial complex (Kd ~ 100 nM), and the complex is inhibitory itself. It does rearrange to form the final stable complex but that step is mathematically silent in the inhibition model, in that both EI and FI are equally inhibitory (Table 1B).
Table 1.
Alternate Kinetic Models for Orteronel Bindinga
| A. Slow, tight-binding inhibition | B. Direct inhibition | ||||||
|---|---|---|---|---|---|---|---|
| k1 | k1 | ||||||
| E + S | ⇄ | ES | k1 106 M−1 s−1, k−1 0.45 s−1 | E + S | ⇄ | ES | k1 106 M−1 s−1, k−1 0.45 s−1 |
| k−1 | k−1 | ||||||
| k2 | k2 | ||||||
| ES | → | EP | k2 0.06 s−1 | ES | → | EP | k2 0.06 s−1 |
| k3 | k3 | ||||||
| EP | ⇄ | E + P | k3 0.8 s−1, k−3 106 M−1 s−1 | EP | ⇄ | E + P | k3 0.8 s−1, k−3 106 M−1 s−1 |
| k−3 | k−3 | ||||||
| k4 | k4 | ||||||
| E + I | ⇄ | EI | k4 15 × 106 M−1 s−1, k−4 150 s−1 | E + I | ⇄ | EI | k4 15 × 106 M−1 s−1, k−4 1.5 s−1 |
| k−4 | k−4 | ||||||
| k5 | k5 | ||||||
| EI | ⇄ | FI | k5 1 s−1, k−5 0.001 s−1 | EI | ⇄ | FI | k5 0, k−5 0 |
| k−5 | k−5 | ||||||
System used in Kintek Explorer software. E: P450 17A1, F: conformationally distinct form of E (Éin Scheme 3), S: progesterone, P: 17α-OH progesterone, I: orteronel.
The two mechanisms can be tested with classic approaches. In the first approach (Table 2), varying concentrations of orteronel (I) were added to a reaction (P450 17A1 plus progesterone) after 90 s and product formation (17α-OH progesterone) was measured as a function of time (Figure 6). A slow, tight-binding mechanism will show curvature as the reaction proceeds (Figure 6A), but a direct inhibition model will show immediate inhibition (Figure 6B). However, the fit of the data did not allow discrimination between the two models in this case (Figure 6).
Table 2.
| (add equal volume) | |
|---|---|
| T1 period (90 s) | T2 period (300 s) |
| [E]: 0.08 μM | [I]: 0, 2, or 6 μM |
| [S]: 20 μM |
E: P450 17A1, S: progesterone, I: orteronel.
One of the problems encountered with using some classic approaches to analyzing the kinetics of orteronel inhibition is that we observed a slow loss of P450 17A1 activity following pre-incubation in the absence of substrate or inhibitor, which we had mentioned previously regarding binding titration analysis.5 Accordingly, the preincubation step was performed on ice. An experiment was designed in which a low concentration of orteronel (final concentration 0.5 μM) was incubated with P450 17A1 (0.2 μM) for varying periods of time before a large excess of the substrate progesterone (100 μM) (and NADPH) was added to initiate the 17α-hydroxylation reaction (Figure 7). Application of the model and rate constants in Tables 1 and 3 yields two predictions (Figure 11): (i) in the slow, tight-binding model an exponential loss of activity is seen, resulting in an asymptote with ~ 70% inhibition. (ii) In the direct inhibition mode, very little inhibition is seen, and the extent of inhibition is observed and does not change with time. As shown with both the (R)- and (S)-enantiomers, the direct inhibition model fits the data points best for both enantiomers, i.e. only very limited inhibition (Figure 11).
Table 3.
| (add equal volume) | |
|---|---|
| T1 period (variable time: 0–1200 s) | T2 period (300 s) |
| [E]: 0.4 μM | [S]: 200 μM |
| [I]: 0 or 1 μM |
E: P450 17A1, S: progesterone, I: orteronel.
Figure 11.
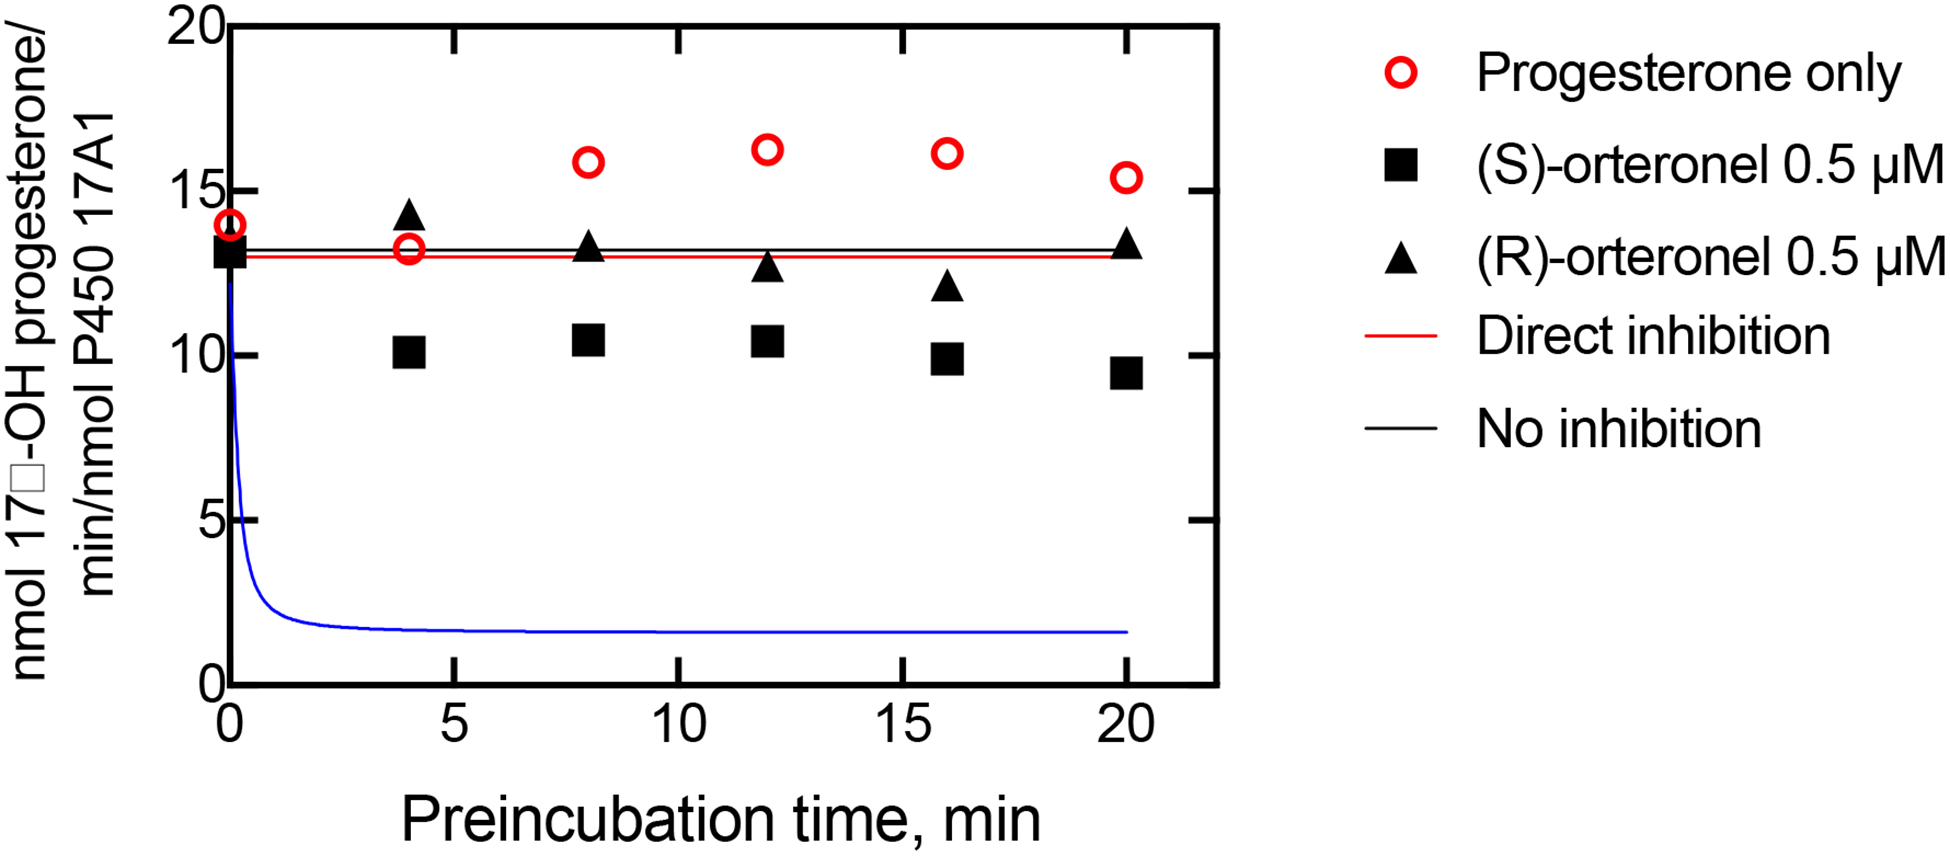
Inhibition data and fits to two alternate models (Tables 1, 3). The rate constant k2 (Table 1) was adjusted to fit the uninhibited data points (changed from Figure 10) resulting from the use of a different enzyme preparation. P450 17A1 (final concentration of 0.2 μM) and orteronel (0.5 μM) were preincubated for the times indicated on the x-axis. Reactions were then initiated by the addition of both 100 μM progesterone and an NADPH-generating system (begin T2 period, Table 3), proceeding for 300 s and followed by product analysis. The solid lines show the profiles calculated for a slow, tight-binding model (blue line) and a direct inhibition model (red line), in KinTek Explorer, using the parameters shown in Tables 1 and 2. The black line shows the expected uninhibited rates. The data points show the rates of progesterone 17α-hydroxylation measured in the presence and absence of orteronel.
Experiments done with (S)-seviteronel gave similar results (Figure 12). We conclude that its behavior is similar to that of orteronel, as seen in the case of the spectral assays (Figures 6–9).
Figure 12.
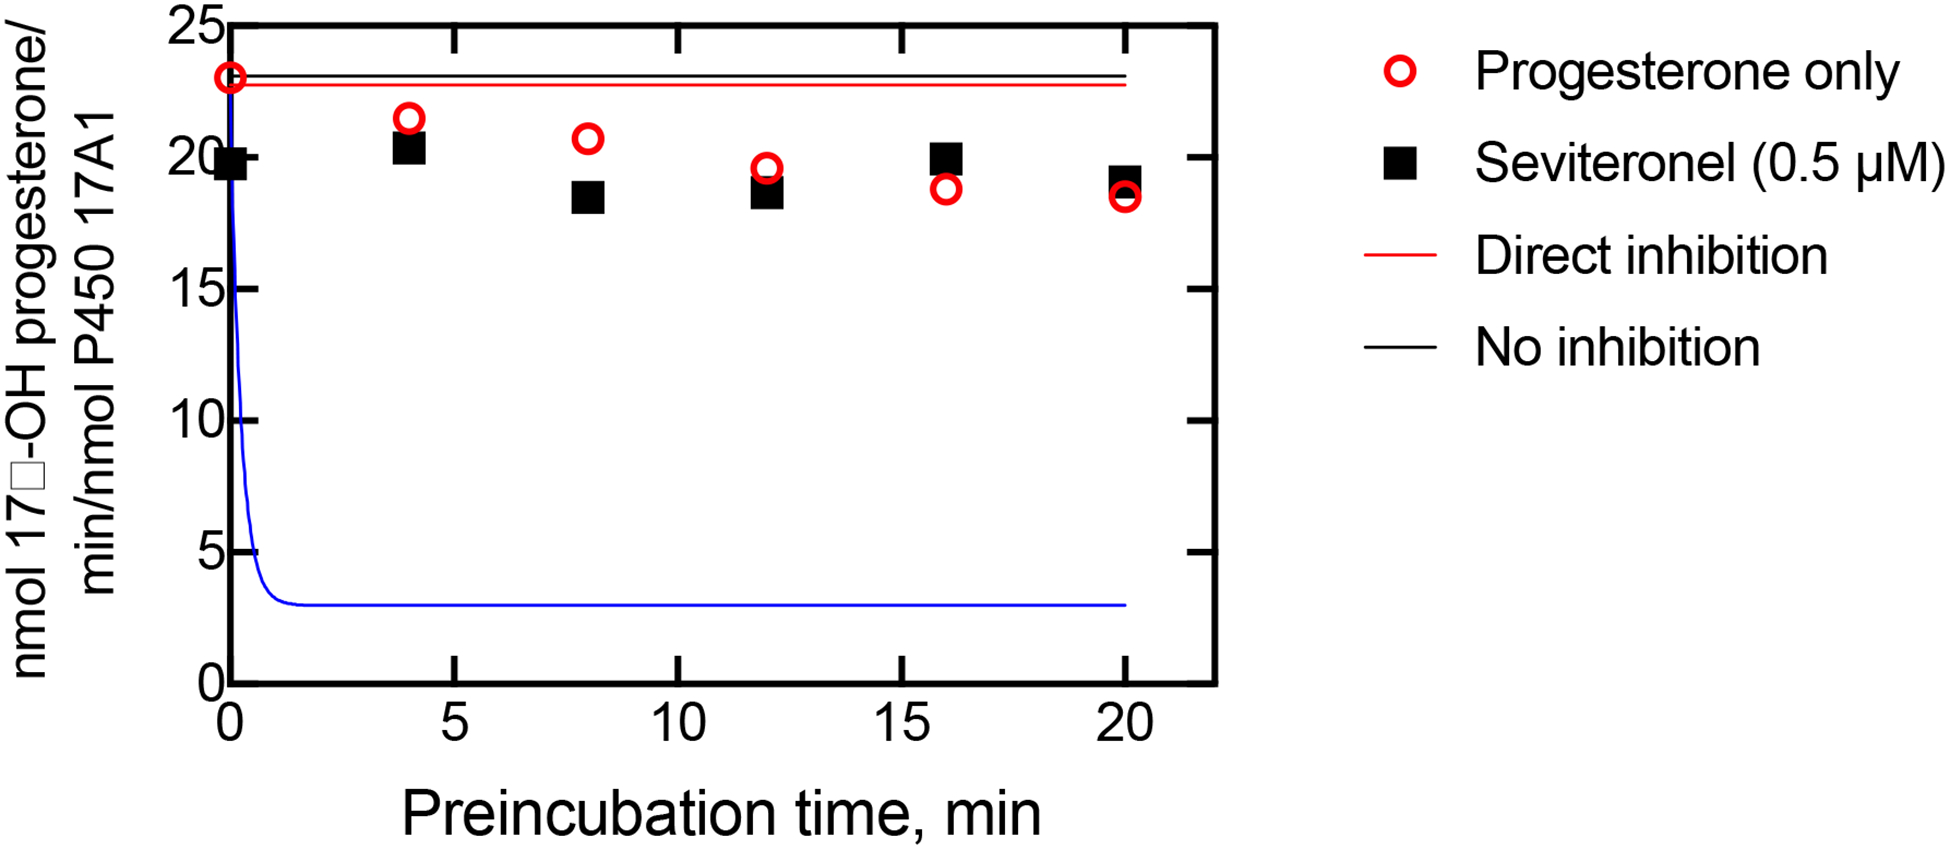
Inhibition data and fits to two alternate models (Tables 1, 3). The rate constant k2 (Table 1) was adjusted to fit the uninhibited data points (changed from Figure 10) resulting from the use of a different enzyme preparation. P450 17A1 (final concentration of 0.2 μM) and seviteronel (0.5 μM) were preincubated for the times indicated on the x-axis. Reactions were then initiated by the addition of both 100 μM progesterone and an NADPH-generating system (begin T2 period, Table 3), proceeding for 300 s and followed by product analysis. The solid lines show the profiles calculated for a slow, tight-binding model (blue line) and a direct inhibition model (red line), in KinTek Explorer, using the parameters shown in Tables 1 and 2. The black line shows the expected uninhibited rates. The data points show the rates of progesterone 17α-hydroxylation measured in the presence (■) and absence (○) of seviteronel.
DISCUSSION AND CONCLUSIONS
The binding of both enantiomers (R-, S-) of orteronel to the enzyme target P450 17A1 was analyzed and found to be slower than what would be expected for a diffusion-limited reaction19, 20 (Figure 1). Examination of the spectral changes with SVD analysis over time (Figure 2) suggested the existence of multiple species of orteronel-P450 17A1 complexes after mixing (Figure 3), and the phenomenon was established using direct analysis of the spectra (Figure 4A). The opposite directions of absorbance changes at different wavelengths (Figure 4B) validated this view, and the data could be fit to fast, diffusion-limited binding of orteronel followed by a slower conversion of the complex to an Fe-N complex. However, the kinetic modeling indicates that there is no need to invoke a slow, tight-binding mechanism for enzyme inhibition (Figure 11).
The point should be made that the initial spectral changes were not atypical for P450 reactions and could be used to calculate an on-rate constant of ~ 2 × 10⁷ M−1 s−1 (Figure 5D, Table 1), which might be regarded as a simple bimolecular reaction. Visual inspection of the spectral traces (Figure 2) indicated a lack of isosbestic points, even though the spectral changes were small, and SVD analysis was also more consistent with a three-species system than two (Figure 3). The SVD predictions could be confirmed when the individual spectra were isolated (Figure 5A) and the traces at different wavelengths examined in more detail (Figure 5B).
Narasimhulu25 had earlier postulated that rabbit P450 2B4 binds norbenzphetamine in this manner. That is, an initial high-spin complex was formed, which then changed to a Type II (low-spin) complex,25 similar to the mechanism we propose (Scheme 3).
Scheme 3.

Interactions of P450 17A1 (E) with orteronel or (S)-seviteronel (I).
A number of drugs exert their activities via slow, tight-binding inhibition.13, 21–24 To our knowledge, none have ever been reported for P450 enzymes, with the possible exception of cilengitide.26 However, there are many instances of mechanism-based inactivation of P450s,27 which differs only from the slow, tight-binding model of Table 1 in that k−5 is zero. The kinetic course of the inactivation is similar to slow, tight-binding but the inhibition is not reversed by substrate (as in an experiment such as that of Figure 7). Many amines are oxidized to form nitroso derivatives that interact very tightly with the heme iron and, although they can be reversed, are functionally irreversible for a long period.27–29 We have not re-investigated our work on the inhibition of P450 3A4 by the peptide cilengitide,26 which is complex but appears to contain a component of this mechanism. It is also possible that some of the polycyclic hydrocarbons, flavonoids, and other inhibitors that we have studied might fit into this group if examined in more detail using the newer modeling approaches.30–34
Orteronel was discontinued for development in the course of Phase III clinical trials. Although it had shown promise in discovery and development,4, 35–37 it apparently did not exceed the efficacy of abiraterone. Another P450 17A1 inhibitor understood to still be under development is (S)-seviteronel (VT-464),6 currently in clinical trials and the subject of part of this report. Galeterone (TOK-001, VN/124–1) was dropped in July 2016. These compounds contain, respectively, a benzimidazole and a 2H-triazole ring, while abiraterone contains a pyridine. The two enantiomers of seviteronel have been reported to bind less tightly to P450 17A1 than does orteronel.6 Spectral assays indicated very similar behavior (of the (S)-enantiomer) of seviteronel to orteronel (Figures 6–9).
Overall, the mechanism of binding of orteronel to P450 17A1 would seem to resemble an induced fit model more than conformational selection,38, 39 in that a discrete initial binding step can be identified before a final change (Figure 4, Scheme 3). However, our earlier evidence for conformational selection with P450 17A1 shows that multiple conformations of P450 17A1 exist in solution in the absence of ligand (Scheme 3). One (or more) of those can bind orteronel or seviteronel. The initial EI complex is tight and inhibitory, and then changes to a final ÉI complex, the low-spin Fe-N entity seen in the spectra (Figures 2–4) and the crystal structures.6 Thus, a combination of phenomena is involved in the interactions of P450 17A1 with the inhibitor orteronel and seviteronel. All of our evidence (i.e., Figures 1–5, 7–9) is consistent with similar events occurring with both the R- and S-enantiomers, although the final structures differ.6
Alternative mechanisms to the one presented in Scheme 3 were also considered, using SVD analysis in the OLIS GlobalWorks program. None of the 2-species options would fit the observed spectral data (Figures 2, 3A, 3D, 7A). Other 3-species models were considered, particularly one involving a conformational selection process (Scheme 4) in which there are two conformational states in slow equilibrium (step 1), and one of these binds orteronel to yield the low spin λ430 (Type II) complex (step 2). However, none of the models in the software provided satisfactory fits to the observed spectral traces (Figures 2, 4A, 8A). Further, 3-species modeling with a slow conformational step (step 1, ~ 1 s−1) followed by rapid reaction with orteronel did not predict the observed spectral changes, in contrast to Figures 3A, 3D, 7A). In Scheme 4, we know that all of the final complex is low spin (ÉI) from the spectrum, so the equilibration of ÉI and EI (step 4) is necessary. (It should also be pointed out that we have shown previously that the starting P450 17A1 enzyme (spectra shown in Figures 3, 5A, 8A) is > 95% low spin as judged by second-derivative spectroscopy.7) Attempts to begin with E and É present, in slow equilibrium (1 s−1), yield distinctly biphasic kinetic plots (ΔA430-A410), which were not seen in the experiments (Figure 3). Combining steps 2 and 4 in Scheme 4 yields the same mechanism we have already provided evidence for and is described in Scheme 3.
Scheme 4.
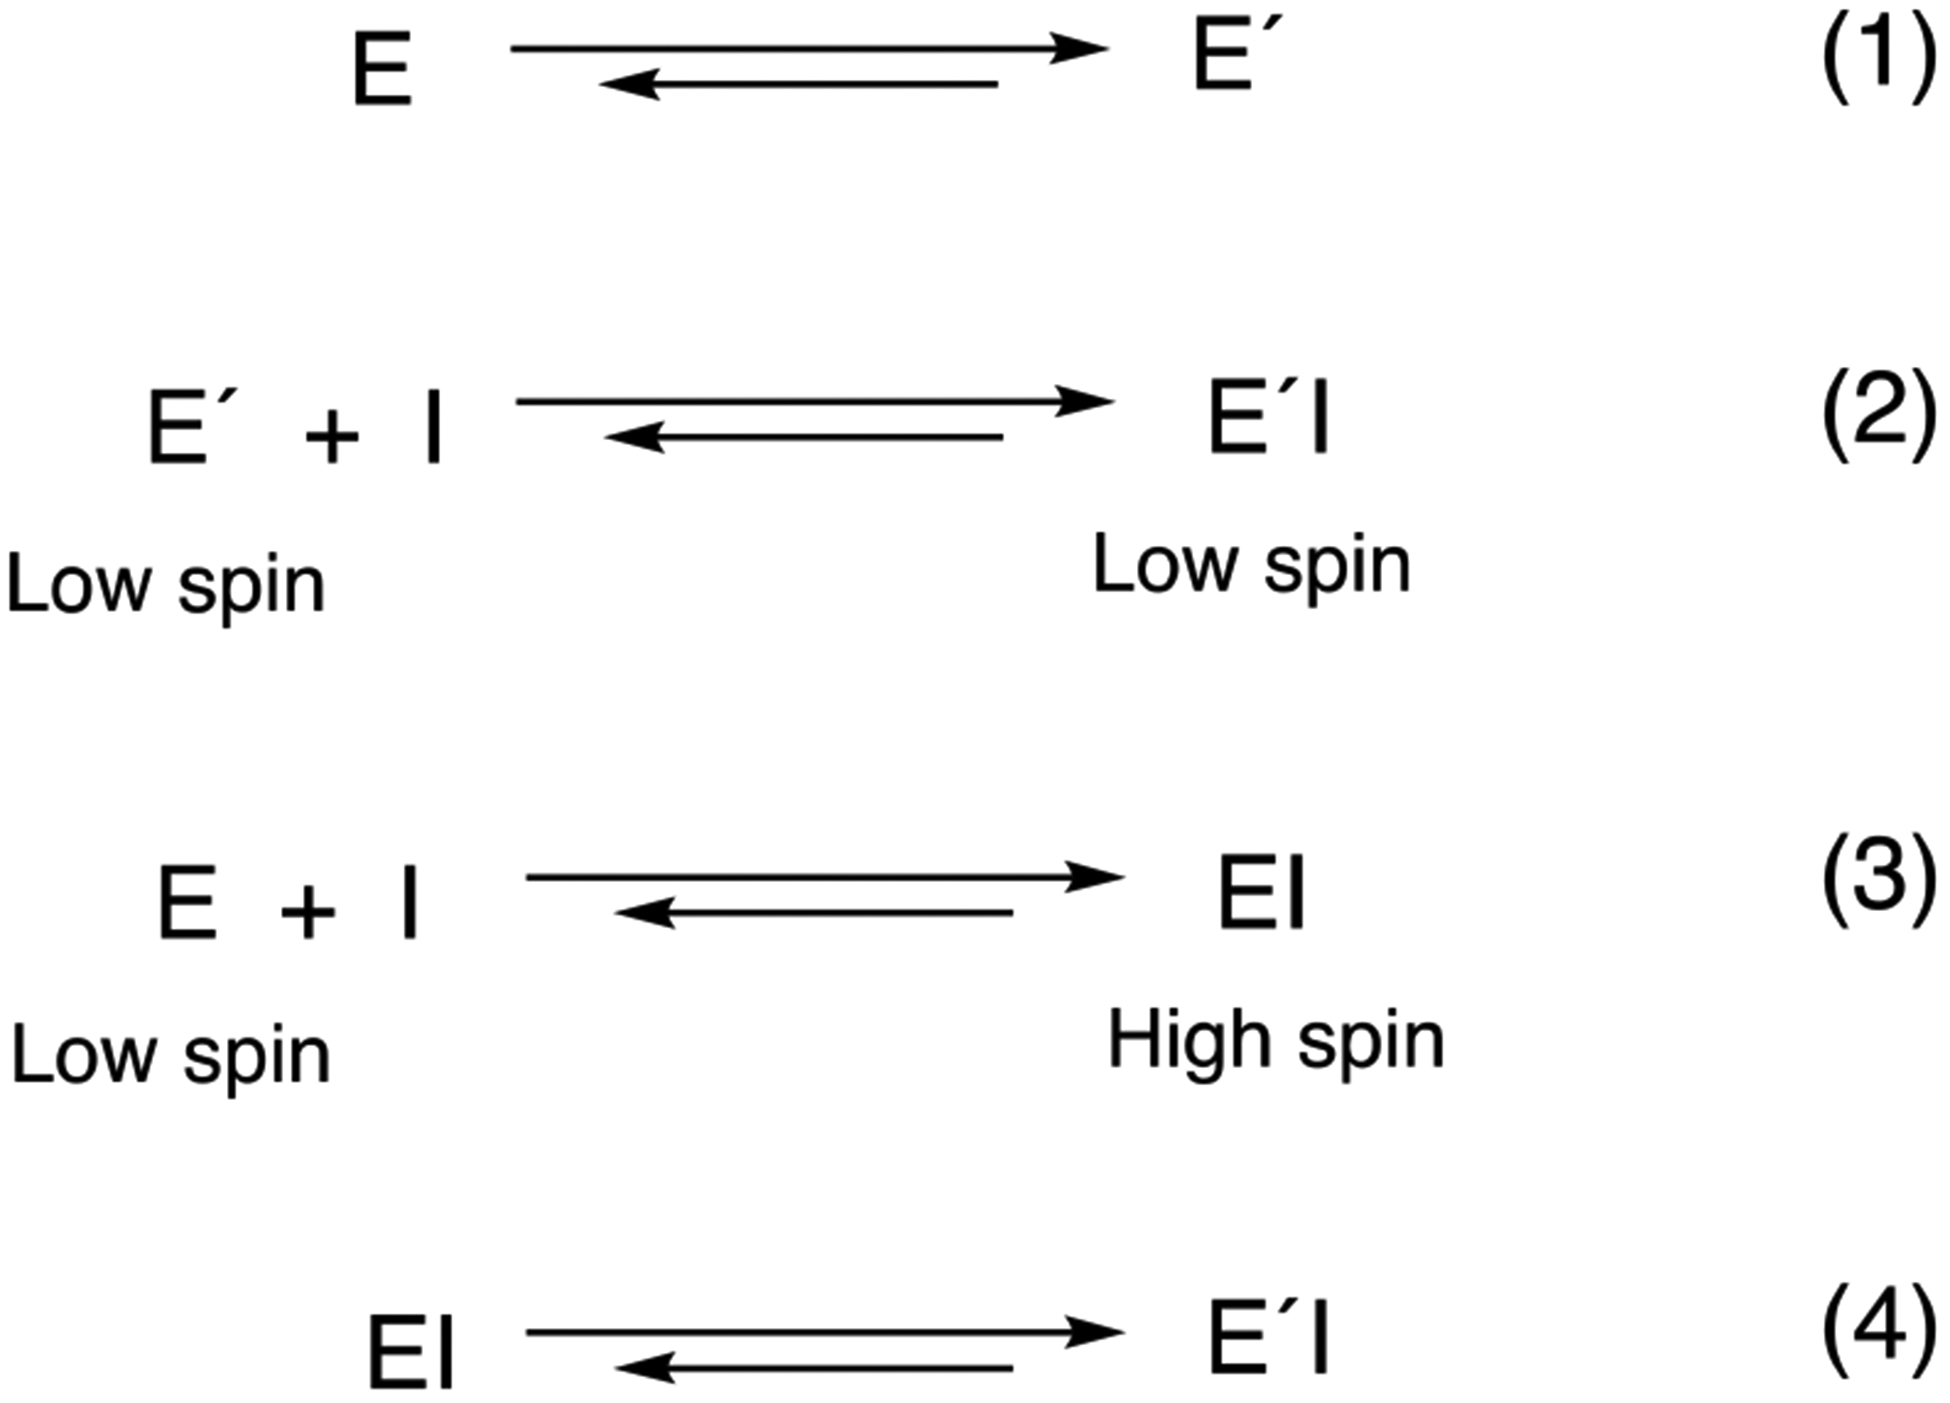
Alternate model with two conformational states in slow equilibrium.
As mentioned earlier, orteronel is not being considered for development any longer but seviteronel is. The conclusions about the behavior of (S)-seviteronel (Figures 6–9, 11) were the same as for orteronel.
All of the inhibition work presented here was done with the progesterone 17α-hydroxylation reaction, but the lyase reaction as also at least as important, in that a goal in development of inhibitors to use in treating prostate cancer is to selectively inhibit the lyase activity compared to 17α-hydroxylation. This is not a trivial goal, in light of the evidence for a single active site in the the enzyme. Previous modeling efforts were unsuccessful in the absence of invoking a different enzyme conformation at some point in the two reactions.7 Exactly what the nature of such a conformational change is remains unclear. It might be related to interaction with cytochrome b5. Further considerations of the details of inhibition of the lyase reaction need to involve pre-steady-state measurements of products (by quench flow kinetics), as indicated by modeling exercises.
In summary, our spectral and kinetic results reveal a multi-step interaction of both enantiomers of the drug candidates orteronel and (S)-seviteronel with the target, P450 17A1. The initial complex is tight and capable of explaining the observed inhibition without invoking slow, tight-binding inhibition. The initial complex goes on to yield a final Fe-N complex with a classic Type II low-spin character. However, we cannot rule out the existence of further changes in the bound Fe-N complex that would be invisible in the spectra.
EXPERIMENTAL SECTION
Chemicals.
Progesterone was purchased from SigmaAldrich. Racemic orteronel (TAK-700) was obtained from ApexBio (Houston, TX) (catalog no. A4236). The (R-) and (S)-enantiomers were separated using chiral HPLC and their purity (>95%) and spectral properties have been characterized previously.5 (S)-Seviteronel was purchased from Advanced ChemBlocks (Burlingame, CA) and its purity was evaluated by HPLC/UV and LC-MS (Supporting Fig. S2).
Enzymes.
Human P450 17A1, with a C-terminal (His)6 tag, was expressed in Escherichia coli and purified to near electrophoretic homogeneity as described elsewhere.40 Recombinant rat NADPH-P450 reductase41 and human cytochrome b542 were expressed in E. coli and purified as described.
Catalytic Assays.
Steady-state catalytic assays were done based on a modification of previous methods.5, 7, 40 For the direct inhibition assay, CYP17A1 (0.04 μM) was incubated with NADPH-P450 reductase (2 μM), cytochrome b5 (0.5 μM), progesterone (10 μM), and L-α−1,2-dilauroyl-sn-glycero-3-phosphocholine (16 μM) in 50 mM potassium phosphate buffer (pH 7.4) in a final volume of 0.5 mL. The samples were preincubated for 5 min at 37 °C and the reaction was initiated by the addition of an NADPH generating system (10 mM glucose 6-phosphate, 0.5 mM NADP+, and 2 μg/mL yeast glucose-6-phosphate dehydrogenase). Orteronel and sevriteronel were dissolved in CH3OH and added to incubations (1 or 3 μM) at 90 seconds, with the final CH3OH being ≤ 2% (v/v). The reactions were run for varying times and quenched by addition of 2 mL of ethyl acetate. For the preincubation assay, the reaction mixture was as follows: CYP17A1 (0.2 μM), NADPH-P450 reductase (2 μM), cytochrome b5 (0.5 μM), and L-α−1,2-dilauroyl-sn-glycero-3-phosphocholine (16 μM) in 50 mM potassium phosphate buffer (pH 7.4) in a final volume of 0.5 mL. Orteronel ((R)- or (S)-, 0.5 μM), seviteronel (0.5 μM), or the same volume of CH3OH was added to the samples at differing pre-incubation times, and the mixture was left on ice. The samples were then incubated at 37 °C and the NADPH-generating system (as above) was added 1 min before progesterone (100 μM) was used to initiate the reaction. The reaction time was 5 min, after which the reactions were quenched with 2 mL of ethyl acetate. Extraction and analysis of samples for both assays were performed as reported previously, utilizing HPLC and UV detection.40
Spectroscopy.
Steady-state spectra were recorded using either a Cary 14-OLIS or an Aminco DW2a-OLIS spectrophotometer (On-Line Instrument Systems (OLIS), Bogart, GA). Pre-steady-state measurements were made with an OLIS RSM-1000 instrument operating in the rapid-scanning mode (4000 spectra/second) using a 4 mm × 20 mm observation cell, 1.24 mm slits, a 16 × 0.2 mm ScanDisk, and 400 lines/mm, > 500 nm gratings at 23 °C in 100 mM potassium phosphate buffer (pH 7.4). At least four shots were done under each experimental condition (e.g., orteronel or (S)-seviteronel concentration) and the OLIS GlobalWorks software was used to extract ΔA430-A410, ΔA430-A410, or ΔA390-A418 data, which were averaged and fitted to single exponentials (e.g., Figure 5) or to other equations (e.g., Figure 1B). In some cases (e.g., Figures 3, 7), SVD analysis was done in the OLIS GlobalWorks program.
Kinetic Analysis and Simulation.
KinTek Explorer (v. 8.0) was used (KinTek, Snow Shoe, PA) with an Apple iMac OXC version 10.13.6 system. Data files were imported as Excel files (saved and transferred as .txt files), and the input parameters are cited in Tables 1–3. In some cases (e.g., Figure 11), the Explorer output was imported into Prism software (GraphPad, San Diego, CA).
Supplementary Material
Figure 10.
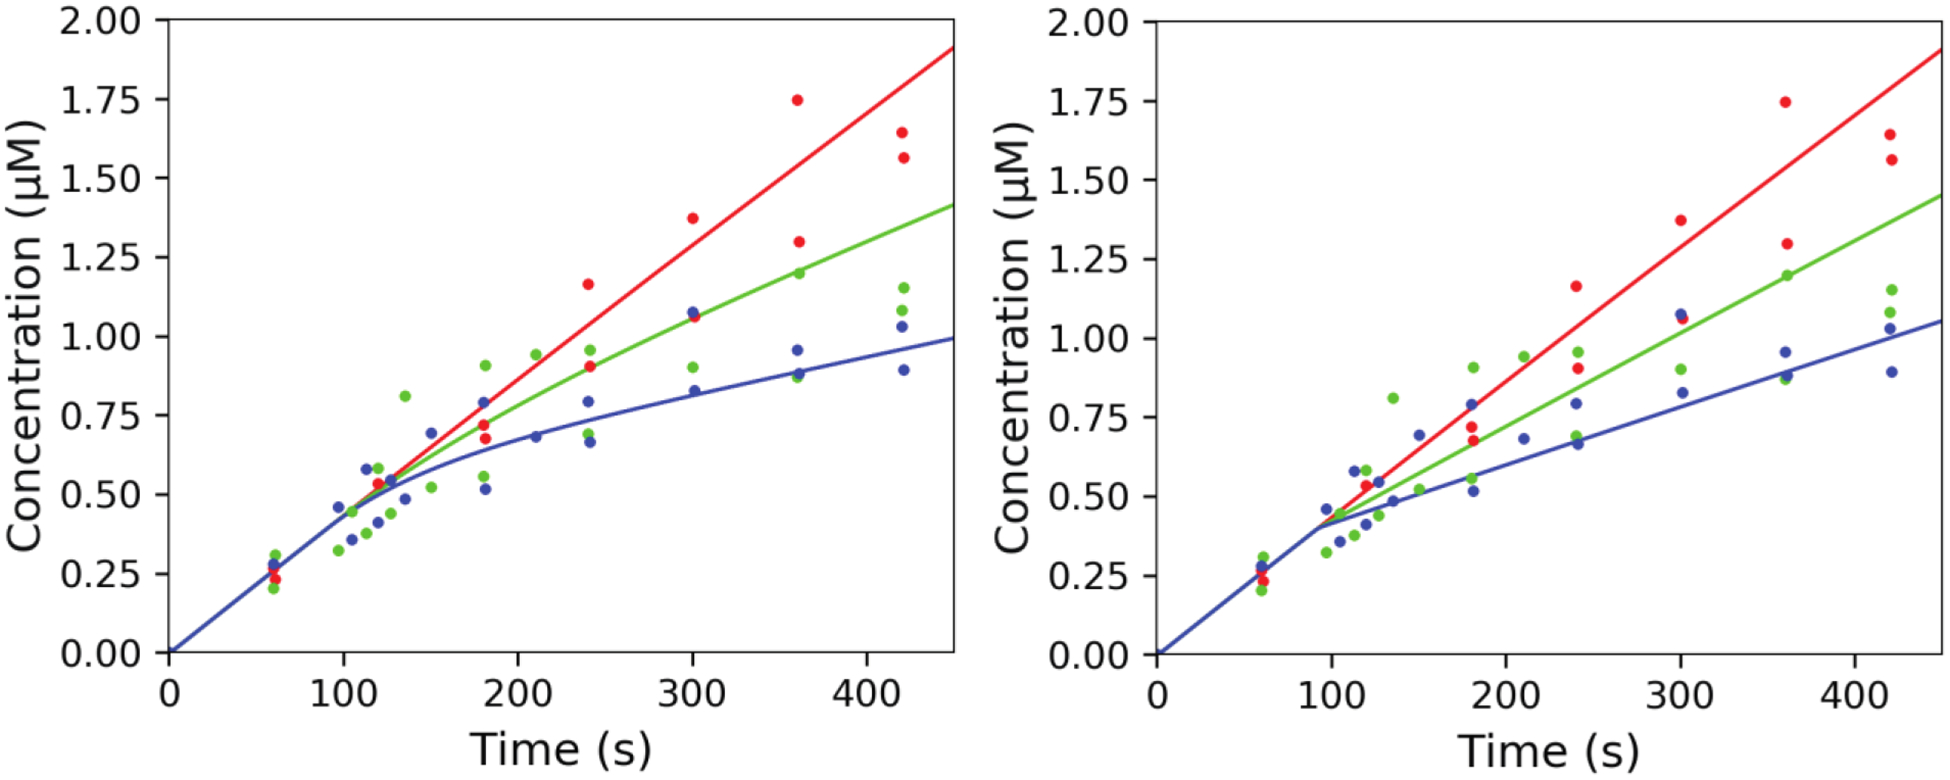
Orteronel inhibition data and fits to two alternate models (Tables 1, 2). The assay was initiated with the concentrations described in Table 1 (T1 period), and the formation of 17α-OH progesterone was measured at the indicated time points. After 90 s (beginning of T2 period, Table 2), (R)-orteronel was added to final concentrations of either 0 μM (red), 1 μM (green), or 3 μM (blue) and the reactions continued. The same data points were used in both parts. The lines shown were calculated in KinTek Explorer for using the parameters shown in Tables 1 and 2. (A) Slow, tight-binding model (Table 1A). (B) Direct inhibition model (Table 1B). Note curvature in Part A.
ACKNOWLEDGMENTS
We thank C. J. Wilkey for preparing P450 17A1 and E. Gonzalez for separating the enantiomers of orteronel. Thanks are also extended to K. Trisler for assistance in preparation of the manuscript.
Funding Sources
This work was supported by National Institutes of Health Grant R01 GM118122 (F. P. G.). The content is solely the responsibility of the authors and does not necessarily represent the official views of the National Institutes of Health.
ABBREVIATIONS
- P450 (or CYP)
cytochrome P450
- OH
hydroxy
- SVD
singular value decomposition
Footnotes
Supporting Information available: Analytical data for (R)- and (S)-orteronel, analytical data for (S)-seviteronel. Molecular Formula Strings available for (R)- and (S)-orteronel, (S)-seviteronel, and progesterone.
The authors declare no competing financial interests.
REFERENCES
- 1.Auchus RJ; Miller WL P450 Enzymes in Steroid Processing In Cytochrome P450: Structure, Mechanism, and Biochemistry, 4th ed.; Ortiz de Montellano PR, Ed. Springer: New York, 2015; Vol. 2, pp 851–879. [Google Scholar]
- 2.de Bono JS; Logothetis CJ; Molina A; Fizazi K; North S; Chu L; Chi KN; Jones RJ; Goodman OB Jr.; Saad F; Staffurth JN; Mainwaring P; Harland S; Flaig TW; Hutson TE; Cheng T; Patterson H; Hainsworth JD; Ryan CJ; Sternberg CN; Ellard SL; Flechon A; Saleh M; Scholz M; Efstathiou E; Zivi A; Bianchini D; Loriot Y; Chieffo N; Kheoh T; Haqq CM; Scher HI Abiraterone and Increased Survival in Metastatic Prostate Cancer. New Engl. J. Med 2011, 364, 1995–2005. [DOI] [PMC free article] [PubMed] [Google Scholar]
- 3.Scott LJ Abiraterone Acetate: A Review in Metastatic Castration-Resistant Prostrate Cancer. Drugs 2017, 77, 1565–1576. [DOI] [PubMed] [Google Scholar]
- 4.Kaku T; Hitaka T; Ojida A; Matsunaga N; Adachi M; Tanaka T; Hara T; Yamaoka M; Kusaka M; Okuda T; Asahi S; Furuya S; Tasaka A Discovery of Orteronel (TAK-700), a Naphthylmethylimidazole Derivative, as a Highly Selective 17,20-Lyase Inhibitor with Potential Utility in the Treatment of Prostate Cancer. Bioorg. Med. Chem 2011, 19, 6383–6399. [DOI] [PubMed] [Google Scholar]
- 5.Gonzalez E; Guengerich FP Kinetic Processivity of the Two-Step Oxidations of Progesterone and Pregnenolone to Androgens by Human Cytochrome P450 17A1. J. Biol. Chem 2017, 292, 13168–13185. [DOI] [PMC free article] [PubMed] [Google Scholar]
- 6.Petrunak EM; Rogers SA; Aube J; Scott EE Structural and Functional Evaluation of Clinically Relevant Inhibitors of Steroidogenic Cytochrome P450 17A1. Drug Metab. Dispos 2017, 45, 635–645. [DOI] [PMC free article] [PubMed] [Google Scholar]
- 7.Guengerich FP; Wilkey CJ; Glass SM; Reddish MJ Conformational Selection Dominates Binding of Steroids to Human Cytochrome P450 17A1. J. Biol. Chem 2019, 294, 10028–10041. [DOI] [PMC free article] [PubMed] [Google Scholar]
- 8.DeVore NM; Scott EE Structures of Cytochrome P450 17A1 with Prostate Cancer Drugs Abiraterone and TOK-001. Nature 2012, 482, 116–119. [DOI] [PMC free article] [PubMed] [Google Scholar]
- 9.Pallan PS; Nagy LD; Lei L; Gonzalez E; Kramlinger VM; Azumaya CM; Wawrzak Z; Waterman MR; Guengerich FP; Egli M Structural and Kinetic Basis of Steroid 17α,20-Lyase Activity in Teleost Fish Cytochrome P450 17A1 and its Absence in Cytochrome P450 17A2. J. Biol. Chem 2015, 290, 3248–3268. [DOI] [PMC free article] [PubMed] [Google Scholar]
- 10.Gonzalez E; Johnson KM; Pallan PS; Phan TTN; Zhang W; Lei L; Wawrzak Z; Yoshimoto FK; Egli M; Guengerich FP Inherent Steroid 17α,20-Lyase Activity in Defunct Cytochrome P450 17A Enzymes. J. Biol. Chem 2018, 293, 541–556. [DOI] [PMC free article] [PubMed] [Google Scholar]
- 11.Pinto-Bazurco Mendieta MA; Hu Q; Engel M; Hartmann RW Highly Potent and Selective Nonsteroidal Dual Inhibitors of CYP17/CYP11B2 for the Treatment of Prostate Cancer to Reduce Risks of Cardiovascular Diseases. J. Med. Chem 2013, 56, 6101–6107. [DOI] [PubMed] [Google Scholar]
- 12.Hille UE; Hu Q; Vock C; Negri M; Bartels M; Muller-Vieira U; Lauterbach T; Hartmann RW Novel CYP17 Inhibitors: Synthesis, Biological Evaluation, Structure-Activity Relationships and Modelling of Methoxy- and Hydroxy-Substituted Methyleneimidazolyl Biphenyls. Eur. J. Med. Chem 2009, 44, 2765–2675. [DOI] [PubMed] [Google Scholar]
- 13.Cha S Tight-binding Inhibitors—I: Kinetic Behavior. Biochem. Pharmacol 1975, 24, 2177–2185. [DOI] [PubMed] [Google Scholar]
- 14.Szedlacsek SE; Duggleby RG Kinetics of Slow and Tight-Binding Inhibitors. Methods Enzymol. 1995, 249, 144–180. [DOI] [PubMed] [Google Scholar]
- 15.Blobaum AL; Xu S; Rowlinson SW; Duggan KC; Banerjee S; Kudalkar SN; Birmingham WR; Ghebreselasie K; Marnett LJ Action at a Distance: Mutations of Peripheral Residues Transform Rapid Reversible Inhibitors to Slow, Tight Binders of Cyclooxygenase-2. J. Biol. Chem 2015, 290, 12793–12803. [DOI] [PMC free article] [PubMed] [Google Scholar]
- 16.Gooljarsingh LT; Fernandes C; Yan K; Zhang H; Grooms M; Johanson K; Sinnamon RH; Kirkpatrick RB; Kerrigan J; Lewis T; Arnone M; King AJ; Lai Z; Copeland RA; Tummino PJ A Biochemical Rationale for the Anticancer Effects of Hsp90 Inhibitors: Slow, Tight Binding Inhibition by Geldanamycin and Its Analogues. Proc. Natl. Acad. Sci. U. S A 2006, 103, 7625–7630. [DOI] [PMC free article] [PubMed] [Google Scholar]
- 17.Murthy NSRK; Bakeris T; Kavarana MJ; Hamilton DS; Lan Y; Creighton DJ S-(N-Aryl-N-hydroxycarbamoyl)glutathione Derivatives Are Tight-Binding Inhibitors of Glyoxalase I and Slow Substrates for Glyoxalase II. J. Med. Chem 1994, 37, 2161–2166. [DOI] [PubMed] [Google Scholar]
- 18.Daniels F; Alberty RA Physical Chemistry, 3rd ed.; Wiley: New York, 1966; pp 330–331. [Google Scholar]
- 19.Fersht A Structure and Mechanism in Protein Science. Freeman: New York, 1999; p 110. [Google Scholar]
- 20.Schreiber G; Haran G; Zhou HX Fundamental Aspects of Protein-Protein Association Kinetics. Chem. Rev 2009, 109, 839–860. [DOI] [PMC free article] [PubMed] [Google Scholar]
- 21.Srinivasan B; Skolnick J Insights into the Slow-Onset Tight-Binding Inhibition of Escherichia coli Dihydrofolate Reductase: Detailed Mechanistic Characterization of Pyrrolo[3,2-f]quinazoline-1,3-diamine and Its Derivatives as Novel Tight-Binding Inhibitors. FEBS J. 2015, 282, 1922–1938. [DOI] [PMC free article] [PubMed] [Google Scholar]
- 22.Luckner SR; Liu N; am Ende CW; Tonge PJ; Kisker C A Slow, Tight Binding Inhibitor of Inha, the Enoyl-Acyl Carrier Protein Reductase from Mycobacteri. J. Biol. Chem 2010, 285, 14330–14337. [DOI] [PMC free article] [PubMed] [Google Scholar]
- 23.Kitir B; Maolanon AR; Ohm RG; Colaco AR; Fristrup P; Madsen AS; Olsen CA Chemical Editing of Macrocyclic Natural Products and Kinetic Profiling Reveal Slow, Tight-Binding Histone Deacetylase Inhibitors with Picomolar Affinities. Biochemistry 2017, 56, 5134–5146. [DOI] [PubMed] [Google Scholar]
- 24.Khan YS; Gutierrez-de-Teran H; Aqvist J Probing the Time Dependency of Cyclooxygenase-1 Inhibitors by Computer Simulations. Biochemistry 2017, 56, 1911–1920. [DOI] [PubMed] [Google Scholar]
- 25.Narasimhulu S Differential Behavior of the Sub-Sites of Cytochrome 450 Active Site in Binding of Substrates, and Products (Implications for Coupling/Uncoupling). Biochim. Biophys. Acta 2007, 1770, 360–375. [DOI] [PubMed] [Google Scholar]
- 26.Bojić M; Barbero L; Dolgos H; Freisleben A; Gallemann D; Riva S; Guengerich FP Time- and NADPH-dependent Inhibition of Cytochrome P450 3A4 by the Cyclopentapeptide Cilengitide: Significance of the Guanidine Group and Accompanying Spectral Changes. Drug Metab. Dispos 2014, 42, 1438–1446. [DOI] [PubMed] [Google Scholar]
- 27.Correia MA; Hollenberg PF Inhibition of Cytochrome P450 Enzymes In Cytochrome P450: Structure, Mechanism, and Biochemistry, 4th ed.; Ortiz de Montellano PR, Ed. Springer: New York, 2015; pp 177–259. [Google Scholar]
- 28.Mansuy D; Beaune P; Cresteil T; Bacot C; Chottard JC; Gans P Formation of Complexes between Microsomal Cytochrome P-450-Fe(II) and Nitrosoarenes Obtained by Oxidation of Arylhydroxylamines or Reduction of Nitroarenes in situ. Eur. J. Biochem 1978, 86, 573–579. [DOI] [PubMed] [Google Scholar]
- 29.Paulsen-Sörman UB; Jönsson KH; Lindeke BGA Cytochrome P-455 nm Complex Formation in the Metabolism of Phenylalkylamines. 8. Stereoselectivity in Metabolic Intermediary Complex Formation with a Series of Chiral 2-Substituted 1-Phenyl-2-aminoethanes. J. Med. Chem 1984, 27, 342–346. [DOI] [PubMed] [Google Scholar]
- 30.Shimada T; Tanaka K; Takenaka S; Murayama N; Martin MV; Foroozesh MK; Yamazaki H; Guengerich FP; Komori M Structure-function Relationships of Inhibition of Human Cytochromes P450 1A1, 1A2, 1B1, 2C9, and 3A4 by 33 Flavonoid Derivatives. Chem. Res. Toxicol 2010, 23, 1921–1935. [DOI] [PMC free article] [PubMed] [Google Scholar]
- 31.Shimada T; Tanaka K; Takenaka S; Foroozesh MK; Murayama N; Yamazaki H; Guengerich FP; Komori M Reverse Type I Binding Spectra of Human Cytochrome P450 1B1 Induced by Flavonoid, Stilbene, Pyrene, Naphthalene, Phenanthrene, and Biphenyl Derivatives that Inhibit Catalytic Activity: A Structure-Function Relationship Study. Chem. Res. Toxicol 2009, 22, 1325–1333. [DOI] [PMC free article] [PubMed] [Google Scholar]
- 32.Shimada T; Murajama N; Tanaka K; Takenaka S; Imai Y; Hopkins NE; Foroozesh MK; Alworth WL; Yamazaki H; Guengerich FP; Komori M Interaction of Polycyclic Aromatic Hydrocarbons with Human Cytochrome P450 1B1 in Inhibiting Catalytic Activity. Chem. Res. Toxicol 2008, 21, 2313–2323. [DOI] [PMC free article] [PubMed] [Google Scholar]
- 33.Shimada T; Murayama N; Okada K; Funae Y; Yamazaki H; Guengerich FP Different Mechanisms for Inhibition of Human Cytochromes P450 1A1, 1A2, and 1B1 by Polycyclic Aromatic Inhibitors. Chem. Res. Toxicol 2007, 20, 489–496. [DOI] [PubMed] [Google Scholar]
- 34.Shimada T; Guengerich FP Inhibition of Human Cytochrome P450 1A1-, 1A2-, and 1B1-Mediated Activation of Procarcinogens to Genotoxic Metabolites by Polycyclic Aromatic Hydrocarbons. Chem. Res. Toxicol 2006, 19, 288–294. [DOI] [PubMed] [Google Scholar]
- 35.Yamaoka M; Hara T; Hitaka T; Kaku T; Takeuchi T; Takahashi J; Asahi S; Miki H; Tasaka A; Kusaka M Orteronel (TAK-700), a Novel Non-Steroidal 17,20-Lyase Inhibitor: Effects on Steroid Synthesis in Human and Monkey Adrenal Cells and Serum Steroid Levels in Cynomolgus Monkeys. J. Steroid Biochem. Mol. Biol 2012, 129, 115–128. [DOI] [PubMed] [Google Scholar]
- 36.Hara T; Kouno J; Kaku T; Takeuchi T; Kusaka M; Tasaka A; Yamaoka M Effect of a Novel 17,20-Lyase Inhibitor, Orteronel (TAK-700), on Androgen Synthesis in Male Rats. J. Steroid Biochem. Mol. Biol 2013, 134, 80–91. [DOI] [PubMed] [Google Scholar]
- 37.Yamaoka M; Hara T; Araki H; Kaku T; Hitaka T; Tasaka A; Kusaka M Effect of an Investigational CYP17A1 Inhibitor, Orteronel (TAK-700), on Estrogen- and Corticoid-Synthesis Pathways in Hypophysectomized Female Rats and on the Serum Estradiol Levels in Female Cynomolgus Monkeys. J. Steroid Biochem. Mol. Biol 2013, 138, 298–306. [DOI] [PubMed] [Google Scholar]
- 38.Vogt AD; Di Cera E Conformational Selection or Induced Fit? A Critical Appraisal of the Kinetic Mechanism. Biochemistry 2012, 51, 5894–5902. [DOI] [PMC free article] [PubMed] [Google Scholar]
- 39.Gianni S; Dogan J; Jemth P Distinguishing Induced Fit from Conformational Selection. Biophys. Chem 2014, 189, 33–39. [DOI] [PubMed] [Google Scholar]
- 40.Yoshimoto FK; Gonzalez E; Auchus RJ; Guengerich FP Mechanism of 17α,20-Lyase and New Hydroxylation Reactions of Human Cytochrome P450 17A1: 18O Labeling and Oxygen Surrogate Evidence for a Role of a Perferryl Oxygen. J. Biol. Chem 2016, 291, 17143–17164. [DOI] [PMC free article] [PubMed] [Google Scholar]
- 41.Hanna IH; Teiber JF; Kokones KL; Hollenberg PF Role of the Alanine at Position 363 of Cytochrome P450 2B2 in Influencing the NADPH- and Hydroperoxide-supported Activities. Arch. Biochem. Biophys 1998, 350, 324–332. [DOI] [PubMed] [Google Scholar]
- 42.Guengerich FP Reduction of Cytochrome b5 by NADPH-cytochrome P450 Reductase. Arch. Biochem. Biophys 2005, 440, 204–211. [DOI] [PubMed] [Google Scholar]
Associated Data
This section collects any data citations, data availability statements, or supplementary materials included in this article.


