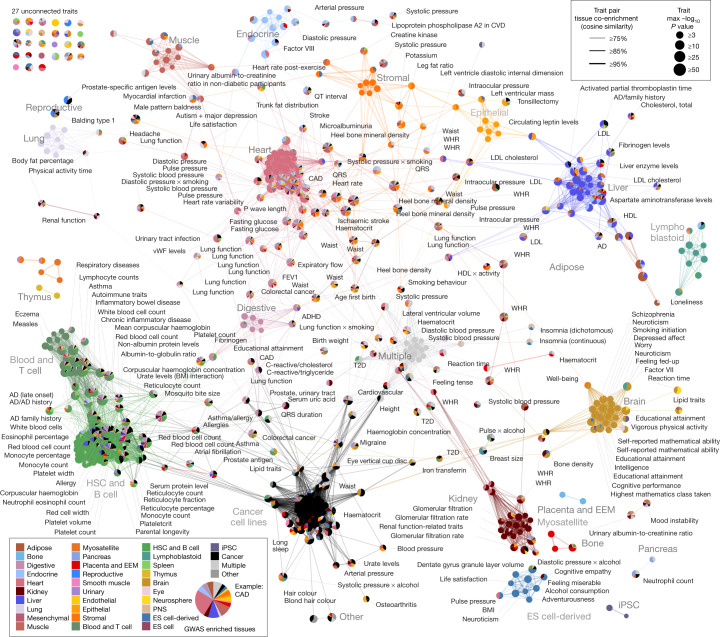
Fig. 3. Trait–trait network.
The network across 538 traits (by per-node false discovery rate correction) by similarity of epigenetic enrichments (cosine similarity ≥ 0.75), laid out using the Fruchterman–Reingold algorithm. Traits (nodes) are coloured by the contributing groups (pie chart by the fraction of −log10P, and size by maximal −log10P) and interactions (edges) by the group with the maximal dot product of enrichments between two traits. The redundant node names indicate different GWAS (the full names for non-singleton nodes are available in Supplementary Fig. 22). AD, Alzheimer disease; ADHD, attention-deficit/hyperactivity disorder; BMI, body mass index; CVD, cardiovascular disease; FEV1, forced expiratory volume in 1 s; T2D, type 2 diabetes; vWF, von Willebrand factor; WHR, waist-to-hip ratio.

