

Abstract
Objective:
To evaluate the role of immune cells and their effector cytokines from matched synovial fluid (SF) and synovium (SV) in the pathogenesis and progression of osteoarthritis (OA).
Methods:
SV and matched SF cells acquired from individuals undergoing total knee replacement for OA (n=39) were characterized for immune cell-associated surface markers and intracellular cytokine expression using polychromatic flow cytometry. Additional individuals with radiographic knee OA (Kellgren Lawrence grades ≥1) had available etarfolatide imaging (inflammatory cell imaging, n=26) or baseline and 3-year knee radiographic OA progression (n=85) data. SF cytokine concentrations of all cohorts were evaluated for associations with SV and SF cell phenotypes and radiographic OA severity.
Results:
Macrophages (SV predominant, 53% of total cells) and neutrophils (SF predominant, 26% of total cells) were the major immune cell populations in OA joints, expressing and associated with SF transforming growth factor beta-1 (TGF-β1) and elastase, respectively. TGF-β1 and elastase were significantly associated with radiographic knee OA severity. Baseline SF concentrations with radiographic scores predicted knee OA progression with areas under the Receiver Operating Characteristic curves of 0.810 (TGF-β1), 0.806 (elastase), and 0.846 (combination), with greater stability of prediction when both were utilized.
Conclusions:
Our findings demonstrate the hitherto under-appreciated role of neutrophils in the sterile inflammatory process and progression of OA. The soluble mediators, SF elastase and TGF-β1, are strong predictors of OA progression reflecting a synergistic role of neutrophil and macrophage populations in the pathogenesis and worsening of OA that could potentially be utilized to identify patients with risk for more rapid disease progression.
Introduction
Osteoarthritis (OA) is considered a whole joint organ disease with an important inflammatory component involving immune cells, such as macrophages, and their effector cytokines1–3. Magnetic resonance imaging (MRI) and ultrasound confirm a high prevalence of joint inflammation in OA4, 5. Moreover, the presence of MRI-detected inflammation has recently been shown to predict incident radiographic OA (rOA) a year later6. Low-grade inflammations induced by the metabolic syndrome, innate immunity, and inflammaging have all been suggested to play a role in the initiation and perpetuation of the OA process1. Taken together, these studies highlight the critical role of inflammation in the pathogenesis of OA.
Our pilot study using etarfolatide imaging to visualize activated but not resting cells demonstrated the presence of immune cells with functional folate receptor (FR), traditionally considered activated macrophages, in the majority (76%) of OA knees studied7. The presence and number (based on the intensity of etarfolatide uptake) of FR positive immune cells was strongly correlated with knee joint symptoms (ascertained as the severity of knee pain, aching, and stiffness). Strikingly, other sites commonly affected by OA (shoulder, hands, ankles) also showed a high frequency of FR positive immune cells whose abundance was positively associated with patient-reported joint symptoms7. We subsequently determined that FR bearing cells included both activated macrophages, as described in the literature8 but also a subset of neutrophils9. Further, we found that the synovial fluid concentrations of two macrophage generated soluble proteins, CD14 and CD163, were associated with radiographic knee OA progression10. CD14 can be found on various cell types, including monocytes and macrophages11. Cell surface CD14, used as part of the basis for macrophage identification in this study, is clearly linked to activation of innate immune responses, including the production of the inflammatory mediators TNF-α, IL-1, IL-6, IL-8, IL-10, and IL-1212–15.
Previous studies have also suggested that macrophages and macrophage-produced mediators help drive the inflammatory and destructive responses in the OA synovium16, 17. These results suggest that macrophages are involved in the pathogenesis of OA. However, the role of other major immune cells in the pathogenesis of OA has not been fully evaluated. Although prior evaluation of the role of neutrophils has generally been confined to rheumatoid arthritis18, a few studies have provided some indications of their involvement in OA. For example, matrix metalloproteinase 9 and neutrophil gelatinase-associated lipocalin form a complex in OA synovial fluid that is relevant to cartilage degradation19. In experimental arthritis in mice, neutrophils and NK cells interact to promote arthritis following intra-articular collagenase injection20. Colchicine, that inhibits neutrophil production of superoxide, and neutrophil adhesion, mobilization, recruitment, and chemotaxis21, has to date yielded both positive22–25 and negative26 results in clinical trials evaluating OA symptoms or progression.
To advance the understanding of the role of immune cells in the pathogenesis of OA, we characterized the major immune cells in synovial tissue and synovial fluid and their effector cytokines in a total of 150 individuals with knee OA. Available etarfolatide and radiographic imaging data were used to assess for associations of joint inflammation and progression with immune cell populations in OA. Our findings in this study provide justification to utilize the immune cell effectors, TGF-β1 and elastase, to identify patients with a higher risk of OA progression.
Methods
Study Cohorts
Available patient information is summarized in Supplemental Table 1.
Total Knee Replacement Cohort:
These biospecimens were collected from patients with knee OA undergoing total knee replacement at Duke University Hospital with IRB approval. Synovium (SV) and matched synovial fluid (SF) were collected as anonymized waste surgical specimens from 39 patients. Cells were isolated from SV and SF for polychromatic flow cytometric analysis. Samples from 17 patients were used for immune cell profiling and soluble cytokine quantification; samples from 8 patients were used for intracellular cytokine profiling and additional samples from 14 patients were used for FR specificity testing.
The Etarfolatide Scan Cohort (NCT01237405):
Patients with unilateral or bilateral radiographic knee OA of Kellgren-Lawrence (KL) grade27 1–4 underwent aspiration of knee SF; directly aspirated SF, utilized for analyses of this study, was available from 26 knees of 18 patients.
The Prediction of Osteoarthritis Progression (POP) Cohort:
Patients with radiographic knee OA of KL 1–3 of at least one knee as previously described28, underwent aspiration of SF at baseline; directly aspirated SF, utilized for analyses of this study, and 3-year follow-up clinical data were available for 85 knees of 60 patients with rOA from the POP cohort.
Radiographic scoring and definition of OA progression
Participants in the POP and Etarfolatide cohorts underwent knee radiography; each knee radiograph was scored for KL grade, and radiographic features of joint space narrowing (JSN) and osteophyte (OST) severity using the Osteoarthritis Research Society International (OARSI) standardized atlas29. Based on change over 3 years in radiographic features (JSN and OST scores) and total knee replacement (TKR) occurrence after the baseline evaluation, participants from the POP cohort were categorized into four mutually exclusive, successively more severe, OA progression outcome categories as follows: non-progression (NP); OST progression (OST+/JSN−); OST and JSN progression (OST+/JSN+); and progression to TKR.
Cell isolation from synovial tissue
All biospecimens were collected under Duke Institutional Review Board approval. SV and SF, taken at the time of joint replacement surgery for OA, were processed within 2 hours of acquisition. After removing adjoining tissue, SV cells were isolated using an enzyme-free method with high cell viability, around 95%, and less than 5% fibroblasts (see Supplemental Methods and Supplemental Figure 2) that we previously showed preserved FR presence and function on macrophages9. Cells from matched SF were isolated by centrifugation; the cell-free SF supernatants were stored at −80 °C until analysis.
Polychromatic flow cytometry analysis
SV and SF cells were stained for the following surface markers: HLA-DR, CD14, CD19, CD16, CD3, CD11c, and CD11b (see Supplemental Methods). To quantify cell type specific production of cytokines, cells isolated from SV and SF were cultured with Brefeldin A (BFA) for 2 h, then phenotyped with human surface marker antibodies: CD11b, CD11c, CD14, CD16 and CD3, and stained with antibodies against human TGF-β1 (Transforming growth factor beta-1, eBiocience) and elastase (Novus) according to the manufacturers’ protocols.
Synovial fluid cytokine measurements
Cytokines in SF, including IFN-γ, IL-1β, IL-2, IL-4, IL-6, IL-8, IL-10, IL-12p70, IL-13, TNF-α (Human Proinflammatory Panel 1), IL-17A, IL-21, IL-22, IL-23, IL-27, IL-31, and MIP-3α (Human TH17 panel 1) were measured by immunoassays (MSD, Rockville, USA) according to the manufacturer’s instructions30. Neutrophil elastase, TGF-β1, and monocyte chemoattractant protein-1 (MCP-1) were measured using Platinum Enzyme-linked Immunosorbent Assays (Thermo Fisher, Waltham, USA). All these SF effectors were measured in the TKR cohort; only TGF-β1 and elastase were measured in the Etarfolatide and POP cohorts. In addition, archival data for SF IL-6 and IL-8, measured using a Bioplex Human Cytokine 17-plex assay (Bio-Rad, Hercules, CA), were available for the POP cohort.
Statistical analyses
Pearson correlations were used to assess associations of immune cell types and cytokines. Ordinal logistic regression was used to estimate the association between SF cytokines and OA progression based on the above-defined outcome groups. Receiver operating characteristic (ROC) curve analysis was employed to evaluate the performance of SF TGF-β1 and elastase, as well as archival SF IL-6 and IL-8 data, with demographic covariates (age, gender, BMI) or radiographic covariates (total JSN and OST score) to discriminate between knee OA patients at high or low risk of any knee OA progression31, 32. The analyses were performed using JMP® Pro 13 (SAS, Cary, NC).
Results
Patient cohorts
A total of three OA cohorts were used for this research: a total knee replacement cohort (n=39); a radiographic knee OA cohort (KL grades ≥1) with available etarfolatide (inflammatory cell) imaging (n=26); and a natural longitudinal radiographic knee OA progression cohort (n=85) with baseline and 3-year knee rOA progression data (see Supplemental Table 1). These cohorts were majority female, older (mean age >60 years), and obese (mean BMI >30 kg/m2). Of note, in the OA progression cohort, a total of 36 and 49 individuals met criteria for any progression (>1 unit increase in JSN or OST or knee replacement) and non-progression, respectively.
Three major immune cell populations in OA joints
Using flow cytometric analyses, we determined that macrophages (CD14+/ CD11c+/HLADR+/CD11b+ /CD16low), neutrophils (CD14−/CD11c−/HLADR−/CD11b+/CD16high), and T cells (CD45+/CD3+) were the three major immune cell populations in OA SV and SF (Figure 1A, Supplemental Figure 1&2, n=17 patients). Macrophages were the most abundant population in both the SF and SV. Overall, neutrophils were less abundant than macrophages and T cells. Although all three cell types were present in all joints, only 35% of joints had neutrophils representing more than 5% of total cells. Neutrophils were more abundant in SF than SV (a mean 26% vs. 8% of total cells). In contrast, macrophages were more abundant in SV than SF (a mean 53% vs. 38% of total cells). The number of T cells was not significantly different in SF and SV (a mean 36% vs. 35% of total cells) (Figures 1A&B). A subset of immune cells (macrophages, neutrophils, and T cells) was identified as FR+ in both SF and SV (9% and 8% of the total live cells, respectively) based on their high uptake of folic acid (Figure 1A&B). We confirmed the functional specificity of the FR on macrophages and neutrophils by a significant reduction of fluorescent folic acid uptake with the addition of non-labeled folic acid (Supplemental Figure 3); in contrast, the small amount of folic acid uptake by the small number of FR+ T cells was not specific.
Figure 1.
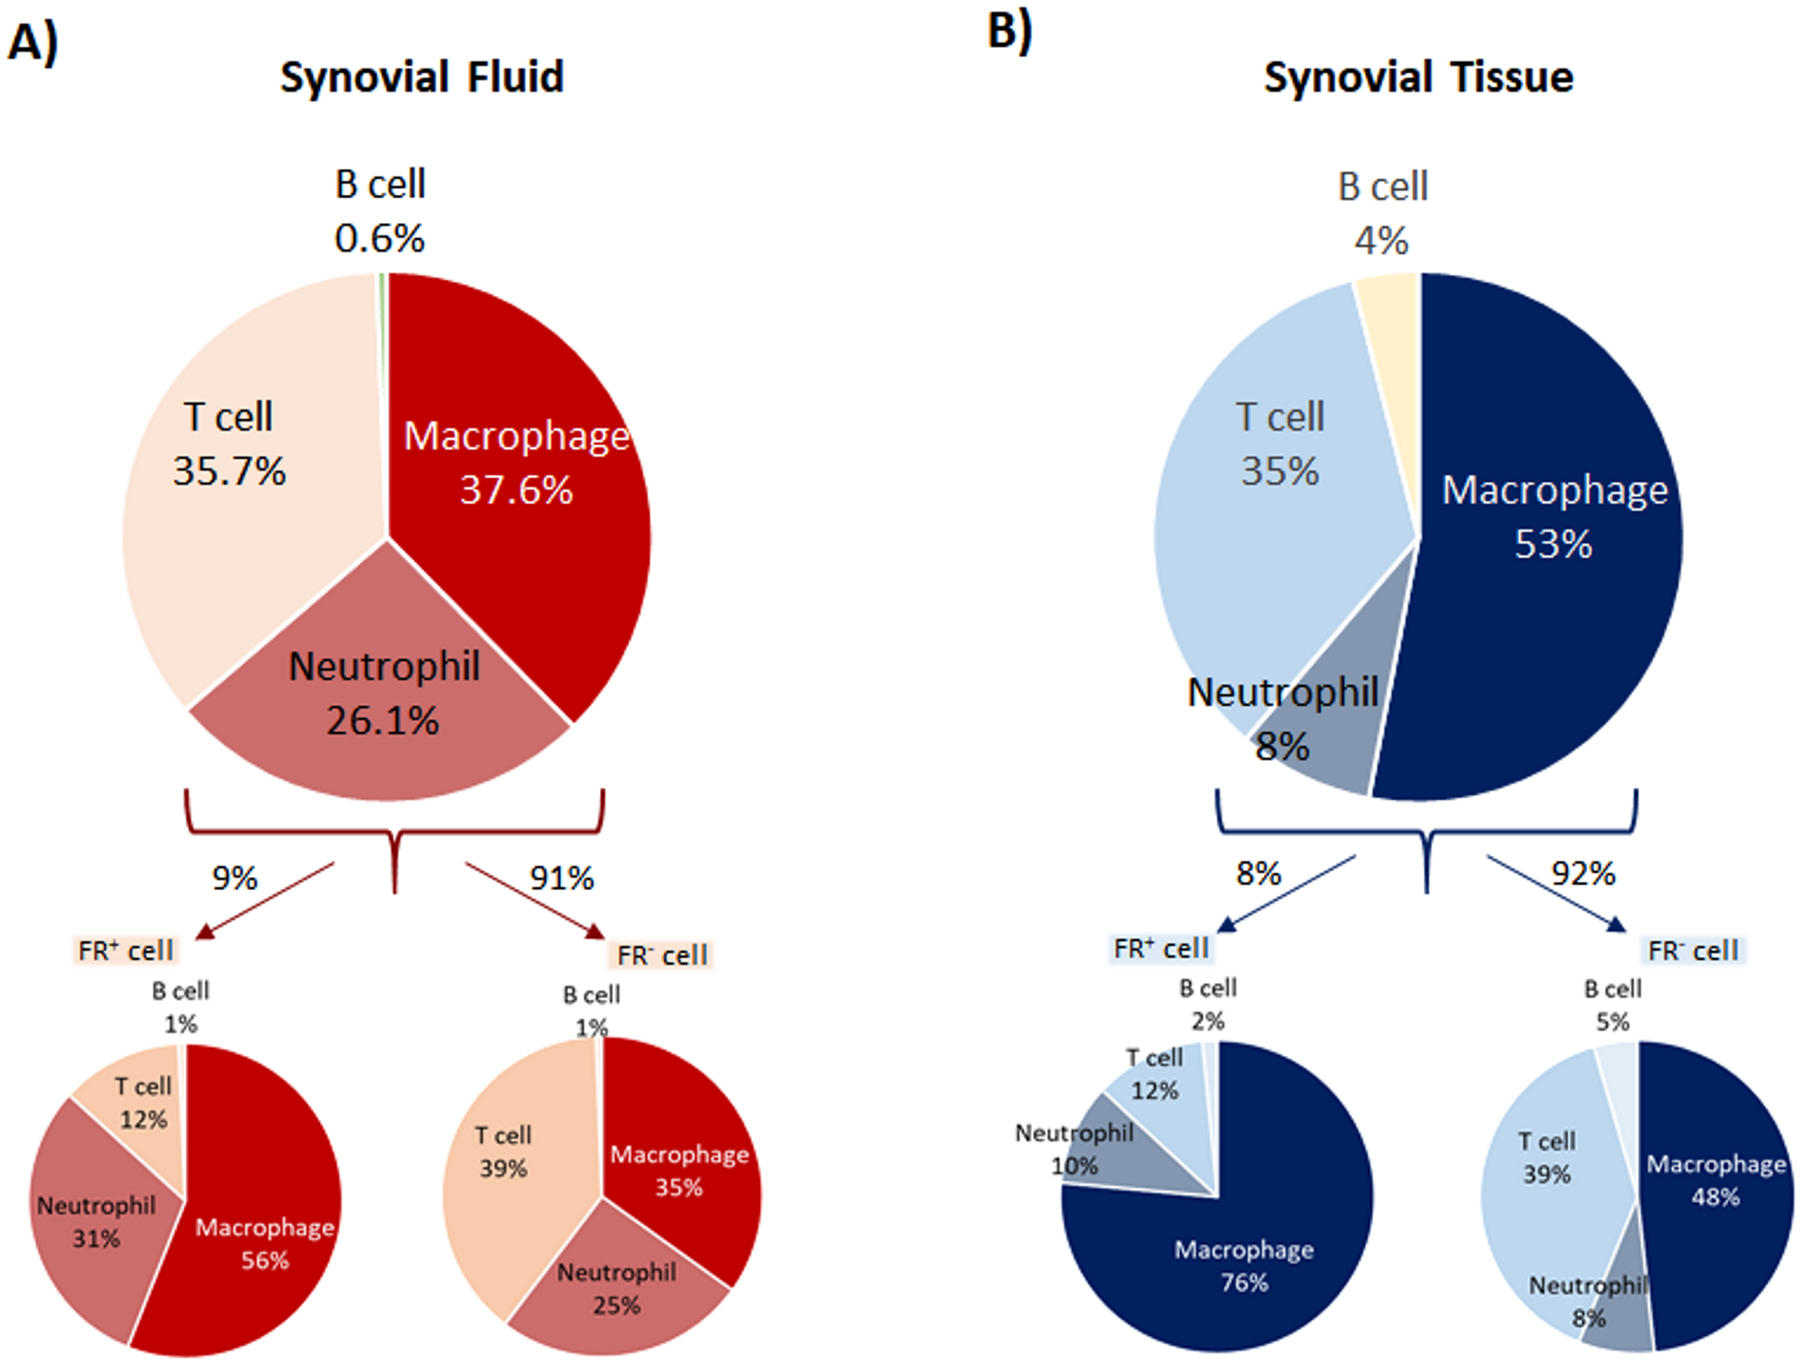
Phenotypic characterization of immune cells determined by flow cytometric analyses. A&B) Macrophages (CD14+/CD11c+/HLADR+/CD11b+ /CD16low), neutrophils (CD14−/CD11c−/HLADR−/CD11b+/CD16high), and T cells (CD45+/CD3+) are major immune cell populations in SF and SV (n=17 each group). A higher mean percentage of neutrophils was present in SF compared to SV. In contrast, a higher mean percentage of macrophages was present in SV compared to SF. Overall, a mean 8–9% of the SV and SF cells were FR+. By flow cytometric analysis, macrophages and neutrophils constituted the major FR+ immune cell populations in both SV and SF. The FR+ cell subtype was enriched for macrophages and neutrophils but had fewer T cells compared to the FR− majority cell population
Representative SF effectors linked to macrophages and neutrophils in OA
In the TKR cohort (n=17), we identified profiles of soluble SF cytokines that were associated with neutrophil, macrophage, and T cell populations in knee OA joints (Figure 2). Soluble neutrophil secreted elastase (r=0.728, p=0.001) and neutrophil-attracting MIP-3α (r=0.235, p=0.364) were selectively positively associated with SF neutrophils. SF elastase was inversely associated with T cells in SF (r=−0.397, p=0.115) and SV (r=−0.241, p=0.369). SF neutrophils were also positive but not significantly associated with SF IL-6 (r=0.451, p=0.069). By flow cytometry, we confirmed the expression of elastase in both SF and SV neutrophils (Supplemental Figure 4). In the TKR cohort, the total number of SF macrophages was positively associated with SF concentrations of IL-6 (r=0.503, p=0.04). The total number of SV macrophages was positively but not significantly associated with SF concentrations of any single soluble cytokine: IL-6 (r=0.127, p=0.639), TGF-β1 (r=0.253, p=0.344), TNF-α (r=0.304, p=0.291) and IL-27 (r=0.288, p=0.279) (Figure 2). In contrast to the positive but weak associations of SV macrophages with TGF-β1/IL-27/TNF-α, the associations of SF macrophages with these cytokines were negative (TGF-β1 (r=−0.320, p=0.21), TNF-α (r=−0.399, p=0.216) and IL-27 (r=−0.124, p=0.637)). By flow cytometry, macrophages expressed but were not a sole source of TGF β1 (Supplemental Figure 4). Although macrophages were also a source of IL-6, only a minority of SF and SV macrophages expressed this cytokine (Supplemental Figure 4).
Figure 2.
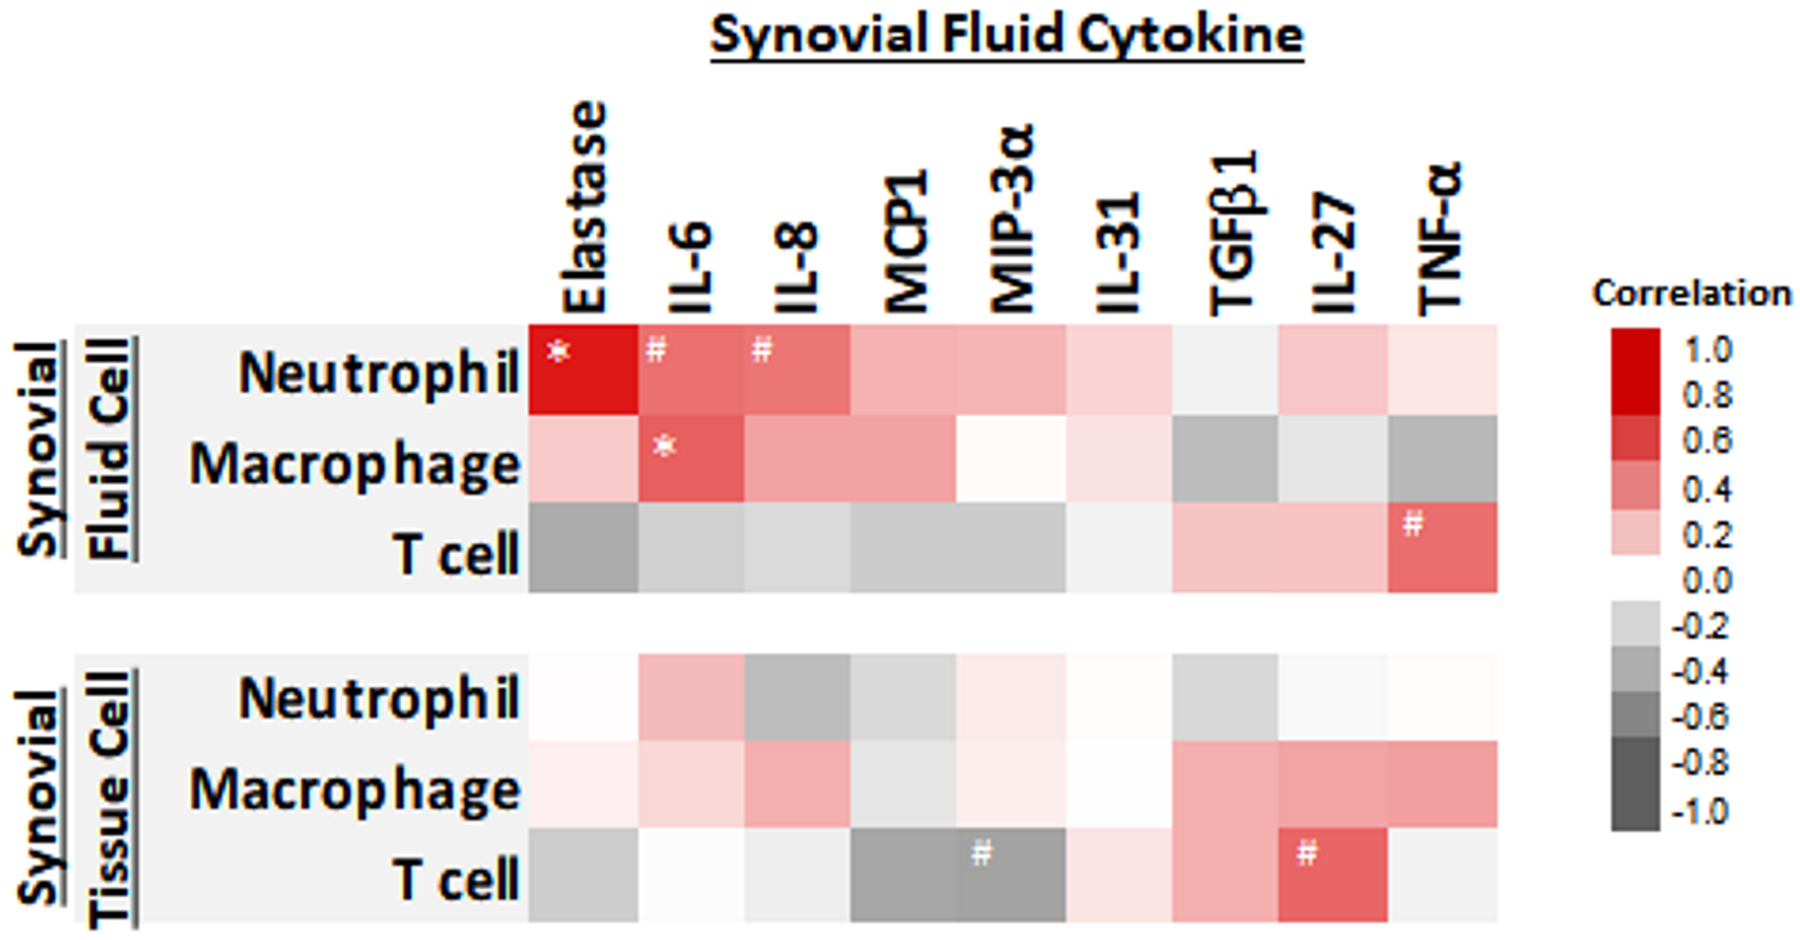
Heat map representing the associations of synovial fluid (SF) and synovial tissue (SV) immune cells and SF cytokines. Elastase, IL-6, IL-8, MCP1 and MIP-3α were positively associated with the total number of SF neutrophils. TGF-β1, TNF-α, and IL-27 were positively associated with the total number of SV macrophages, and the number of T cells in both SF and SV. #= p-value less than 0.1. *= p-value less than 0.05. N=17 patients.
TGF-β1 and elastase identified as immune cell phenotypic markers for macrophages and neutrophils
To assess the role of various immune cell types in the pathogenesis and progression of OA, we aimed to identify biomarkers characteristic for each cell type. Based on flow cytometric analyses (n=8 patients), elastase and TGF-β1 were representative of the neutrophil and macrophage populations of the joint, respectively. Macrophages were the predominant source of TGF-β1 in SF (72%) and SV (79%); the amount of TGF-β1 produced per cell (based on the median fluorescence intensity, MFI) was significantly higher in macrophages from SV compared to SF (Figure 3A). In SV, the proportion of TGF-β1+ macrophages was significantly higher than the proportion of TGF-β1+ neutrophils; the amount of TGF-β1 per cell was also significantly higher in macrophages compared to neutrophils (Figure 3B). By flow cytometry, neutrophils, particularly SF neutrophils, appeared to be the predominant source of elastase (expressed by an average of 72% SF neutrophils). Elastase+ neutrophils were more abundant in SF than SV but the amount per cell was similar in both microenvironments (Figure 3C). Although an average of 12% (SF) to 23% (SV) of macrophages expressed elastase (Supplemental Figure 4), the MFI of elastase+ SF macrophages was significantly lower than the MFI in SF neutrophils (Figure 3D). The number of TGF-β1+ T cells was much lower than TGF-β1+ macrophages and no or very few elastase+ expressing T cells were detected (Figure 3E). The amount of TGF-β1 produced by T cells (based on the MFI) was also lower than that produced by macrophages.
Figure 3.
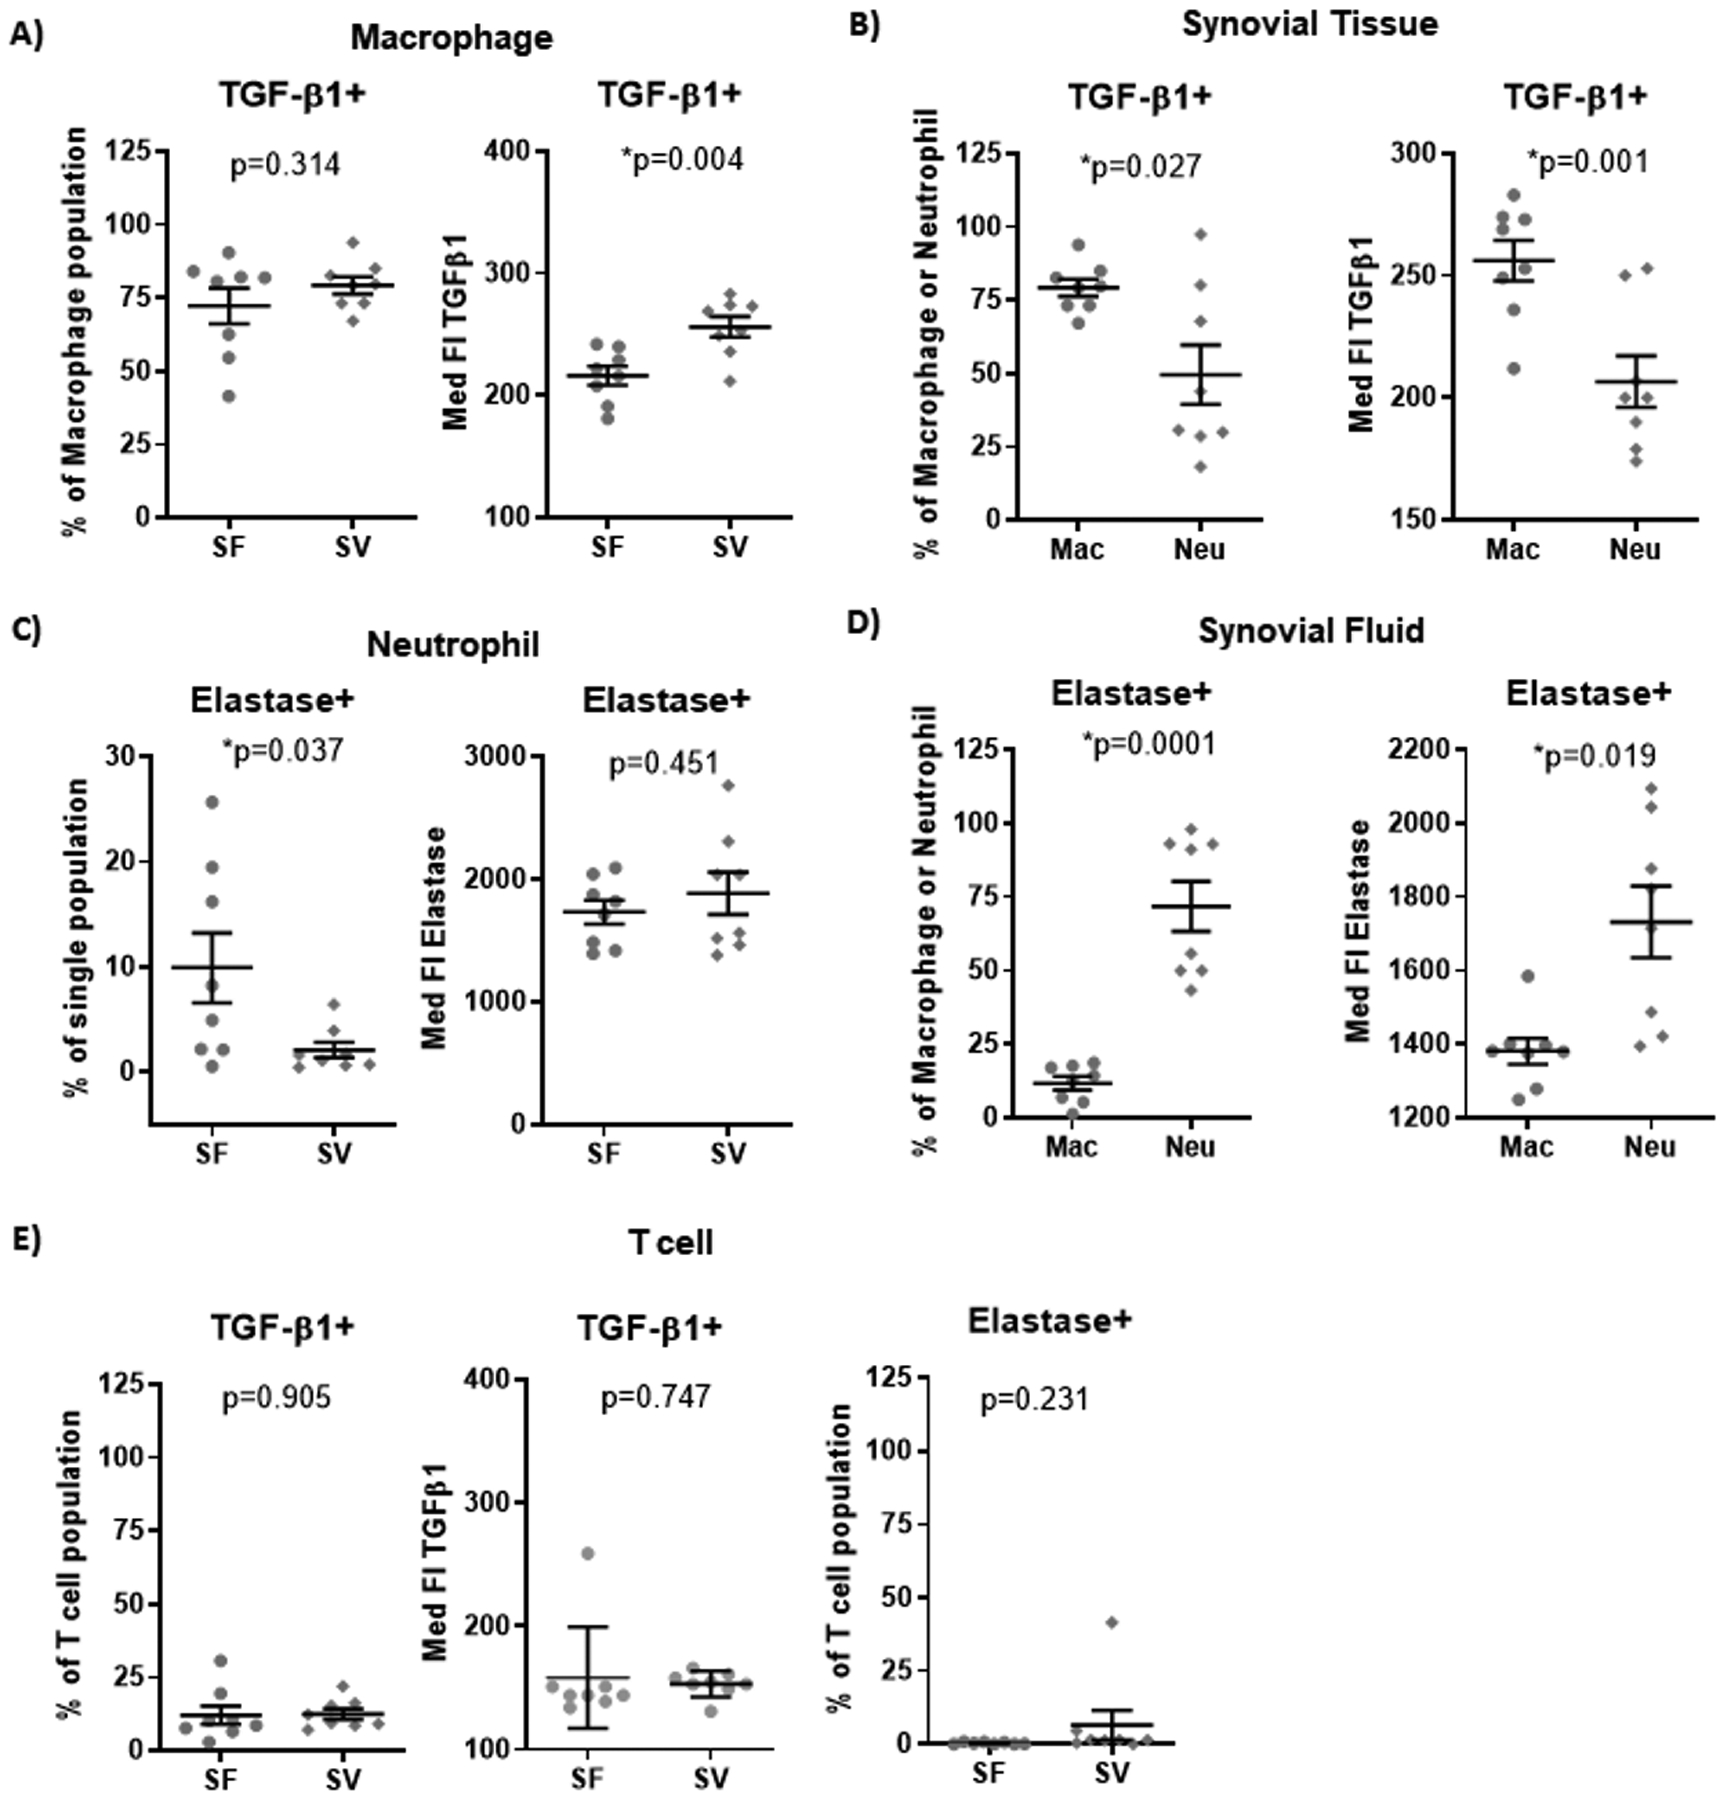
Intracellular cytokine production by macrophages and neutrophils in SF and SV based on flow cytometric analyses. Although the percentage of total macrophages (CD3−/CD14+/CD16low)(A) producing TGF-β1 was similar in SF and SV, the amount of TGF-β1 produced on average per cell (based on MFI) was significantly greater for macrophages in SV compared to SF. (B) In SV, the percentage of TGF-β1 producing macrophages was significantly higher than the percentage of TGF-β1 producing neutrophils; the amount of TGF-β1 produced on average per cell was also significantly higher in macrophages compared to neutrophils. In contrast, elastase was produced by a greater number of total neutrophils (CD3−/CD14−/CD16high) (C) in SF compared to SV although the amount of elastase produced on average per cell (based on MFI) was similar for neutrophils in SF compared to SV. (D) In SF, elastase+ neutrophils were significantly more abundant compared to the basal level of elastase+ macrophages; the amount of elastase produced on average per cell was also significantly higher in neutrophils compared to macrophages. (E) The number of TGF-β1+ T cells was much lower than TGF-β1+ macrophages and no or very few elastase+ T cells were detected. The amount of TGF-β1 produced per T cell was lower than the amount produced by macrophages in SF and SV. Med FI: Median Fluorescent Intensity. Mac: macrophages. Neu: neutrophils. N=8 patients per group.
SF TGF-β1 and elastase were positively associated with radiographic knee OA severity.
To determine the role of these two immune cell types in the pathogenesis and progression of OA, we measured TGF-β1 and elastase in SF biospecimens from highly phenotyped cohorts (Etarfolatide and POP) with a wide range of knee OA severity. After adjustment for age, gender, and BMI, SF TGF-β1 and elastase were both significantly associated with baseline knee rOA OST severity in both the Etarfolatide cohort (β=10.31, p=0.006 for TGF-β1 and β=2.54, p=0.041 for elastase) and POP cohort (β=2.29, p=0.012 for TGF-β1 and β=2.74, p=0.001 for elastase). Additionally, SF TGF-β1 and elastase were both significantly associated with baseline knee rOA JSN severity in the POP cohort (β=0.66, p=0.068 for TGF-β1 and β=0.95, p=0.005 for elastase).
SF TGF-β1 and elastase singly and in combination strongly predicted knee OA progression
Baseline SF elastase was also significantly and positively associated with OST progression (β=1.04, p=0.048) in the POP cohort for which 3-year longitudinal follow-up data were available. Baseline SF TGF-β1 and elastase were associated with the severity of OA progression based on four mutually exclusive, successively more severe, OA outcome progression groups. Successively worse outcomes were associated with higher mean baseline biomarker concentrations of SF TGF-β1 (Z score β=0.90 [95% confidence interval (CI) 0.45 to 1.39], p<0.0001, n=85), SF elastase (Z score β=1.10 [95% CI 0.51 to 1.70], p=0.0005, n=85), and their combination (Z score β=1.54 [95% CI 0.89 to 2.27], p<0.0001, n=85). Since the β values were standardized, higher β yielded by the combination of SF TGF-β1 with SF elastase suggests that patients with high SF TGF-β1 and elastase had the highest likelihood of more severe disease/progression.
Mean baseline concentrations of SF TGF-β1 (3.8 pg/ml [95% CI 3.3 to 4.4 pg/ml], P<0.0001), SF elastase (26770 ng/ml [95% CI 20845 to 32695 ng/ml], P<0.01) and their combination (Z score 0.4 [95% CI 0.03 to 0.84], P<0.0001) in the any progression group (either OST progression, JSN progression or TKR during a 3-year follow-up interval), were significantly higher than the non-progression group mean concentrations of TGF-β1 (2.4 pg/ml [95% CI 1.7 to 3.1 pg/ml]), elastase (11850 ng/ml [95% CI 9852 to 13847 ng/ml]), and their combination (Z score −0.88 [95% CI −1.24 to 0.51]) (Figures 4A, B&C).
Figure 4.
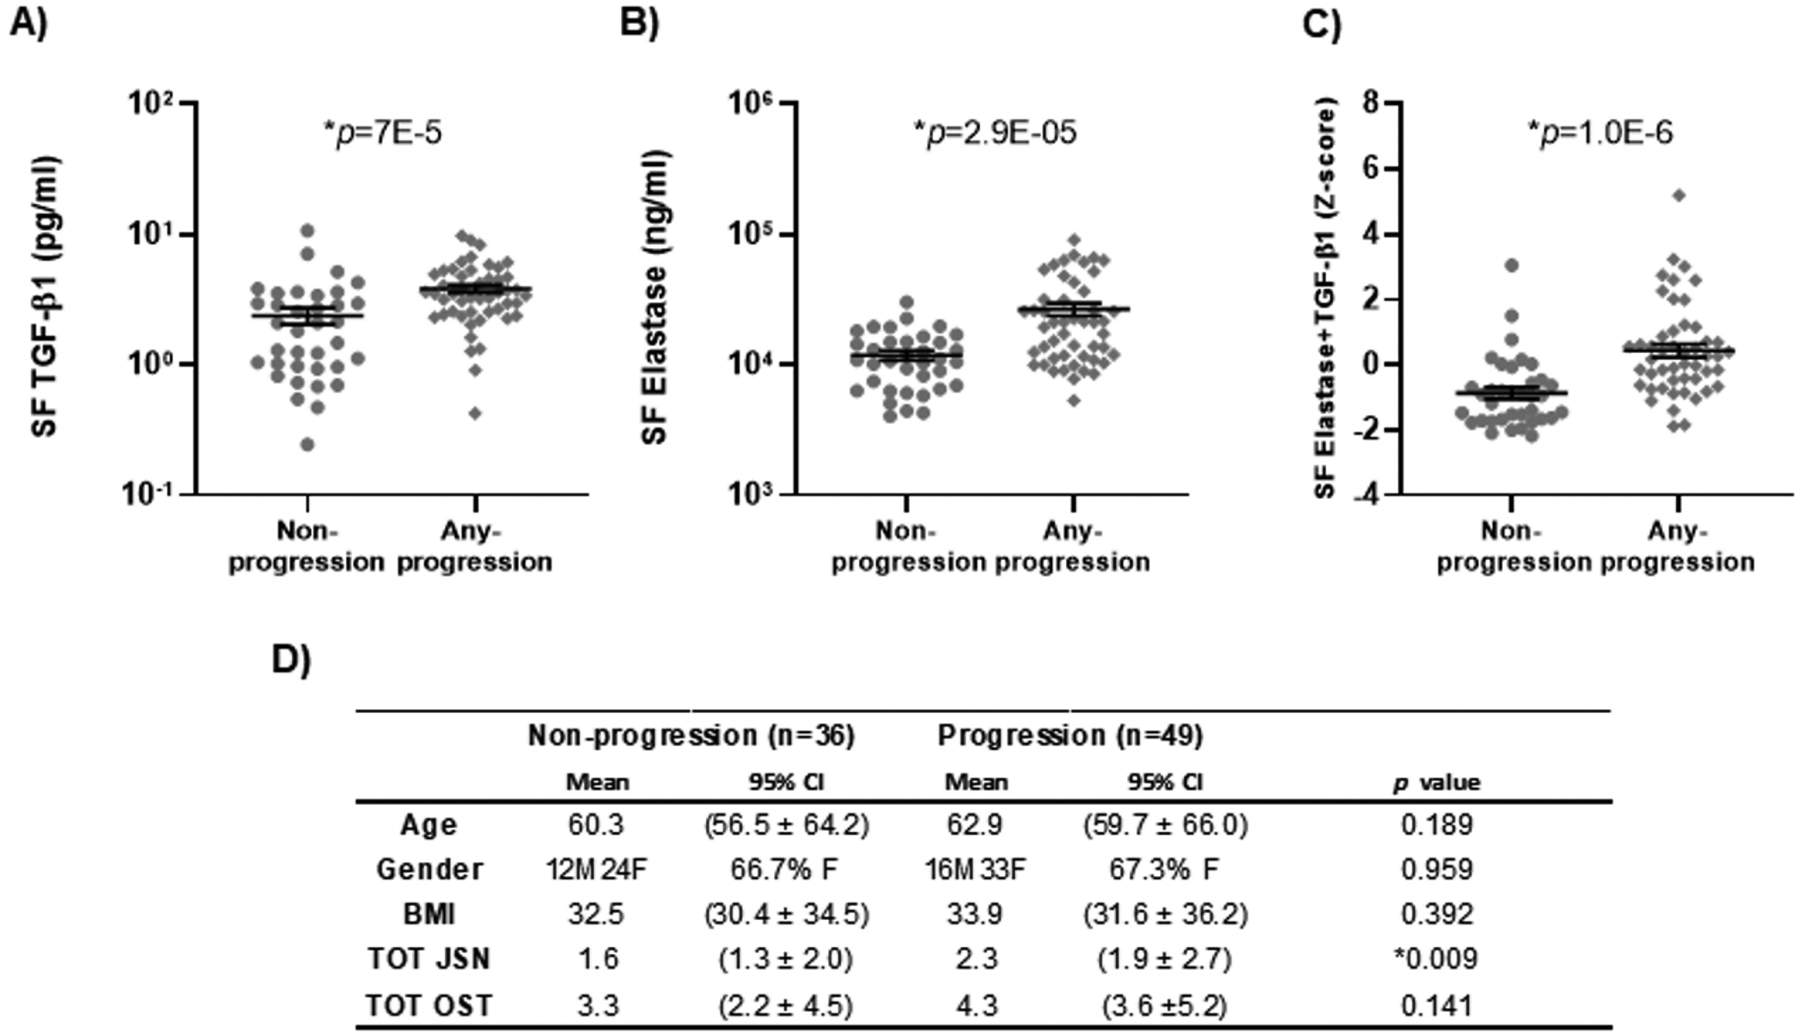
Prediction of osteoarthritis progression by baseline synovial fluid cytokines. Knee OA progression was defined as “non-progression” (n=36) or “any progression” (n=49) based on either 1 unit increase in OST, 1 unit increase in JSN or total knee replacement (TKR) during a 3-year follow-up interval from the POP cohort. Scatter plots by knee OA progression status demonstrate: (A) significantly higher mean SF TGF-β1 of 3.8 pg/ml (95% confidence interval [95% CI] 3.3 to 4.4 pg/ml) in the any progression group compared to 2.4 pg/ml (95% CI 1.7 to 3.1 pg/ml) in the non-progression group; (B) significantly higher mean SF elastase of 26770 ng/ml (95% CI 20845 to 32695 ng/ml) compared to 11850 ng/ml (95% CI 9852 to 13847 ng/ml) in the non-progression group; and (C) significantly higher mean concentration of the combination of the two in the any progression group with Z score 0.4 (95% CI 0.03 to 0.84) compared to Z score −0.88 (95% CI −1.24 to −0.51) in the non-progression group. (D) The demographic information and radiographic feature score separated by progression group and non-progression group.
We used ROC curves to further investigate the prognostic capability of these biomarkers to predict any OA progression vs. non-progression. Both TGF-β1 and elastase predicted any OA progression (Table 1, Supplemental Table 2a), yielding high area under the curve (AUC) values with bootstrapping validations: SF elastase AUC 0.776 (95% BCa [0.662, 0.863]); SF TGF-β1 AUC 0.768 (95% BCa [0.639, 0.858]). The combination (z-score) of the two cytokines yielded a higher AUC 0.827 (95% BCa [0.729, 0.903]) than either cytokine alone. Demographic covariates (age, gender, BMI) yielded AUC 0.596 (95% BCa [0.512, 0.633]); added to SF TGF-β1 and elastase they slightly improved the model predictive capability (increased AUCs), but not the model stability (decreased AICs) (Table 1). Baseline radiographic features (JSN with OST) yielded AUC 0.704 (95% BCa [0.631, 0.769]). The combination of radiographic features and cytokines improved the model performance (AUC 0.806 (95% BCa [0.675, 0.874])) for OA progression. Although the combination of the two cytokines (TGF-β1 and elastase), demographics and radiographic severity variables performed very well as a predictor of any OA progression, yielding AUC 0.854 (95% BCa [0.715, 0.904], the lower order of the model (less than 1) indicated this model was unstable. The best predictive model (high AUC, low AICs and adequate lower/upper order) was provided by the combination of baseline SF TGF-β1, SF elastase and baseline radiographic features (JSN/OST), yielding AUC 0.846 (95% BCa [0.740, 0.907] (Table 1), with a mean specificity and sensitivity of all models of 75.9% and 80%, respectively (Table 1). Each of these markers yielded higher AUCs for OA progression than SF IL-6 and IL-8 (Supplemental Table 2b).
Table 1.
Comparison of the ability to predict OA progression
| AUC | BCa Lower | BCa Upper | AICs | Lower order | Upper order | Specificity (Sensitivity:80%) | |
|---|---|---|---|---|---|---|---|
| Age/Gender/BMI * | 0.596 | 0.512 | 0.633 | 179.56 | 0.49 | 1642.58 | 34.5 |
| JSN/OST | 0.704 | 0.631 | 0.769 | 167.70 | 56.70 | 2432.45 | 50.4 |
| Elastase | 0.776 | 0.662 | 0.863 | 67.34 | 48.14 | 2421.53 | 55.4 |
| Elastase+J/O | 0.810 | 0.670 | 0.874 | 68.32 | 3.84 | 2132.20 | 62.2 |
| TGF-β1 | 0.768 | 0.639 | 0.858 | 70.37 | 36.48 | 2402.03 | 61.1 |
| TGF-β1+J/O | 0.806 | 0.675 | 0.874 | 71.06 | 6.97 | 2230.58 | 74.1 |
| Elastase+TGF-β1 | 0.827 | 0.729 | 0.903 | 64.88 | 43.72 | 2415.91 | 70.4 |
| J/O+Elastase+TGF-β1 | 0.846 | 0.740 | 0.907 | 66.03 | 11.25 | 2293.65 | 75.9 |
| All Combination * | 0.854 | 0.715 | 0.904 | 70.74 | 0.64 | 1852.23 | 77.8 |
A: age; G: gender; B: BMI; J:JSN; O: OST; All combination: A/G/B/J/O/Elastase/TGF-β1. Specificity were based on the cut-off value when sensitivity was 80%. ACIs was based on likelihood ratio test. BCa Lower/Upper: Bias-corrected and accelerated percentile intervals with 95% confidence in Bootstrap (2500 repetitions) confidence limist report.
Lower order and Upper order refer to the order statistic used to obtain the lower and upper 95% confidence interval for the AUC. The model with order statistics range less than 1 (lower) or above 2500 (upper) indicates the model was unstable.
Discussion
The inflammatory microenvironment of the OA joint is shown here to be orchestrated by macrophages, neutrophils, and multiple inflammatory cytokines. Previous studies have demonstrated the importance of macrophages and macrophage-related mediators in driving inflammatory and destructive responses in OA16, 17. However, the evaluation of the role of neutrophils in chronic arthritis inflammation has generally been confined to rheumatoid arthritis18 or indirectly related to OA19, 26. Our findings of the presence of neutrophils in SF and SV, their production of SF elastase, and the association of SF elastase with OA progression, clearly demonstrate the involvement of neutrophils in the sterile inflammatory process and progression of OA. Whereas macrophages were localized to both SV and SF, we found that neutrophils were predominantly localized to SF. SF elastase and SF TGF-β1, singly or combined, performed very well in discriminating between knee OA patients at high vs low risk of any knee OA progression.
SF TGF-β1 was predominantly produced by SV macrophages. This result is consistent with the production of TGF-β1 predominantly within the synovial lining layer as shown previously3, 8, and an animal model study in which depletion of synovial macrophages resulted in a significant reduction of osteophyte formation33 (a TGF-β1 driven process34). Our findings are congruent with a prior study reporting a predominance of macrophage proliferation and the absence of neutrophils in OA synovial tissue3. Macrophages express the α4β7 integrin35 enabling their tethering in OA synovium via vascular cell adhesion molecule-1 (VCAM-1), expressed by SV fibroblasts. These α4 integrins are constitutively expressed on all human leukocyte subtypes except neutrophils36. The lack of α4 integrins on human neutrophils may, at least in part, account for the general lack of neutrophils in OA synovium. Additionally, transmigrating neutrophils secrete localized elastase, a serine protease with broad specificity that is protected from plasma inhibitors37. The expression of elastase enables neutrophils to transmigrate extracellular matrices and even modulate trafficking of other leukocyte subsets, such as T cells, by altering their endothelial-associated chemotactic activities37. In our study, we observed that the SF concentration of elastase was inversely correlated with SF and SV T cell number; elastase-modulated leukocyte trafficking may contribute to these inverse associations37.
In this study, the number of SF macrophages was positively associated with SF IL-6. Although macrophages were a source of IL-6, only a minority of macrophages expressed this cytokine based on flow cytometric analysis. SF IL-6 was also positively associated with neutrophils. A recent study demonstrated that IL-6 was produced by a variety of types of OA synovial tissue cells, including fibroblasts, macrophages, neutrophils, T cells and B cells38. Taken together, these findings show that IL-6 is generally involved in OA inflammatory responses but may not be representative of a specific cell type.
We also observed that the associations between SF TGF-β1/ IL-27/ TNF-α were positive with SV but negative with SF macrophages. Several prior studies provide potential explanations for this finding. TGF-β induces synovial lining cells to produce inflammatory factors, including TNF-α39. An in vitro study also found that IL-27 induces higher fibroblast-like synoviocyte surface expression of VCAM-1, which is known to tether migratory macrophages to SV35, 40. In an arthritic mice model study, TNF-α is significantly reduced in IL-27−/− mice compared to IL-27+/+ mice41. These studies provide evidence that both TGF-β and IL-27 are linked to TNF-α and interact with macrophages in SV and thereby provide evidence to explain the observed differences in their association in this study between the macrophages in SV and SF.
Neutrophils contribute to the cytokine and chemokine cascades that accompany inflammation and regulate immune responses via cell-cell interactions18. By analogy to rheumatoid arthritis18, owing to their ability to release degradative enzymes and reactive oxygen species, neutrophils possess the most significant cytotoxic potential of the cells implicated in the pathology of OA. The strong association of SF neutrophil number with SF elastase concentrations in our study supported a synovial fluid origin, as opposed to a synovial tissue origin, of activated neutrophils and this destructive enzyme in OA18, 42. Neutrophil elastase has been implicated in both joint inflammation and pain in mouse models through its ability to activate proteinase-activated receptor 2 (PAR2), resulting in the activation of transient receptor potential (TRP) ion channels2. Inhibition of neutrophil elastase, PAR2 or p44/42 MAPK activity all reduced inflammation and pain2. In the intra-articular monoiodoacetate (MIA) murine model system, in which neutrophil elastase proteolytic activity and transient inflammation were induced, early treatment with PAR2 antagonist, GB83, reversed the inflammation43. MIA-induced synovitis and joint pain were both attenuated in PAR2 knockout mice43. Neutrophil elastase has also been implicated in osteophyte formation through PAR244 with a significant reduction of osteophyte formation in PAR2 knockout mice44. The re-expression of PAR2 by adenovirus in PAR2−/− mice recapitulated osteophyte formation44. Taken together, these data suggest the critical role of elastase in the PAR2 pathway related to arthritis pain and inflammation2, which are consistent with our findings of an association of neutrophils with OST severity and OA progression. Given the role of neutrophils and elastase in human OA, elastase inhibitors may be a potential therapeutic strategy for slowing OA progression and reducing symptoms.
We favored evaluating the progression in the POP cohort with JSN and OST separately as they represent catabolic and anabolic phenomena, respectively and as stated by Ratzlaff et al., separate evaluation of these radiographic manifestations of OA may better distinguish pathological processes potentially critical to understanding etiologic pathways of risk factors and interventions in knee OA45. As recently computed by Ratzlaff et al., a one-grade increase in OARSI-JSN (used in defining OA progression in this study) was associated with a mean decrease in minimum joint space width (JSW) of −0.75 to −0.97 mm or fixed JSW of −0.76 to −1.03 mm (amount dependent on the baseline level of JSN)45. Importantly, based on a study by Bruyere et al.46, a loss of 0.7 mm mJSW after three years provided the best numerical overall efficiency for predicting the incidence of future knee surgery; notably, a loss of mJSW between 0.5 and 0.8 mm after three years was linked to a four- to five-fold increase (p=0.003 to 0.004) in the risk of future knee surgery over the subsequent 8 years. Thus, these studies confirmed the clinical relevance of a 1 unit change in categorical JSN, underscoring the potential clinical relevance of the biomarker prediction of progression in our study.
It is possible that cell types in addition to macrophages may produce TGF-β1 and thereby lead to the lower association between SF TGF-β1 concentrations with the number of SV macrophages. For example, in peripheral blood, previous studies have shown that TGF-β1 was detected in human CD4+ T cells47, and also neutrophils48. In the joint, TGF-β1 has been detected in synovial tissue8 and chondrocytes49. However, the synovial fluid TGF-β level was very low or absent in normal joints and elevated during joint disease development, such as OA50. Although cell types other than macrophages in peripheral blood could also be contributing to SF TGF-β1, our results suggest that SV macrophages were primarily responsible based on the stronger associations of SF TGF-β1 with macrophage cell number and MFI compared with associations with other cell types evaluated (T cells and neutrophils).
The synovial tissue provided to us was at the discretion of the collaborating surgeons. Although not designated a priori from a specific location, the tissues we obtained represented synovial tissue still attached to the tibial plateau. However, the anatomical location of SV was not standardized across patients. SV cells and SF biomarkers might have correlated even more strongly were we able to more precisely control the synovial tissue harvest. Nevertheless, given the results that effector cytokines associated with the SV and SF cell types were predictive of OA severity and progression in samples from cohorts with follow-up data and the full spectrum of rOA severity, we do not believe SV sample location was a major confounder, although it may have accounted for a certain degree of variance of inflammatory status between patient samples. Because the SV was collected at the time of surgery, fresh blood sometimes covered the tissue surface. The synovial tissue was rinsed with 70% ethanol then washed with phosphate-buffered saline (PBS) to remove potential peripheral blood contaminants. With these wash steps, we believe that the cells we isolated were predominantly resident within synovial tissue instead of from peripheral blood contamination. We therefore expect that the cells we analyzed would be minimally contaminated by peripheral blood leukocytes.
In summary, we have demonstrated that baseline SF elastase and TGF-β1, singly or combined, strongly predict the risk of knee OA progression, reflecting the hitherto under-appreciated role of neutrophils in the sterile inflammatory process and progression of OA, and the synergism of neutrophils with macrophage populations in the pathogenesis and worsening of OA. Both SF TGF-β1 and elastase might be utilized to identify patients at risk for more rapid and severe disease progression. A separate sample cohort with longitudinal follow-up data will be required to validate these findings. These results provide evidence that therapies targeting pathogenic immune cell populations might be used to attenuate inflammation of OA.
Supplementary Material
Acknowledgments
We wish to thank Endocyte and Dr. Y Li for providing fluorescently-labeled folic acid for the study. We also thank Alexander Reed for conducting confirmatory bootstrap analysis.
Role of funding sources
This study was supported by NIH grant R01-AR-48769 and P30-AG-028716 (to VBK); the primary Etarfolatide study was conducted with the support of a grant from Lilly USA, Inc.
Footnotes
Competing interest statement
The authors have no conflict of interest of any kind with regard to this work.
References
- 1.Berenbaum F Osteoarthritis as an inflammatory disease (osteoarthritis is not osteoarthrosis!). Osteoarthritis Cartilage 2013;21(1):16–21. [DOI] [PubMed] [Google Scholar]
- 2.Muley MM, Reid AR, Botz B, Bolcskei K, Helyes Z, McDougall JJ. Neutrophil elastase induces inflammation and pain in mouse knee joints via activation of proteinase-activated receptor-2. Br J Pharmacol 2016;173(4):766–77. [DOI] [PMC free article] [PubMed] [Google Scholar]
- 3.de Lange-Brokaar BJ, Ioan-Facsinay A, van Osch GJ, Zuurmond AM, Schoones J, Toes RE, Huizinga TW, Kloppenburg M. Synovial inflammation, immune cells and their cytokines in osteoarthritis: a review. Osteoarthritis Cartilage 2012;20(12):1484–99. [DOI] [PubMed] [Google Scholar]
- 4.Tarhan S, Unlu Z. Magnetic resonance imaging and ultrasonographic evaluation of the patients with knee osteoarthritis: a comparative study. Clin Rheumatol 2003;22(3):181–8. [DOI] [PubMed] [Google Scholar]
- 5.Song IH, Althoff CE, Hermann KG, Scheel AK, Knetsch T, Schoenharting M, Werner C, Burmester GR, Backhaus M. Knee osteoarthritis. Efficacy of a new method of contrast-enhanced musculoskeletal ultrasonography in detection of synovitis in patients with knee osteoarthritis in comparison with magnetic resonance imaging. Ann Rheum Dis 2008;67(1):19–25. [DOI] [PubMed] [Google Scholar]
- 6.Atukorala I, Kwoh CK, Guermazi A, Roemer FW, Boudreau RM, Hannon MJ, Hunter DJ. Synovitis in knee osteoarthritis: a precursor of disease? Ann Rheum Dis 2016;75(2):390–5. [DOI] [PMC free article] [PubMed] [Google Scholar]
- 7.Kraus VB, McDaniel G, Huebner JL, Stabler TV, Pieper CF, Shipes SW, Petry NA, Low PS, Shen J, McNearney TA, Mitchell P. Direct in vivo evidence of activated macrophages in human osteoarthritis. Osteoarthritis Cartilage 2016;24(9):1613–21. [DOI] [PMC free article] [PubMed] [Google Scholar]
- 8.Tsuneyoshi Y, Tanaka M, Nagai T, Sunahara N, Matsuda T, Sonoda T, Ijiri K, Komiya S, Matsuyama T. Functional folate receptor beta-expressing macrophages in osteoarthritis synovium and their M1/M2 expression profiles. Scand J Rheumatol 2012;41(2):132–40. [DOI] [PubMed] [Google Scholar]
- 9.Hsueh MF, Lu Y, Wheeler L, Wellman SS, Bolognesi MP, Kraus VB. Functional Folate Receptor Cells within Synovium and Fluid as Therapeutic Targets for Osteoarthritis. Osteoarthritis and Cartilage 2017;25:S42–S43. [Google Scholar]
- 10.Daghestani HN, Pieper CF, Kraus VB. Soluble macrophage biomarkers indicate inflammatory phenotypes in patients with knee osteoarthritis. Arthritis Rheumatol 2015;67(4):956–65. [DOI] [PMC free article] [PubMed] [Google Scholar]
- 11.Landmann R, Müller B, Zimmerli W. CD14, new aspects of ligand and signal diversity. Microbes Infect 2000;2(3):295–304. [DOI] [PubMed] [Google Scholar]
- 12.Bazil V, Strominger JL. Shedding as a mechanism of down-modulation of CD14 on stimulated human monocytes. 1991;147(5):1567–1574. [PubMed] [Google Scholar]
- 13.Wright SD, Ramos RA, Tobias PS, Ulevitch RJ, Mathison JC. CD14, a receptor for complexes of lipopolysaccharide (LPS) and LPS binding protein. Science 1990;249(4975):1431–3. [DOI] [PubMed] [Google Scholar]
- 14.Akashi S, Ogata H, Kirikae F, Kirikae T, Kawasaki K, Nishijima M, Shimazu R, Nagai Y, Fukudome K, Kimoto M, Miyake K. Regulatory roles for CD14 and phosphatidylinositol in the signaling via toll-like receptor 4-MD-2. Biochem Biophys Res Commun 2000;268(1):172–7. [DOI] [PubMed] [Google Scholar]
- 15.Krutzik SR, Sieling PA, Modlin RL. The role of Toll-like receptors in host defense against microbial infection. Curr Opin Immunol 2001;13(1):104–8. [DOI] [PubMed] [Google Scholar]
- 16.Bondeson J, Blom AB, Wainwright S, Hughes C, Caterson B, van den Berg WB. The role of synovial macrophages and macrophage-produced mediators in driving inflammatory and destructive responses in osteoarthritis. Arthritis Rheum 2010;62(3):647–57. [DOI] [PubMed] [Google Scholar]
- 17.Bondeson J, Wainwright SD, Lauder S, Amos N, Hughes CE. The role of synovial macrophages and macrophage-produced cytokines in driving aggrecanases, matrix metalloproteinases, and other destructive and inflammatory responses in osteoarthritis. Arthritis Res Ther 2006;8(6):R187. [DOI] [PMC free article] [PubMed] [Google Scholar]
- 18.Wright HL, Moots RJ, Edwards SW. The multifactorial role of neutrophils in rheumatoid arthritis. Nat Rev Rheumatol 2014;10(10):593–601. [DOI] [PubMed] [Google Scholar]
- 19.Gupta K, Shukla M, Cowland JB, Malemud CJ, Haqqi TM. Neutrophil gelatinase-associated lipocalin is expressed in osteoarthritis and forms a complex with matrix metalloproteinase 9. Arthritis Rheum 2007;56(10):3326–35. [DOI] [PubMed] [Google Scholar]
- 20.Benigni G, Dimitrova P, Antonangeli F, Sanseviero E, Milanova V, Blom A, van Lent P, Morrone S, Santoni A, Bernardini G. CXCR3/CXCL10 Axis Regulates Neutrophil-NK Cell Cross-Talk Determining the Severity of Experimental Osteoarthritis. J Immunol 2017;198(5):2115–2124. [DOI] [PubMed] [Google Scholar]
- 21.Leung YY, Yao Hui LL, Kraus VB. Colchicine-Update on mechanisms of action and therapeutic uses. Semin Arthritis Rheum 2015(June 26). [DOI] [PMC free article] [PubMed] [Google Scholar]
- 22.Das SK, Mishra K, Ramakrishnan S, Srivastava R, Agarwal GG, Singh R, Sircar AR. A randomized controlled trial to evaluate the slow-acting symptom modifying effects of a regimen containing colchicine in a subset of patients with osteoarthritis of the knee. Osteoarthritis Cartilage 2002;10(4):247–52. [DOI] [PubMed] [Google Scholar]
- 23.Das SK, Ramakrishnan S, Mishra K, Srivastava R, Agarwal GG, Singh R, Sircar AR. A randomized controlled trial to evaluate the slow-acting symptom-modifying effects of colchicine in osteoarthritis of the knee: a preliminary report. Arthritis Rheum 2002;47(3):280–4. [DOI] [PubMed] [Google Scholar]
- 24.Aran S, Malekzadeh S, Seifirad S. A double-blind randomized controlled trial appraising the symptom-modifying effects of colchicine on osteoarthritis of the knee. Clin Exp Rheumatol 2011;29(3):513–8. [PubMed] [Google Scholar]
- 25.Srivastava R, Das SK, Goel G, Asthana A, Agarwal GG. Does long term colchicine prevent degradation of collagen fiber network in osteoarthritis? Int J Rheum Dis 2018;21(1):114–117. [DOI] [PubMed] [Google Scholar]
- 26.Leung YY, Haaland B, Huebner JL, Wong SBS, Tjai M, Wang C, Chowbay B, Thumboo J, Chakraborty B, Tan MH, Kraus VB. Colchicine lack of effectiveness in symptom and inflammation modification in knee osteoarthritis (COLKOA): a randomized controlled trial. Osteoarthritis and Cartilage 2018;26(5):631–640. [DOI] [PubMed] [Google Scholar]
- 27.Kellgren JH, Lawrence JS. Radiological assessment of osteo-arthrosis. Ann Rheum Dis 1957;16(4):494–502. [DOI] [PMC free article] [PubMed] [Google Scholar]
- 28.Addison S, Coleman RE, Feng S, McDaniel G, Kraus VB. Whole-body bone scintigraphy provides a measure of the total-body burden of osteoarthritis for the purpose of systemic biomarker validation. Arthritis Rheum 2009;60(11):3366–73. [DOI] [PMC free article] [PubMed] [Google Scholar]
- 29.Altman RD, Gold GE. Atlas of individual radiographic features in osteoarthritis, revised. Osteoarthritis Cartilage 2007;15 Suppl A:A1–56. [DOI] [PubMed] [Google Scholar]
- 30.Leung YY, Huebner JL, Haaland B, Wong SBS, Kraus VB. Synovial fluid pro-inflammatory profile differs according to the characteristics of knee pain. Osteoarthritis and Cartilage 2017;25(9):1420–1427. [DOI] [PubMed] [Google Scholar]
- 31.Zweig MH, Campbell G. Receiver-operating characteristic (ROC) plots: a fundamental evaluation tool in clinical medicine. Clin Chem 1993;39(4):561–77. [PubMed] [Google Scholar]
- 32.Kraus VB, Feng S, Wang S, White S, Ainslie M, Brett A, Holmes A, Charles HC. Trabecular morphometry by fractal signature analysis is a novel marker of osteoarthritis progression. Arthritis Rheum 2009;60(12):3711–22. [DOI] [PMC free article] [PubMed] [Google Scholar]
- 33.Blom AB, van Lent PL, Holthuysen AE, van der Kraan PM, Roth J, van Rooijen N, van den Berg WB. Synovial lining macrophages mediate osteophyte formation during experimental osteoarthritis. Osteoarthritis Cartilage 2004;12(8):627–35. [DOI] [PubMed] [Google Scholar]
- 34.van Beuningen HM, van der Kraan PM, Arntz OJ, van den Berg WB. Transforming growth factor-beta 1 stimulates articular chondrocyte proteoglycan synthesis and induces osteophyte formation in the murine knee joint. Lab Invest 1994;71(2):279–90. [PubMed] [Google Scholar]
- 35.Prieto-Potin I, Largo R, Roman-Blas JA, Herrero-Beaumont G, Walsh DA. Characterization of multinucleated giant cells in synovium and subchondral bone in knee osteoarthritis and rheumatoid arthritis. BMC Musculoskelet Disord 2015;16:226. [DOI] [PMC free article] [PubMed] [Google Scholar]
- 36.Davenpeck KL, Sterbinsky SA, Bochner BS. Rat neutrophils express alpha4 and beta1 integrins and bind to vascular cell adhesion molecule-1 (VCAM-1) and mucosal addressin cell adhesion molecule-1 (MAdCAM-1). Blood 1998;91(7):2341–6. [PubMed] [Google Scholar]
- 37.Rao RM, Betz TV, Lamont DJ, Kim MB, Shaw SK, Froio RM, Baleux F, Arenzana-Seisdedos F, Alon R, Luscinskas FW. Elastase Release by Transmigrating Neutrophils Deactivates Endothelial-bound SDF-1α and Attenuates Subsequent T Lymphocyte Transendothelial Migration. 2004;200(6):713–724. [DOI] [PMC free article] [PubMed] [Google Scholar]
- 38.Labinsky H, Panipinto PM, Ly KA, Khuat DK, Madarampalli B, Mahajan V, Clabeaux J, MacDonald K, Verdin PJ, Buckner JH, Noss EH. Multiparameter Analysis Identifies Heterogeneity in Knee Osteoarthritis Synovial Responses. 2020;72(4):598–608. [DOI] [PMC free article] [PubMed] [Google Scholar]
- 39.Cheon H, Yu SJ, Yoo DH, Chae IJ, Song GG, Sohn J. Increased expression of pro-inflammatory cytokines and metalloproteinase-1 by TGF-beta1 in synovial fibroblasts from rheumatoid arthritis and normal individuals. Clinical and experimental immunology 2002;127(3):547–552. [DOI] [PMC free article] [PubMed] [Google Scholar]
- 40.Wong CK, Chen DP, Tam LS, Li EK, Yin YB, Lam CW. Effects of inflammatory cytokine IL-27 on the activation of fibroblast-like synoviocytes in rheumatoid arthritis. Arthritis Res Ther 2010;12(4):R129. [DOI] [PMC free article] [PubMed] [Google Scholar]
- 41.Cao Y, Doodes PD, Glant TT, Finnegan A. IL-27 Induces a Th1 Immune Response and Susceptibility to Experimental Arthritis. 2008;180(2):922–930. [DOI] [PubMed] [Google Scholar]
- 42.Barrett AJ. The possible role of neutrophil proteinases in damage to articular cartilage. Agents Actions 1978;8(1–2):11–8. [DOI] [PubMed] [Google Scholar]
- 43.Muley MM, Krustev E, Reid AR, McDougall JJ. Prophylactic inhibition of neutrophil elastase prevents the development of chronic neuropathic pain in osteoarthritic mice. J Neuroinflammation 2017;14(1):168. [DOI] [PMC free article] [PubMed] [Google Scholar]
- 44.Huesa C, Ortiz AC, Dunning L, McGavin L, Bennett L, McIntosh K, Crilly A, Kurowska-Stolarska M, Plevin R, van ‘t Hof RJ, Rowan AD, McInnes IB, Goodyear CS, Lockhart JC, Ferrell WR. Proteinase-activated receptor 2 modulates OA-related pain, cartilage and bone pathology. Ann Rheum Dis 2016;75(11):1989–1997. [DOI] [PMC free article] [PubMed] [Google Scholar]
- 45.Ratzlaff C, Ashbeck EL, Guermazi A, Roemer FW, Duryea J, Kwoh CK. A quantitative metric for knee osteoarthritis: reference values of joint space loss. Osteoarthritis and cartilage 2018;26(9):1215–1224. [DOI] [PMC free article] [PubMed] [Google Scholar]
- 46.Bruyere O, Richy F, Reginster JY. Three year joint space narrowing predicts long term incidence of knee surgery in patients with osteoarthritis: an eight year prospective follow up study. Ann Rheum Dis 2005;64(12):1727–30. [DOI] [PMC free article] [PubMed] [Google Scholar]
- 47.Zhang X, Tao Y, Chopra M, Ahn M, Marcus KL, Choudhary N, Zhu H, Markovic-Plese S. Differential reconstitution of T cell subsets following immunodepleting treatment with alemtuzumab (anti-CD52 monoclonal antibody) in patients with relapsing-remitting multiple sclerosis. J Immunol 2013;191(12):5867–74. [DOI] [PubMed] [Google Scholar]
- 48.Grotendorst GR, Smale G, Pencev D. Production of transforming growth factor beta by human peripheral blood monocytes and neutrophils. J Cell Physiol 1989;140(2):396–402. [DOI] [PubMed] [Google Scholar]
- 49.Villiger PM, Lotz M. Differential expression of TGF beta isoforms by human articular chondrocytes in response to growth factors. J Cell Physiol 1992;151(2):318–25. [DOI] [PubMed] [Google Scholar]
- 50.van der Kraan PM. Differential Role of Transforming Growth Factor-beta in an Osteoarthritic or a Healthy Joint. Journal of bone metabolism 2018;25(2):65–72. [DOI] [PMC free article] [PubMed] [Google Scholar]
Associated Data
This section collects any data citations, data availability statements, or supplementary materials included in this article.