
Fig 3.
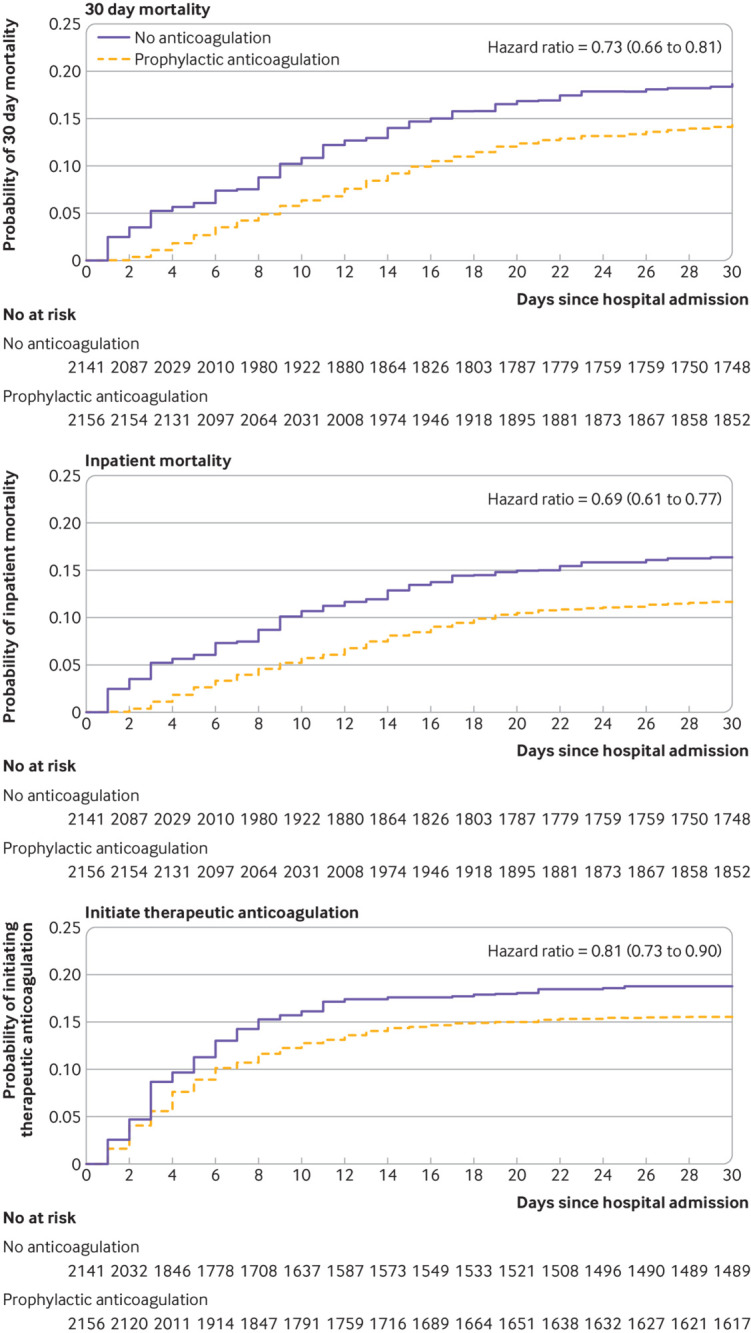
Inverse probability treatment weighted Kaplan-Meier plots. Numbers at risk were calculated by multiplying weights by constant factor k, where k was the ratio of observed sample size to number in the pseudopopulation after inverse probability treatment weighting; in this study, k=4297/8576