

Abstract

Seven cytochalasins, 19,20-epoxycytochalasin N, cytochalasin P1, deacetyl 19,20-epoxycytochalasin C, 19,20-epoxycytochalasin D, 19,20-epoxycytochalasin C, cytochalasin D, and cytochalasin C, were isolated from a fungal (Rosellinia sanctae-cruciana) crude extract. A cytotoxicity assay (sulforhodamine B) was performed on a series of cancer cell lines: HT-29, A-549, PC-3, HCT-116, SW-620, and MCF-7. Simultaneously, the liquid chromatography–mass spectrometry (LC–MS)/MS profile of 19,20-epoxycytochalasin C-treated cell lines revealed that 19,20-epoxycytochalasin C (m/z 524.25) oxidized to a metabolite of m/z 522.25 Da (−2 Da (−2H) from 19,20-epoxycytochalasin C). Further chemical oxidation of 19,20-epoxycytochalasin C using the Dess–Martin reagent produced an identical metabolite. It has been noticed that the parent molecule (19,20-epoxycytochalasin C) showed an IC50 of 650 nM (on HT-29), whereas for the oxidized metabolite (m/z 522.24) of 19,20-epoxycytochalasin C, the IC50 was >10 μM. It is clear that the parent molecule had 16 times higher cytotoxic potential as compared to the oxidized metabolite. The spectroscopic investigation indicated that the oxidation of the hydroxyl (−OH) group occurred at the C7 position in 19,20-epoxycyctochalsin C and led to the inactivation of 19,20-epoxycytochalasin C. Further, cell cycle analysis and histopathological evidence support the findings, and CDK2 could be a possible target of 19,20-epoxycyctochalasin C.
Introduction
Cytochalasins are a structurally diverse group of fungal secondary metabolites. Since the first discovery in 1967, hundreds of different cytochalasins have been reported with a broad range of biological activity. The actin cytoskeleton is the most common and widely studied target of these metabolites; interaction to actin affects various cellular processes such as cell adhesion, motility, signaling, and cytokinesis.1,2 This macrocycle can vary tremendously between cytochalasins as carbocycles, lactones, or even cyclic.3 Cytochalasins encapsulate a tremendous diversity of mycogenic toxins that are unique in both structures and targets. As a result, the mechanisms by which these pharmacological agents damage malignant cells are immense. Consequently, there are a substantial variety of mycogenic agents to examine for efficacy in chemotherapy.4 However, to date, cytochalasins have typically been thought of as crucial experimental agents for probing mechanisms of the cytoskeleton and delineated as valid chemotherapeutic agents. In fact, a clinically approved microfilament-directed agent yet has to be approved for use in cancer therapy with substantial evidence, suggesting that cytochalasins may be vital anticancer agents.5 Although cytochalasins are reported frequently for their anti-inflammatory,6 apoptosis-inducing, antiangiogenesis, nematicidal, and antifungal6 activities against bacteria,7 these compounds seem too cytotoxic for use in clinical trials. Present studies conducted by computer-assisted phase-contrast microscopy revealed that cytotoxicity and cytostatic behaviors of cytochalasins are two different mechanisms (actin depolymerization and nuclear fragmentation).8,9 Due to the wide diversity of mechanisms by which cytochalasins damage malignant cells while considering selectivity against normal cells.10,11 As microfilament-directed agents proved to be valuable in clinical cancer management. However, the efficacy of this broad molecular family has been shown predominantly by only two specific structures (cytochalasins B and D),10,11 and more research is required to deduce whether other cytochalasins have the clinical potential for cancer research. Furthermore, extensive in vivo studies need to be considered to accurately determine the prospective clinical utility of cytochalasins, as there is less understanding of the relative in vivo host toxicity of the cytochalasins. Therefore, using cytochalasins to preferentially damage malignant cells through actin disruption is a novel prospect. It is important to note that cytochalasins B and D have been the most inspected. Most cytochalasins demonstrate the capacity to inhibit tumorigenic growth, especially of the HT-29 cancer cell line.12 In the study, we have analyzed the liquid chromatography–mass spectrometry (LC–MS)/MS profiling of the cytochalasin-treated cell line and identified an oxidized metabolite of 19,20-epoxycytochalasin C. Further, we have synthesized the same metabolite via chemical transformation as affirmed during cytotoxicity profiling. We have found that the metabolite was inactive in comparison to the parent molecule via cell cycle analysis. Moreover, this was achieved by the LC–MS/MS study of cancer cell lines with high accuracy. Tandem MS of different cytochalasins is very useful for metabolic identification of cytochalasins in crude extracts. The complete structure elucidation of metabolites (oxidized 19,20-epoxycytochalasin C) provides valuable information to medicinal chemists about target structure modification and structure–activity relationship, during the drug development process. The ability to identify drug metabolism at a small scale is useful to further perform the bioassay and study the toxicity of potential drug candidates.
Experimental Section
Chemicals and Reagents
Potato dextrose agar (PDA) and potato dextrose broth (PDB) were purchased from Himedia, India. LC–MS-grade methanol, acetonitrile, sulphorhodamine B dye (SRB), and formic acid were acquired from Sigma-Aldrich, and water (MS-grade) was from Merck. 19,20-Epoxycytochalasin C was isolated from fungal culture (Figure S1) and dissolved in dimethyl sulfoxide (DMSO, Sigma-Aldrich) to get a 10 mM stock solution. Fetal bovine serum (FBS), penicillin, streptomycin, trypsin, and phosphate-buffered saline (PBS) were obtained from Gibco, and propidium iodide (PI) was purchased from Calbiochem.
Fungal Strain, Culture Conditions, and Semipreparative Isolation of Cytochalasins
The fungal strain was subcultured on PDA media in Petri plates maintained at 28 °C for 7 days. The agar plugs were used to inoculate 500 mL Erlenmeyer flasks, each containing 200 mL of autoclaved PDB; the flask cultures were incubated at 28 °C for 3 days in a shaking incubator at 150 rpm in the dark to obtain the seed culture. Seed culture (10%) was used to inoculate 40 Erlenmeyer flasks of 1000 mL, each containing ≈400 mL of potato dextrose broth medium and incubated under the same condition as seed culture for 10 days. Total seven cytochalasins, comparing the spectroscopic data of all isolates with those reported in the literature, were isolated by semipreparative high-pressure liquid chromatography (HPLC) and characterized by NMR and mass spectroscopy (Figures S1–S9).1,2,13−17
Sample Preparation for Dereplication Analysis
Fermentation was terminated by adding 10% methanol in the broth followed by homogenization and centrifugation to separate the cell debris. The supernatant was extracted with an equal volume of ethyl acetate three times. The organic extract was concentrated under vacuum using a rotary evaporator to yield 90 mg of brown oil extract (Figure S1).
LC–MS and Tandem MS Analyses
LC separation was achieved by an Agilent 1290 HPLC infinity series, equipped with an Agilent UHD Q-TOF 6540 mass spectrometer (Agilent Technologies, Santa Clara, CA) and an Agilent RP18e column (4.6 × 250 mm, 5 μm). The separation was performed at a flow rate of 0.5 mL/min under a gradient program, in which eluent A was composed of 0.1% formic acid in water and eluent B was composed of acetonitrile. The gradient system was applied as follows: 20–50% of B in 0–20 min, 50–70% of B in 20–25 min, 70–20% of B in 25–26 min, and hold for 3 min; the total run time was 30 min. The electrospray ionization (ESI)–LC–HRMS data acquired by the Agilent UHD Q-TOF 6540 was in the positive mode. MS acquiring parameters are as follows: capillary voltage, 3 kV in the positive mode with a gas temperature of 300 °C; drying gas, 12 L/min; and nebulizer pressure, 35 psi. The scan source parameters skimmer, fragmentor, and octapole RF peak were 65, 175, and 700 V, respectively. The data acquired with a mass scan range were 100–2000 m/z in ESI positive mode. MS/MS acquisition of molecular ion peaks was performed with the same parameter using a fixed collision energy of 30 eV in the positive mode for target compounds (Figure S2). The cell lines A-549 (lung), PC-3 (prostate), HCT-116 (colon), HT-29 (colon), SW-620 (colon), and MCF-7 (breast) were used for the metabolite profiling of cytochalasins.
Chemical Transformation of 19,20-Epoxycytochalasin C
A solution of Dess–Martin periodinane was prepared in dichloromethane (1 mg/mL), and 100 μL of Dess–Martin periodinane solution was added to a 1 mL solution of 19,20-epoxycytochalasin C (10 mg/mL in dichloromethane), mixed well, and held for 24 h. The reaction was terminated by the addition of 1 mL of methanol solution; this reaction mixture was further used for semipreparative HPLC analysis (Figure S10).
Cell Lines and Growth Conditions
The human cancer cell lines representing lung (A-549), prostate (PC-3), colon (HCT-116, HT-29, and SW-620), and breast (MCF-7) were procured from NCI-60: National Cancer Institute. The cell lines of the cancer-screening panel were sustained in RPMI-1640 medium containing 10% fetal calf serum (FCS), penicillin (100 units/mL), and streptomycin (100 μg/mL). The cell cultures were grown in a CO2 incubator (New Brunswick, Galaxy 170 R, Eppendorf) at 37 °C under 98% humidity, 95% air, 100% relative humidity, and a 5% CO2 environment.
Sulphorhodamine B (SRB) Assay
The cell suspension (100 μL) was seeded in 96-well flat-bottom plates (NUNC), with the density ranging from 7000 to 12 000 cells/well depending on the doubling time of particular cell lines. The plates were incubated (37 °C, 5% CO2, 95% air, and 100% relative humidity) for 24 h. After 24 h, the cells were exposed to different concentrations of cytochalasins along with Paclitaxel and 5-FU as a positive control for 48 h under the same condition. After 48 h, cells were fixed in situ with cold TCA for 60 min at 4 °C. Then, plates were rinsed three times with water and air-dried. The SRB solution (0.4% of SRB in 1% acetic acid) was added to each well and incubated for 30 min at room temperature. After staining, the plates were washed (three times) with 1% acetic acid and air-dried. A 10 mM Tris base buffer solution was used for solubilizing the protein-bound dye. The absorbance was read at a wavelength of 540 nm on a microplate reader (Thermo Scientific). Growth inhibition (GIC50) was established by plotting OD against concentration using GraphPad Prism, version 5.
 |
Phase-Contrast Microscopy
Human colon cancer cells (HT-29) were seeded in six-well plates at a density of 1 × 10⁵ cells/mL and then cultured for 24 h. Eventually, the cells were subjected to treatment with varying concentrations of 19,20-epoxycytochalasin C for 48 h. Preceding drug treatment, culture plates were analyzed using an inverted light microscope (Nikon Corp., Tokyo, Japan) and images were taken (Figure S23).
Scanning Electron Microscopy (SEM)
HT-29 cells were exposed to 19,20-epoxycytochalasin C and fixed for 1 h with glutaraldehyde solution (2.5% glutaraldehyde in 0.1 M phosphate buffer (pH 7.4) at room temperature) and then incubated at 4 °C overnight. Subsequently, the glutaraldehyde solution was extracted and the cells were washed with PBS. After complete dehydration via a gradient ethanol series, samples were suspended in 100% ethanol. The suspended sample was placed onto a Nanopercolator (JEOL Ltd., Tokyo, Japan) and dried up. The dried sample was coated with a platinum layer using an MSP-1S sputter coater (Shinku Device, Ibaraki, Japan) and investigated as well as photographed using a Phenom ProX desktop scanning electron microscope (Phenom-World BV, Eindhoven, The Netherlands).
Molecular Docking Analysis
Molecular docking of CDK2 with the identified molecules was carried out to investigate possible interactions and underlying binding efficiency. All docking procedures were performed using induced-fit docking procedures implemented in Maestro v10.3. The protein and its coordinates were procured from the Protein Data Bank (PDB ID: 4KD1). The bound ligand, i.e., Dinaciclib, to the crystal structure was used as the centroid for all docking calculations. Initially, the raw protein structure was prepared using the standard protocol provided by Schrodinger LLC, which consisted of three steps: preprocessing, optimization, and minimization. Before utilizing the prepared crystal structure for docking and simulation purposes, retrospective validation was performed by docking Dinaciclib to the binding site and superimposing two ligands. Further, ligands were sketched and prepared using Ligprep and all docking procedures were carried out using an extra precision (XP) model (Table S3 and Figure S24).
Molecular Dynamics Simulation
A 100 ns molecular dynamics simulation was performed for each complex, i.e., CDK2 with Dinaciclib and CDK2 with 19,20-epoxycytochalasin C. All simulations were carried out using Desmond, provided by the D.E. Shaw research group. The hierarchical steps suggested by the developers were used for simulations, which consisted of three steps: (i) system building, (ii) minimization, and (iii) molecular dynamics simulations. For setting up the initial system, the SPC (simple point charge) solvent water model was used with appropriate counterions. After system setup, minimization steps comprising hybrid utility of the steepest descent method and the LBGFS algorithm were carried out. Subsequently, individual simulations were carried out using the NVT ensemble at 300 K temperature and 1 bar pressure (Figure S24).
CDK2/Cyclin A2 Kinase Assay
The CDK2 kinase activity of 19,20-epoxycytochalasin C was estimated by the ADP-Glo kinase assay (Promega Corporation). It produces luminescent signals, corresponding to the adenosine triphosphate (ADP) concentration triggered by the kinase reaction. Dose–response curves were assessed in triplicate using various dilutions of the compound. The assay was executed in white 96-well plates taking both the reaction mixture (kinase reaction in the presence of a substrate) and blank control (kinase reaction in the absence of the substrate) for examination. 19,20-Epoxycytochalasin C (5 μL of each dilution), tyrosine kinase buffer-diluted enzyme (10 μL), and substrate-ATP (10 μL) were moved to a white 96-well microtiter plate (Costar # 3912, Corning, NY) and incubated for 60 min at ambient temperature. CDK2 kinase (25 ng), ATP (500 μM), and histone H1 (0.2 μg/μL) substrates were added to each well. In the blank, all components were present except the enzyme. To diminish the residual ATP, ADP-Glo reagent (25 μL) was added, the plate was once again kept for 40 min at ambient temperature, and 50 μL of kinase detection reagent was added to each well. The ADP produced (nM) in the presence and absence of the substrate was detected after 30 min through luminescent signals by a BioTek Synergy Mx microplate reader. The percent (%) enzyme inhibition was evaluated by subtracting the luminescent values obtained from the blank from all other reaction values. Then, each reaction luminescent value was divided by the 0 μM inhibitor reaction and multiplied 100 times to calculate the % enzyme activity.
To calculate the IC50, Prism, version 5.0, from GraphPad Software (La Jolla, CA), was used.
 |
Cell Cycle Analysis
After incubation with 19,20-epoxycytochalasin C at indicated concentrations of 162.5, 325, 650, and 1300 nM for 48 h, HT-29 human colon cancer cells (1 × 10⁵cells/2 mL/well) were collected, washed two times with PBS, and fixed overnight with 70% cold ethanol. After 24 h, cells were again washed with PBS, put through RNase digestion (0.1 mg/mL) at 37 °C for 90 min (Sigma-Aldrich, St. Louis, MO), and finally probed with propidium iodide (10 mg/mL). Cells were instantaneously analyzed on a FACS Calibur flow cytometer (Becton Dickinson, Franklin Lakes, NJ). The results were processed by Mod fit (Verity Software House Inc., Topsham).
In Vivo
To evaluate the in vivo efficacy of 19,20-epoxycytochalasin C, a carcinogen-induced colon cancer model was developed. The experiment was performed according to the institutional animal ethics committee guidelines with prior approval (no. IAEC 72/127/2/18). Briefly, female BALB/c (4–6 weeks) weighing 20–22 g were taken randomly. Azoxymethane (1 mg/mL) was given intraperitoneally (ip), and after that, 3% dextran sodium sulfate (DSS) was given in drinking water (three times after a gap of 16 days). Animals were euthanized at several stages to monitor the tumor progression (Figure S27). After tumor development, the animals were treated with 19,20-epoxycytochalasin C for 30 days and tissue samples were analyzed for histopathological studies (Figure 5).
Figure 5.
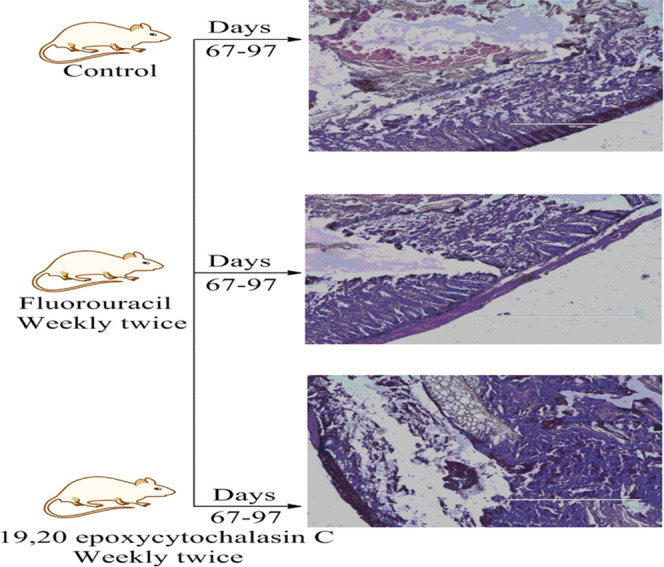
Cross examination of the sections of the colon of BALB/c mice exposed to AOM and stained with H&E. The control group received 0.9% normal saline, the positive control received 5-Fluorouracil (20 mg/kg, ip), and the test group received 19,20-epoxycytochalasin C (1 mg/kg, ip).
Statistical Analysis
The results indicted values from three independent experiments with the data expressed as means ± standard deviation (SD). The control and treatment groups were evaluated using the Student’s t-test by GraphPad PRISM 5.0 software. A p-value: non-significant (ns, P > 0.05), *(P ≤ 0.05), **(P ≤ 0.01), ***(P ≤ 0.001), ****(P ≤ 0.0001), was considered statistically significant.
Results and Discussion
The fungus Rosellinia sanctae-cruciana (MRCJ-173) used in this study was obtained from Col. Sir R.N. Chopra Microbial Resource Centre at CSIR-IIIM, Jammu, India. The fungal endophyte Rosellinia sanctae-cruciana was subjected for identification and isolation of various cytochalsins.13 The crude extract thus obtained was reconstituted in methanol, and a suitable HPLC method was developed for recording MS and UV (PDA) spectra (Figure S1). We applied the LC–MS/MS-based dereplication strategy for the identification of the chemical compounds from the crude extract. The LC–MS study showed major ionized compounds showing the mass range 500–600 Da, especially m/z 508.26 and m/z 524.26 occurring frequently between tR 20 and 35 min. We performed the online database search (DNP). For further confirmation of cytochalasins, we generate the formula of given peaks according to DNP; the mass accuracy was between −7 and +0.3 ppm (Figures S2–S10). So, it is clear that the crude contains the cytochalasins well known for their pronounced activity on a diverse panel of cancer cell lines. Subsequently, the LC-PDA-MS data support the HPLC-guided isolation of cytochalasins from the crude extract, and we successfully isolated seven cytochalasins (19,20-epoxycytochalasin N, 19,20-epoxycytochalasin C, cytochalasin C, cytochalasin D, 19,20-epoxycytochalasin D, deacetyl 19,20-epoxycytochalasin C, and cytochalasin P1) from the crude extract and completely characterized by NMR (Figures S1–S9). During tandem MS profiling, the peaks at m/z 91 [M + H]+ (tropylium ion species [C7H7] + of the benzyl unit), m/z 120 (C8H10N+) of the phenylalanine moiety, and m/z 105 (C8H9) were observed as the most common ions, which also confirm the presence of phenylalanine amino acid of cytochalasin (Figure S2).
In Vitro Effect of Cytochalasins on a Diverse Group of Human Cancer Cell Lines
We determined the effect of various analogues of 19,20-epoxycytochalasin C on cancer cell proliferation by performing the SRB assay in different human cancer cell lines (A-549, PC-3, HCT-116, HT-29, SW-620, and MCF-7). The effect of 19,20-epoxycytochalasin C was determined for a panel of human cancer cell lines, in which cells were treated with specified concentrations of 19,20-epoxycytochalasin C (0.25, 0.5, 1, 2.5, 5, 7.5, and 10 μM) for 48 h. As shown in Table 1, cell proliferation in HT-29 cells was markedly reduced by 50–80% with 19,20-epoxycytochalasin C treatment as compared to control. Furthermore, significant dose-dependent decreases in cell proliferation of A-549, HCT-116, MCF-7, and SW-620 were observed, whereas in normal breast epithelial cells, FR-2, no detrimental decrease in cell viability was observed and proved to be more selective (Table S4). This inferred the special efficacy of 19,20-epoxycytochalasin C for targeted therapy for colon cancer. From all of the seven cytochalasins, 19,20-epoxycytochalasin C showed the most efficacious activity on all of the cancer cell lines. Further investigation of 19,20-epoxycytochalasin C was done through LC–MS profiling (Tables 1 and S4).
Table 1. Cytotoxicity Profiling of Isolated Cytochalasinsa.

Note: FR-2 (normal breast epithelial cells); A-549 (lung cancer cells); SW-620, HT-29, and HCT-116 (colon cancer cells); and PC-3 (prostate cancer cells).
Visual Inspection of TIC (Treated with 19,20-Epoxycytochalasins)
We performed LC–MS/MS analysis profiling of the crude extract obtained from cell lines treated with 19,20-epoxycytochalasin C. In the visual inspection of the total ion chromatogram (TIC), we observed that the peak at m/z 522.2 [M + H]+ appeared at tR = 20.5 (≈1% of the area of m/z 524.25) during LC–MS/MS profiling of six cancer cell line extracts. One new metabolite was speculated to be oxidized 19,20-epoxycytochalasin C with a molecular formula of C30H35NO7, observed 522.2486 [M + H]+ calculated 522.2486 [M + H]+, which is 2 Da less than the parent ion (Figures 1, S20, and S21).
Figure 1.
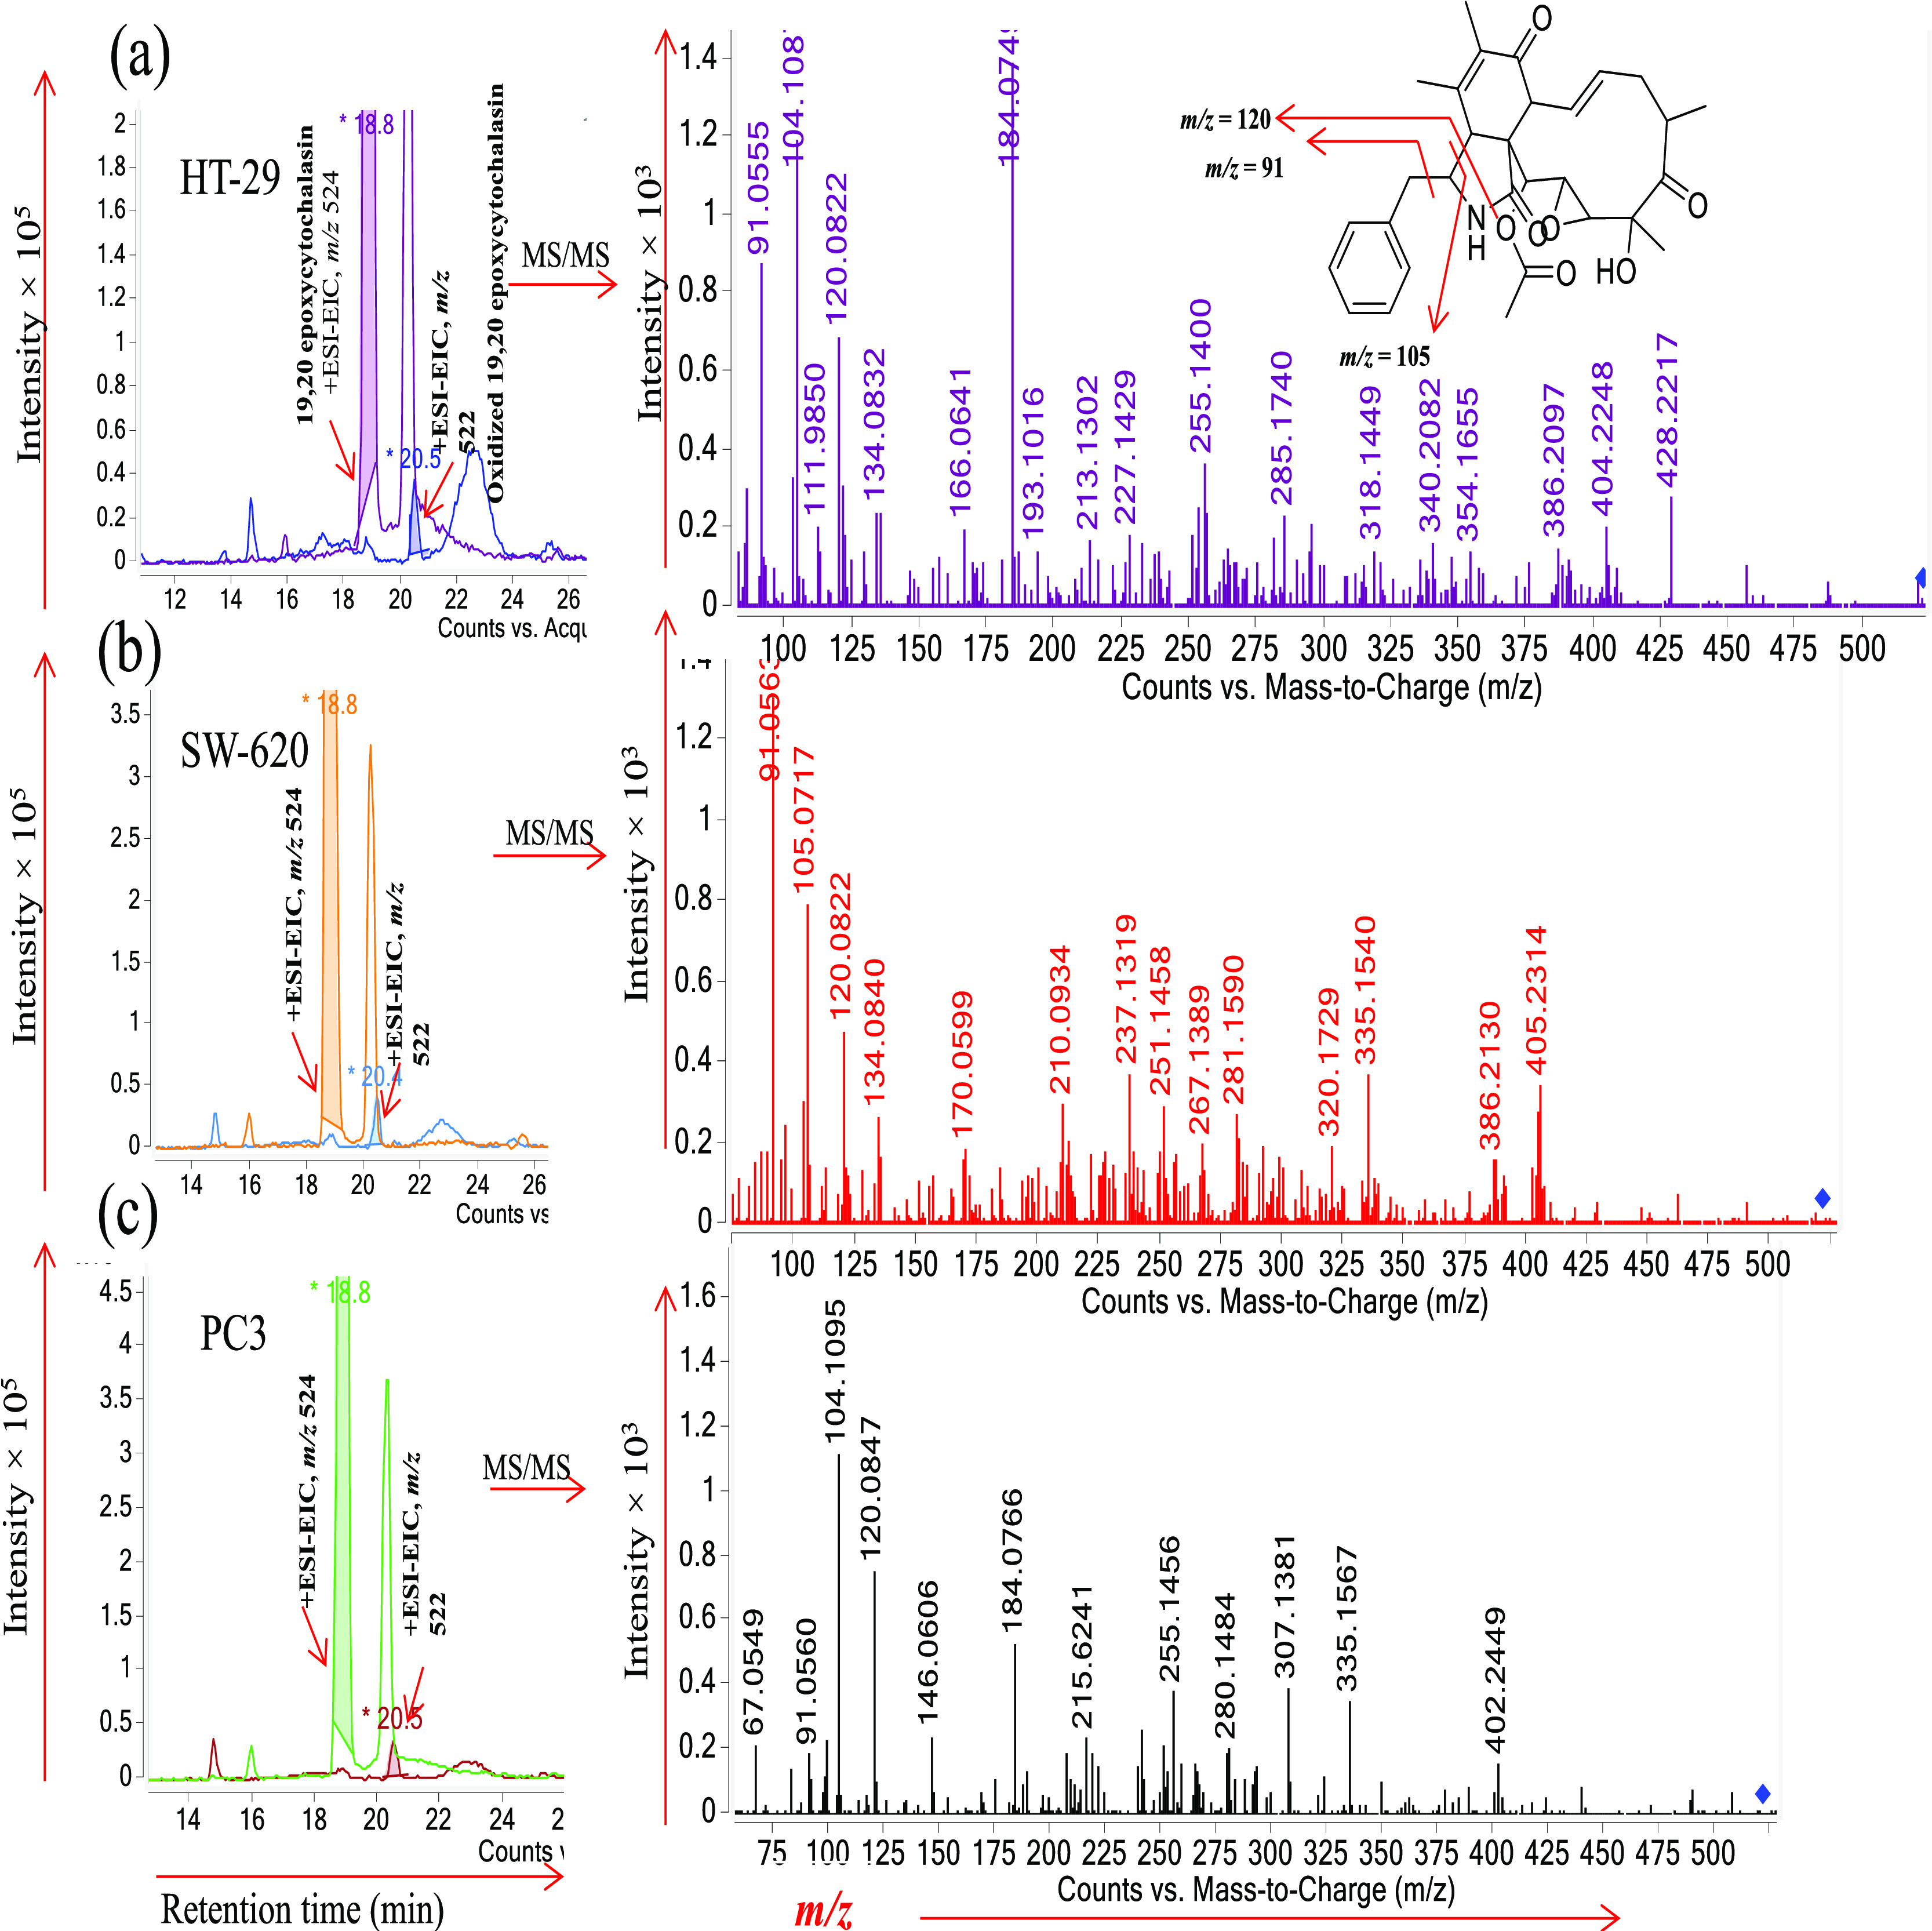
LC–ESI–MS/MS profiles and tandem MS spectra of different cell line extracts: (a) HT-29, (b) SW-620, and (c) PC-3 peak at m/z 524 eluted at tR = 18.8 min, corresponding to 19,20-epoxycytochalasin C; peak at m/z 522 eluted at tR = 18.8 min, corresponding to oxidized 19,20-epoxycytochalasin C. The tandem MS spectra of m/z 522 give a common daughter ion at m/z 91.0 and 120.08 as 19,20-epoxycytochalasin C. The common daughter ion and the loss of 2H confirm the oxidation in 19,20-epoxycytochalasin C (Figure S2).
For further confirmation of structural similarity in the parent and oxidized molecules, we have oxidized 19,20-epoxycytochalasin C with the Dess–Martin reagent and purified by a C18 HPLC column using a water–acetonitrile gradient (Figure S10). HRESIMS of Dess–Martin-oxidized 19,20-epoxycytochalasin C gave a molecular formula for m/z 522.29, C30H35NO7 (Figures 2, S20, and S21). The 1H NMR spectrum of oxidized 19,20-epoxycytochalasin suggested proton signal similarities to the known 19,20-epoxycytochalasin C (Figure S11). Interpretation of 1H, 13C, HSQC, and HMBC NMR data (Figures S11–S19 and Table S1) indicated the presence of four carboxylic acid groups (δC 170.06, 173.89, 198.98, 215.05 ppm). The peak at δC 198.98 suggests the oxidation at C7. The full structure was assigned by the interpretation of 1D and 2D NMR data, in particular, COSY (Figure S19) and HMBC correlations (Figures S11–S19), The HMBC correlations from H12 (δH = 1.5 ppm, 3H) and H8 (δH = 3.2 ppm, 1H) to C7 (δC = 198.98) suggest the hydroxyl group converts into the keto group at the C7 position (Figures S11–S19 and Table S1). The confirmation of retention time-based analysis confirmed that the cell-based metabolites and chemically oxidized metabolites are structurally similar (Figure 2).
Figure 2.
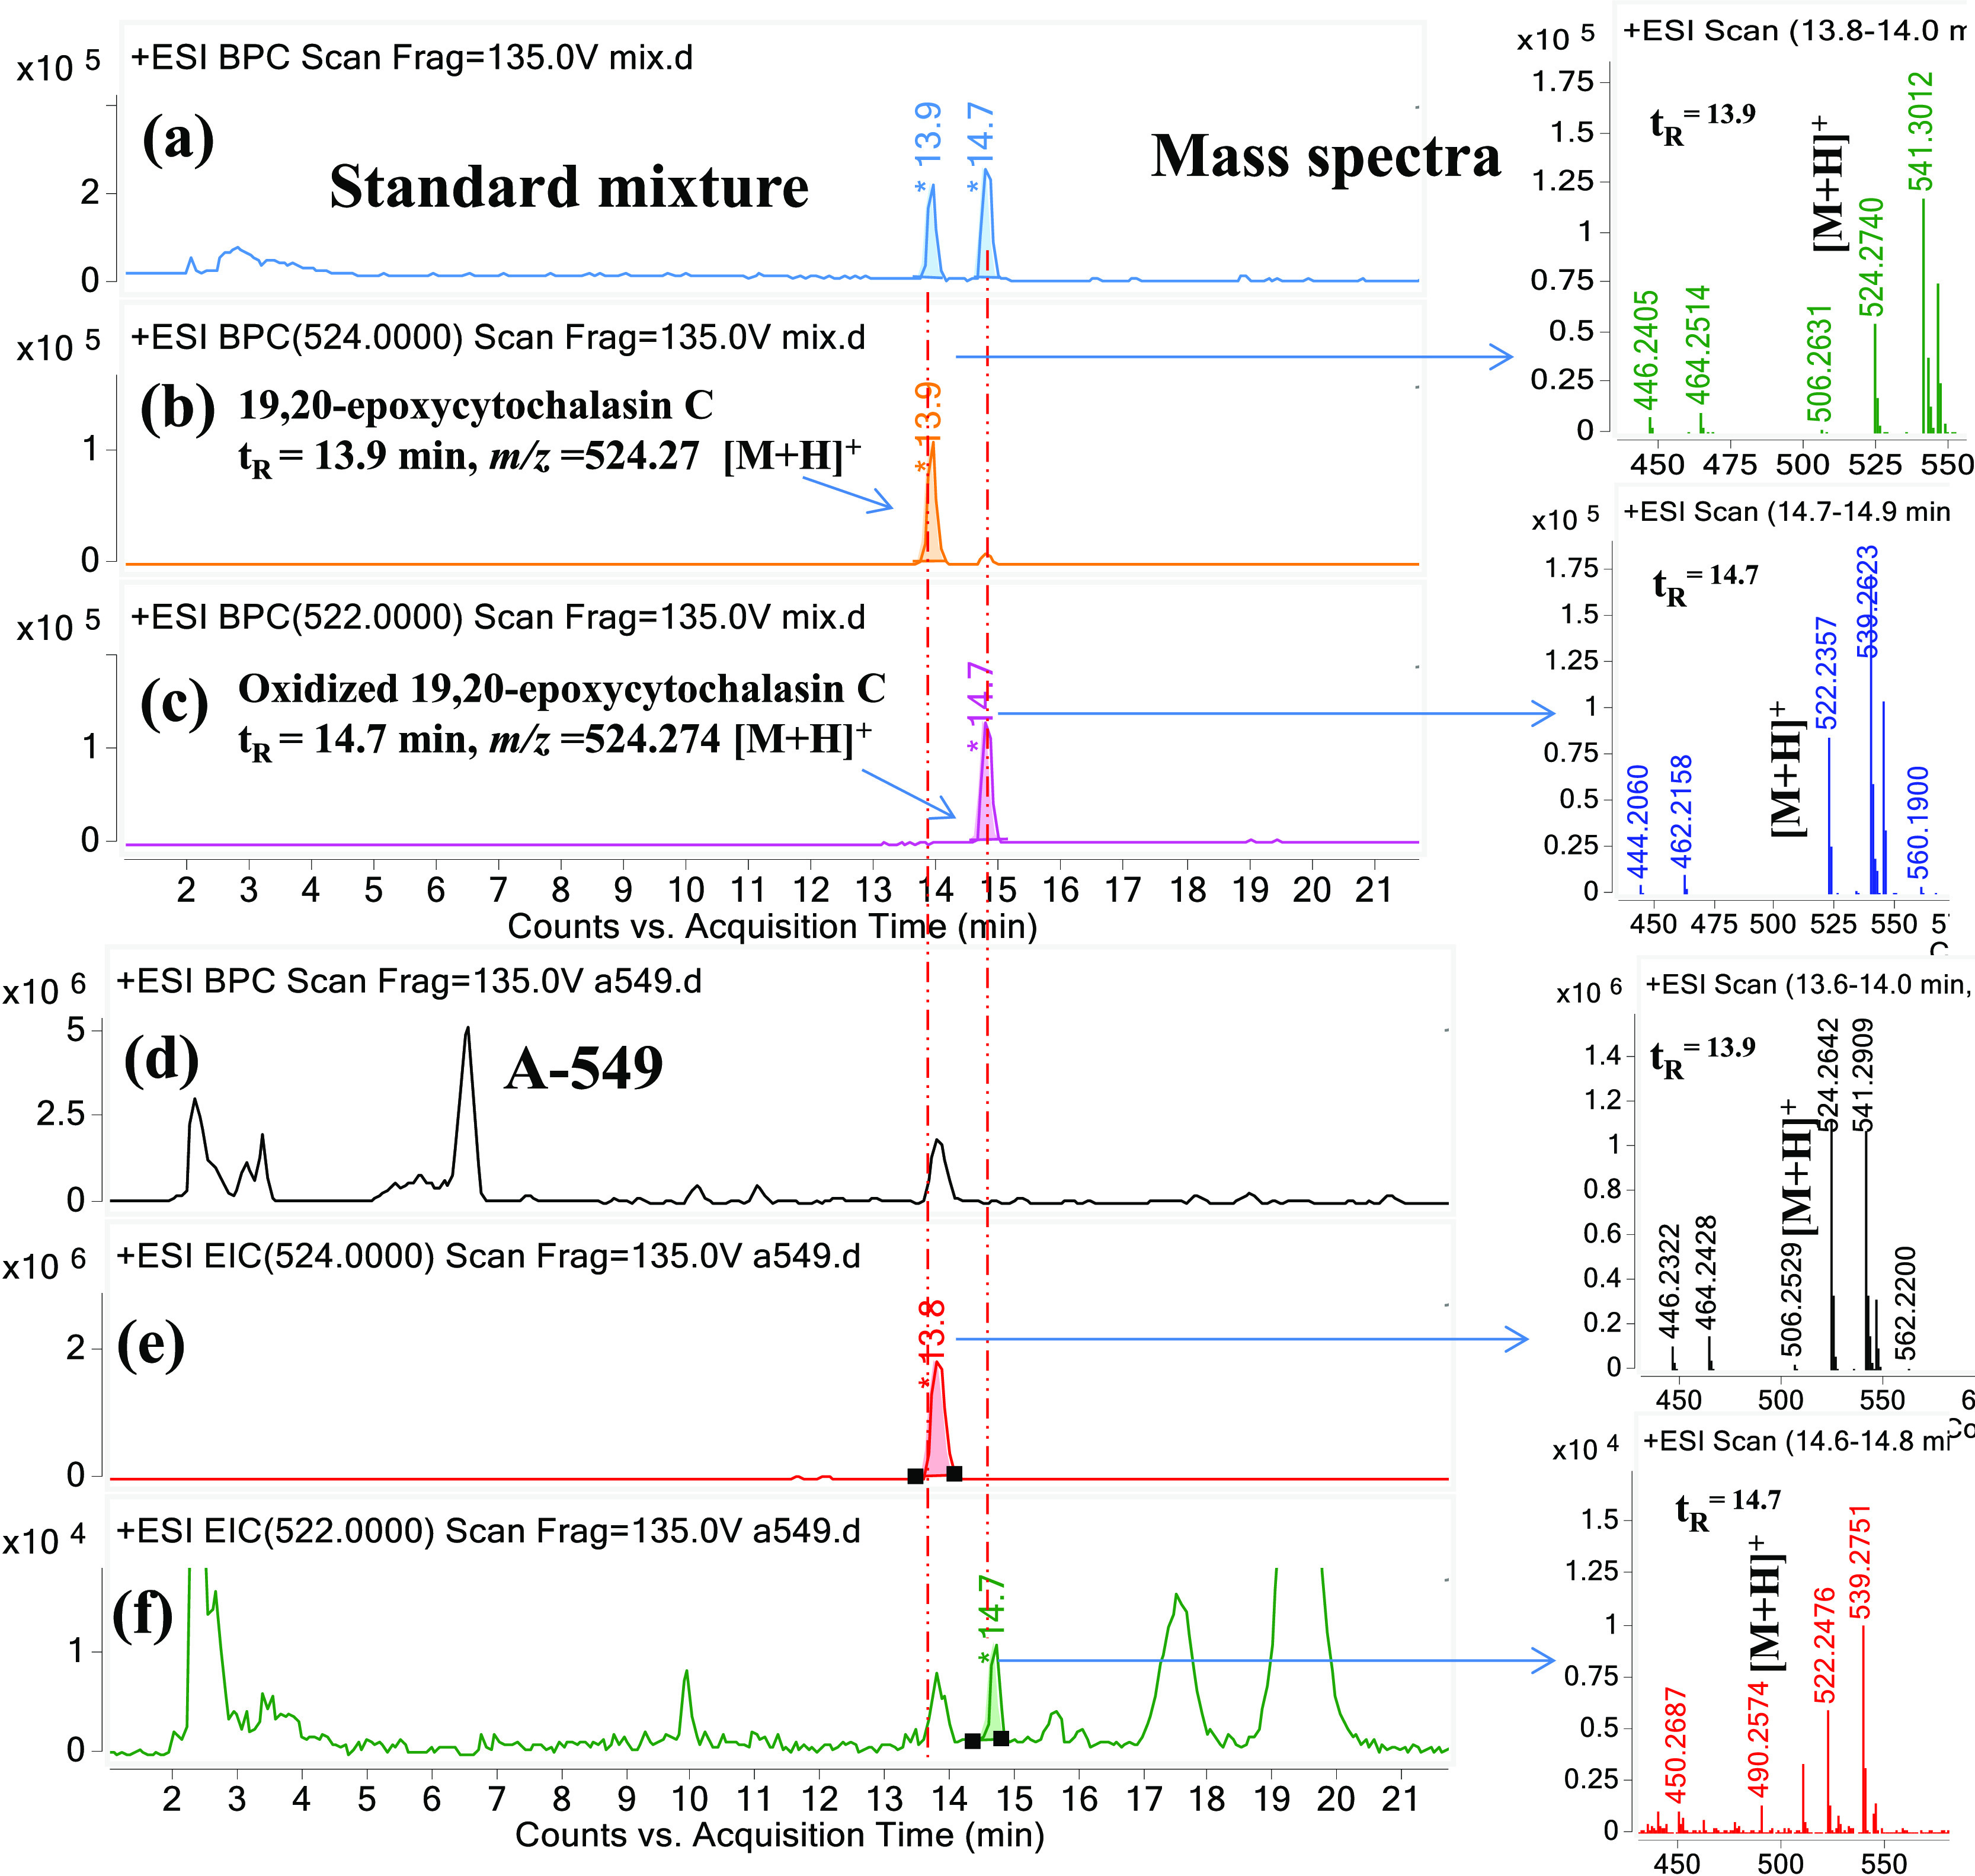
LC–MS chromatograms and mass spectra: (a) +ESI-base peak chromatogram of the standard mixture, (b) +EIC of m/z 524.25, 19,20-epoxycytochalasin C of the standard mixture, (c) +EIC of m/z 522.25, oxidized 19,20-epoxycytochalasin C of the standard mixture, (d) +ESI-base peak chromatogram (A-549 cell line), (e) +EIC of m/z 524.25, 19,20-epoxycytochalasin C (A-549 cell line), and (f) +EIC of m/z 522.25 oxidized 19,20-epoxycytochalasin C (A-549 cell line). Note: The chemically oxidized 19,20-eopxycytochalasin C eluted at tR = 14.7 min and in the chromatogram of A-549 the peak at m/z 522.25 oxidized 19,20-epoxycytochalasin C also eluted at tR = 14.7 min, the chromatographic separation and the common daughter ion is a confirmation of structural similarity (Figure S2). The chemical structure of 19,20-epoxycytochalasin C and oxidized 19,20-epoxycytochalasin C elucidated by NMR (Figures S11–S19).
Biological Activity
Different cytochalasin congeners altered actin filaments and therefore were reported to affect several other biological activities inclusive of cell motility, adherence, secretion, drug efflux, deformability, and morphology.4,11,13,18
Activity of Dess–Martin-Oxidized 19,20-Epoxycytochalasin C
The oxidized compound was further tested on different panels of cancer cell lines and found to be inactive in comparison to the parent molecule; it is previously reported the OH group at the C7 position and epoxy groups at 19 and 20 positions were very essential for the activity of cytochalasins. In the oxidized compound, the −OH group of the C7 position converted into the keto group by the process of oxidation and this is the main cause of inactivity.19
19,20-Epoxycytochalasin C Alters Phenotypic Characteristics of HT-29 Colon Cancer Cells
We assessed the effect of 19,20-epoxycytochalasin C in HT-29 (colorectal cancer cell) morphology and its cytoskeleton organization. As depicted in Figure 2, for HT-29, untreated control has uniformly dispersed cell colonies with altogether epithelial cell morphology and adjacent cell-to-cell adherence. On the contrary, cells with 19,20-epoxycytochalasin C led to rounding of the cells with prominent fimbriae structures, and degeneracy of the epithelial cell aggregates with clear remnants of adhesion molecules was seen. Furthermore, the remnants of adhesive contacts and many disengaged cells were observed.
19,20-Epoxycytochalasin C Induces Cell Cycle Arrest and Caspase-3/7-Mediated Apoptosis in HT-29 Colon Cancer Cells
19,20-Epoxycytochalasin C induced a dose-dependent S cell cycle phase arrest after 48 h of exposure in HT-29 cells. Thus, to inquire whether phase arrest akin to the caspase-3/7-controlled pathway ultimately led to apoptosis, cells (HT-29) were preincubated with 19,20-epoxycytochalasin C and pan caspase inhibitor (Z-Vad-FMK). We found that 19,20-epoxycytochalasin C brings about the activation and cleavage of caspase-3 through membrane translocation of phosphatidyl-serine as compared to the pan caspase inhibitor (Figure S22). On the contrary, the pan caspase inhibitor did not prevent 19,20-epoxycytochalasin C-induced S phase cell cycle arrest. These results specify that 19,20-epoxycytochalasin C affects the signaling pathways in HT-29 cells, notably to cell cycle arrest and apoptosis (Figure S28).
SEM Analysis of Spheres from HT-29 Cells
Morphological changes to cells following exposure to 19,20-epoxycytochalasin C (650 nM) treatment for 48 h were visualized under high-magnification SEM and showed that HT-29 cells exhibited an elliptical to clublike appearance. In 19,20-epoxycytochalasin C-treated HT-29 cells, the surface was smooth, irregular, and fused with intrusion periphery featuring apoptotic blebs with shrinkage as compared to microvilli containing rough surface in control HT-29 cells (Figure 3).
Figure 3.

Imaging of platinum-coated HT-29 cells: (A) control HT-29 cells, (B) HT-29 cells treated with 50 nM paclitaxel, (C) HT-29 cells treated with 650 nM of 19,20-epoxycytochalasin C, (D) HT-29 cells treated with 1.3 μM 19,20-epoxycytochalasin C, and (E) HT-29 cells treated with 3 μM 19,20-epoxycytochalasin C. (HT-29 cells were fixed for 1 h with 2.5% glutaraldehyde in 0.1 M phosphate buffer (pH 7.4) at RT and then incubated at 4 °C overnight). Subsequently, the glutaraldehyde solution was extracted and the cells were washed with PBS. After complete dehydration via a gradient ethanol series, samples were suspended in 100% ethanol, placed onto a Nanopercolator (JEOL Ltd., Tokyo, Japan), dried up, then coated with a platinum layer using an MSP-1S sputter coater (Shinku Device, Ibaraki, Japan), and investigated as well as photographed using a Phenom ProX desktop scanning electron microscope (Phenom-World BV, Eindhoven, The Netherlands).
In Silico
Molecular dynamics simulations were executed for a timescale of 100 ns for either of the complexes. Simulation quality analysis for both the complexes exhibited stable ensemble characteristics, i.e., pressure, temperature, volume, and potential energy. Root-mean-square deviations (RMSD) analysis of the Cα atoms of the backbone was accomplished for both the complexes with regard to the initial frame to indicate the stability of protein–ligand complexes bound in the kinase domain. Stable trajectories were discovered for both the complexes, i.e., Dinaciclib and 19,20-epoxycytochalasin C, and it converged at 2.0 and 3.5 Å, as revealed in Table S3 and Figure S24, respectively. Root-mean-square fluctuation (RMSF) analysis for side chains of the complexes displayed fluctuations of higher intensity for periphery atoms (Table S3 and Figure S24). The ligand-binding domain evidenced lesser fluctuations, asserting the coherent classification of ligands in the dynamic state.
The residue interaction pattern was explored to elucidate the role, nature, and extent in constructing ligand-binding energetics. The occupancy map of various interacting residues is represented in Figure S24. Previous reports on the CDK2-binding cavity suggests that it consists of the following hydrophobic residues, i.e., Ile 10, Val18, Ala31, Val64, Phe80, Phe82, Leu83, Leu134, and Ala144; polar residues Thr14, His84, Gln85, and Gln131; negatively charged Glu51, Glu81, Asp86, and Asp145; positively charged Lys33, Lys89, Gly11, and Gly13. As for the Dinaciclib–CDK2 complex, Leu83 and Lys33 formed crucial hydrogen bonding for stability. For the 19,20-epoxycytochalasin C–CDK2 complex, the stability was achieved through positively charged residues and polar residues in the binding cavity, i.e., Gly13 and Thr14. Ionic interactions with Lys129 and Arg150 for 19,20-epoxycytochalasin C show a distinguishing feature, which was not observed in the Dinaciclib complex. Furthermore, interaction pattern analysis suggests that while Dinaciclib complex interaction is driven by hydrogen bonding and hydrophobic contacts, interactions and stability of investigatory molecule 19,20-epoxycytochalasin C are directed by hydrogen bonding, ionic interaction, and water-mediated hydrogen bonding. Hydrophobic interactivity was not observed in 19,20-epoxycytochalasin C (Figure S24 and Table S2).
In Vitro CDK2 Kinase Activity
Various cytochalasin analogues were then screened for in vitro CDK2 kinase activity. 19,20-Epoxycytochalasin C had promising activity against CDK2 and showed 39, 66, and 88% inhibition at various specified concentrations. In contrast, other analogues that were screened at a concentration of 1 μM had shown less selectivity for the CDK2 kinase domain, displaying a nonselective interaction. Ensuing dose–response analysis for 19,20-epoxycytochalasin C on CDK2 gave an IC50 of ≈0.9 μM, which resulted in an apparent 690-fold selectivity for 19,20-epoxycytochalasin C over CDK2 in vitro. At higher concentrations, 19,20-epoxycytochalasin C treatment resulted in no significant shift in the activity of CDK2 due to the extent of saturation of the inhibitor at higher concentrations or maybe due to a fast precipitation rate during the assay time period. Altogether, these data suggested that 19,20-epoxycytochalasin C is a selective CDK2 inhibitor with a promising safety profile (Figure 4 and Table S3).
Figure 4.

19,20-Epoxycytochalasin C dose–responses curve against 25 ng of CDK2/cyclin A2 to determine its inhibitory potency (19,20-epoxycytochalasin C, IC50 = 866 ± 0.176 nM; Flavopiridol as a positive control, IC50 = 290 ± 0.035 nM).
In Vivo
Animals were divided into different groups, the control group was given 0.9% normal saline, the positive control received 5-FU (20 mg/kg, ip), and the treated group received 1 mg/kg ip of 19,20-epoxycytochalasin C alternatively. After 30 days of treatment, animals were sacrificed by cervical dislocation and the large bowel was removed, rinsed with PBS, and fixed in 10% formalin for histopathological analysis. Tissue samples in paraffin wax were cut into 5 μm thick longitudinal sections using a microtome (Shandon 325 Manual Microtome, Thermo Fisher). The sections were then stained with hematoxylin and eosin (H&E) dye for histological examination. Tissue sections were observed under a light microscope (original magnification 400×). Histopathological examination of control group samples represented the classical pathological features of colorectal carcinomas, which were evident by moderately differentiated and intricate glandular structures. Sections were also characterized by interspersed necrotic debris within the luminal regions. Treated animals revealed a remarkable therapeutic outcome in terms of the reduced glandular formation along with well-formed cellular integrity. The overall bodyweight of the animals reduced gradually, and the survival rate of the animals also increased (Figures 5 and S27).
Quantification of 19,20-Epoxycytochalasin C in the Liver
A selective and sensitive liquid chromatography with mass spectrometry method was developed and validated for accurate determination of 19,20-epoxycytochalasin C in BALB/c mice liver. A liver homogenate was prepared in 10 mL of methanol and extracted thrice with 10 mL of methanol; the centrifuged liver homogenate supernatant was dried under vacuum. The dried sample was reconstituted in 1 mL of methanol, and 10 μL was used for MS analysis. The sample was injected into a C18 analytical column with 15 min of run time at a flow rate of 0.5 mL/min. The detection was performed on an Agilent 1290 HPLC series equipped with a Agilent 6410B Triple Quadrupole mass spectrometer. The selected ion monitoring of m/z 524.2 [M + H]+ for 19,20-epoxycytochalasin C was used for detection and quantification purposes. The calibration curves for plasma and tissue samples were linear over the range of 10–10 000 ng/mL with a lower limit of quantification of 30 ng/mL. The method was successfully applied for the quantification study of 19,20-epoxycytochalasin C in the mice liver. In the liver, a total of 18.50 μg of 19,20-epoxycytochalasin C was recovered (Figures S25 and S26).
Discussion
In this study, the use of high-resolution electrospray tandem mass spectrometry allowed the identification of cytochalasin in fungal crude extracts. By combining the full MS scan mode, target MS/MS scan, precursor ion scan on LC–MS QqQ, structure search in DNP, and auto MS/MS data, we apply this strategy to different isolated cytochalasins, from which seven cytochalasins were successfully characterized by NMR (Figures S1–S9). Seven pure cytochalasins were tested on six cancer cell lines, among which the HT-29 colon cancer cell line showed the most potent activity (Table 1). Because of different activities on all of the treated six cancer cell lines, we assume that some biotransformation may occur in the molecule. For further accuracy, we performed LC–MS/MS profiling of the crude obtained from 19,20-epoxycytochalasin C-treated cell lines. We have found a peak at m/z 524.24 [M + H] + corresponding to 19,20-epoxycytochalasin C and a peak at m/z 522.24 [M + H]+, which is 2 Da less than the m/z value of 19,20-epoxycytochalasin C. It is confirmed that oxidation occurred in 19,20-epoxycytochalasin C (Figures 1, 2, and S16). Subsequently, the oxidized metabolite was chemically obtained so as to compare and find the structural correlation between biotransformed metabolite and chemically oxidized compound. During chromatographic separation, chemically oxidized 19,20-epoxycytochalasin C and cell metabolites eluted at the same retention time, indicating that both compounds have structural similarity (Figure 2). Cytotoxicity profiling and cell cycle analysis were performed for the 19,20-epoxycytochalasin C-treated HT-29 cell line, and S phase arrest was found (Figure S28). It was well proved that the alteration in cyclin-dependent kinase (CDK) activity is mainly associated with cell cycle defects; the misregulated CDKs were mainly responsible for unscheduled proliferation as well as chromosomal instability.20−24 For investigating the role of cytochalsins, we probed their activity in cancer as well as normal cells. With an emphasis on phenotypic challenges by relying on the CDK2 kinase assays results supported our hypothesis and discovered the lead agent, 19,20-epoxycytochalasin C, represented a potent CDK2 inhibitor was assessed by using a combination of targeted techniques (Tables S3 and S4). On the basis of evaluated in vitro toxicity, 19,20-epoxycytochalasin C on CDK2 facilitated restriction to the S phase by halting CDK2 in cancer cells. So, 19,20-epoxycytochalasin C interactions with CDK2 demonstrated a novel, nonredundant requirement for CDK2 in the G1/S checkpoint pathway that remains intact in cancer cells. Cytochalasin B is already known for CDK1 inhibition.18 It was well proved that the alteration in cyclin-dependent kinase (CDK) activity is mainly associated with cell cycle defects; the misregulated CDKs were mainly responsible for unscheduled proliferation as well as chromosomal instability.20−24 Moreover, from conducted in silico molecular modeling studies, cytotoxicity and cell cycle analysis results encouraged us to perform the CDK2 kinase assay (Figure 4, Table S3, and Figure S28). The crystal structure of the kinase domain of the CDK2 complex (PDB ID: 4KD1) with 19,20-epoxycytochalasin C was chosen as the cited structure of the receptor. To establish the best docking parameters, seven isolated cytochalasin active compounds that have been cocrystallized with CDK2 were docked back to the active site of CDK2. The calculated values of binding affinities and root-mean-square deviations (RMSDs) between the docked active compounds and the crystallized structures in CDK2 are shown in Table S3. By scanning electron microscopy, we analyzed the effect of 19,20-epoxycytochalasin C at relatively various doses on tubulin polymerization. The results suggested that 19,20-epoxycytochalasin C interacted with tubulin so that the filament elongation and network formation were restricted. Interestingly, 19,20-epoxycytochalasin C appeared to have remarkable in vitro cytotoxicity against the cell lines selected for metastatic propensity than that against the normal cell line (Figure 3). After this evaluation, the in vitro efficacy of 19,20-epoxycytochalasin C on an azoxymethane-induced colon cancer model was determined. After tumor development, the animals were treated with 19,20-epoxycytochalasin C for 30 days and tissue samples were analyzed for histopathological studies.19 As we have given clear proof that a specific 19,20-epoxycytochalasin C restrained azoxymethane-instigated colonic preneoplastic injuries and adenocarcinomas in female BALB/c mice. The inhibitory potential of 19,20-epoxycytochalasin C in this investigation is similar to that of a potential colon malignant growth chemopreventive operator, i.e., 5-FU. Dose determinations of 19,20-epoxycytochalasin C for tumor adequacy contemplates depend on a 30 day examination. In this investigation, no significant impact of 19,20-epoxycytochalasin C on the bodyweight was seen without any adverse side effects as compared to the control group. The results suggested that the magnitude of the effects is independent of the cell types used in the screening experiment. The effective interaction between the molecular and cellular levels strongly proposed that cytochalasin efficacy was determined by its potentiality to affect microtubule integration in vitro.
Moreover, LC–MS/MS-based profiling of the cancer cell metabolite suggests that the loss of 2H in 19,20-epoxycytochalasin leads to its inactivity. We provide an overview of the state-of-the-art LC–MS/MS fast experiments for investigating the 19,20-epoxycytochalasin C metabolism within the cancer cells. We highlight the wide-area LC–MS/MS-based dereplication strategies for the analysis of drug metabolism.25 This article will definitely help in the role of drug metabolism in drug discovery and development. The molecular mechanism of the action of 19,20-epoxycytochalasin C leads to the inhibition of CDK2 as the target protein. In addition to our in vitro work, in vivo data has been obtained to establish anticancer activity in a preclinical tumor model but the limited availability of this agent precludes its initial use in large-scale mammalian preclinical studies. Therefore, the prospective study sought to determine the tolerated in vivo doses of 19,20-epoxycytochalasin C in mice, which have extensively characterized the in vivo activity of 19,20-epoxycytochalasin C against solid tumors of murine origin. Noticeably, 19,20-epoxycytochalasin C significantly improved the lifespan of mice challenged with colon carcinoma and proved to effective for targeting colon cancer therapeutics.
Acknowledgments
S.J. gratefully acknowledges the Department of Science Technology (DST), Govt. of India for financial assistance under Grant No. ECR/2017/001381. Authors Manoj and Arem are also grateful to the CSIR for providing the fellowship (SRF). We acknowledge PR Sharma and Er. Rajneesh Anand for their analytical and technical support.
Supporting Information Available
The Supporting Information is available free of charge at https://pubs.acs.org/doi/10.1021/acsomega.0c05307.
Analytical, spectroscopic, and cell cycle analysis data (PDF)
Author Contributions
◆ M.K. and A.Q. contributed equally to this work.
The authors declare no competing financial interest.
Supplementary Material
References
- Luo Y.-F.; Zhang M.; Dai J.-G.; Pedpradab P.; Wang W.-J.; Wu J. Cytochalasins from mangrove endophytic fungi Phomopsis spp. xy21 and xy22. Phytochem. Lett. 2016, 17, 162–166. 10.1016/j.phytol.2016.07.027. [DOI] [Google Scholar]
- Aldridge D. C.; Armstrong J. J.; Speake R. N.; Turner W. B. The cytochalasins, a new class of biologically active mould metabolites. Chem. Commun. 1967, 26–27. 10.1039/c19670000026. [DOI] [Google Scholar]
- Scherlach K.; Boettger D.; Remme N.; Hertweck C. The chemistry and biology of cytochalasans. Nat. Prod. Rep. 2010, 27, 869–886. 10.1039/b903913a. [DOI] [PubMed] [Google Scholar]
- Carter S. B. Effects of cytochalasins on mammalian cells. Nature 1967, 213, 261–264. 10.1038/213261a0. [DOI] [PubMed] [Google Scholar]
- Zhang X.-Q.; Guan F.-F.; Li D.-B.; Wang C.-Y.; Shao C.-L. Preparation, Structure Elucidation, and Antiviral and Cytotoxic Activities of Acylation Derivatives of Cytochalasin B. Chem. Nat. Compd. 2017, 53, 109–113. 10.1007/s10600-017-1921-7. [DOI] [Google Scholar]
- Liu Y.; Ruan Q.; Jiang S.; Qu Y.; Chen J.; Zhao M.; Yang B.; Liu Y.; Zhao Z.; Cui H. Cytochalasins and polyketides from the fungus Diaporthe sp. GZU-1021 and their anti-inflammatory activity. Fitoterapia 2019, 137, 104187 10.1016/j.fitote.2019.104187. [DOI] [PubMed] [Google Scholar]
- Cunningham D.; Schafer D.; Tanenbaum S. W.; Flashner M. Physiological responses of bacteria to cytochalasin A: effects on growth, transport, and enzyme induction. J. Bacteriol. 1979, 137, 925–932. 10.1128/JB.137.2.925-932.1979. [DOI] [PMC free article] [PubMed] [Google Scholar]
- Brown S. S.; Spudich J. A. Mechanism of action of cytochalasin: evidence that it binds to actin filament ends. J. Cell Biol. 1981, 88, 487–491. 10.1083/jcb.88.3.487. [DOI] [PMC free article] [PubMed] [Google Scholar]
- Repasky E. A.; Eckert B. S. The effect of cytochalasin B on the enucleation of erythroid cells in vitro. Cell Tissue Res. 1981, 221, 85–91. 10.1007/BF00216572. [DOI] [PubMed] [Google Scholar]
- Trendowski M. Using cytochalasins to improve current chemotherapeutic approaches. Anti-Cancer Agents Med. Chem. 2015, 15, 327–335. 10.2174/1871520614666141016164335. [DOI] [PMC free article] [PubMed] [Google Scholar]
- Wodnicka M.; Pierzchalska M.; Bereiter-Hahn J.; Kajstura J. Comparative study on effects of cytochalasins B and D on F-actin content in different cell lines and different culture conditions. Folia Histochem. Cytobiol. 1992, 30, 107–111. [PubMed] [Google Scholar]
- Alvi K. A.; Nair B.; Pu H.; Ursino R.; Gallo C.; Mocek U. Phomacins: Three Novel Antitumor Cytochalasan Constituents Produced by a Phoma sp. J. Org. Chem. 1997, 62, 2148–2151. 10.1021/jo962321s. [DOI] [PubMed] [Google Scholar]
- Sharma N.; Kushwaha M.; Arora D.; Jain S.; Singamaneni V.; Sharma S.; Shankar R.; Bhushan S.; Gupta P.; Jaglan S. New cytochalasin from Rosellinia sanctae-cruciana, an endophytic fungus of Albizia lebbeck. J. Appl. Microbiol. 2018, 125, 111–120. 10.1111/jam.13764. [DOI] [PubMed] [Google Scholar]
- Prasain J. K.; Ueki M.; Stefanowicz P.; Osada H. Rapid screening and identification of cytochalasins by electrospray tandem mass spectrometry. J. Mass Spectrom. 2002, 37, 283–291. 10.1002/jms.282. [DOI] [PubMed] [Google Scholar]
- Amaral L. S.; Fill T. P.; Santos L. F. A.; Rodrigues-Filho E. Biosynthesis and mass spectral fragmentation pathways of (13)C and (15)N labeled cytochalasin D produced by Xylaria arbuscula. J. Mass Spectrom. 2017, 52, 239–247. 10.1002/jms.3922. [DOI] [PubMed] [Google Scholar]
- Abate D.; Abraham W.-R.; Meyer H. Cytochalasins and phytotoxins from the fungus Xylaria obovata. Phytochemistry 1997, 44, 1443–1448. 10.1016/S0031-9422(96)00780-7. [DOI] [Google Scholar]
- Chen Z.; Chen Y.; Huang H.; Yang H.; Zhang W.; Sun Y.; Wen J. Cytochalasin P1, a new cytochalasin from the marine-derived fungus Xylaria sp. SOF11. Z. Naturforsch., C 2017, 72, 129–132. 10.1515/znc-2016-0122. [DOI] [PubMed] [Google Scholar]
- Pockwinse S. M.; Krockmalnic G.; Doxsey S. J.; Nickerson J.; Lian J. B.; van Wijnen A. J.; Stein J. L.; Stein G. S.; Penman S. Cell cycle independent interaction of CDC2 with the centrosome, which is associated with the nuclear matrix-intermediate filament scaffold. Proc. Natl. Acad. Sci. U.S.A. 1997, 94, 3022–3027. 10.1073/pnas.94.7.3022. [DOI] [PMC free article] [PubMed] [Google Scholar]
- Berestetskiy A.; Dmitriev A.; Mitina G.; Lisker I.; Andolfi A.; Evidente A. Nonenolides and cytochalasins with phytotoxic activity against Cirsium arvense and Sonchus arvensis: A structure–activity relationships study. Phytochemistry 2008, 69, 953–960. 10.1016/j.phytochem.2007.11.003. [DOI] [PubMed] [Google Scholar]
- Malumbres M.; Barbacid M. Cell cycle, CDKs and cancer: a changing paradigm. Nat. Rev. Cancer 2009, 9, 153–166. 10.1038/nrc2602. [DOI] [PubMed] [Google Scholar]
- Malumbres M.; Barbacid M. To cycle or not to cycle: a critical decision in cancer. Nat. Rev. Cancer 2001, 1, 222–231. 10.1038/35106065. [DOI] [PubMed] [Google Scholar]
- Kastan M. B.; Bartek J. Cell-cycle checkpoints and cancer. Nature 2004, 432, 316–323. 10.1038/nature03097. [DOI] [PubMed] [Google Scholar]
- Kops G. J. P. L.; Weaver B. A. A.; Cleveland D. W. On the road to cancer: aneuploidy and the mitotic checkpoint. Nat. Rev. Cancer 2005, 5, 773–785. 10.1038/nrc1714. [DOI] [PubMed] [Google Scholar]
- Horiuchi D. E.; Huskey N.; Kusdra L.; Wohlbold L.; Merrick K. A.; Zhang C.; Creasman K. J.; Shokat K. M.; Fisher R. P.; Goga A. Chemical-genetic analysis of cyclin dependent kinase 2 function reveals an important role in cellular transformation by multiple oncogenic pathways. Proc. Natl. Acad. Sci. U.S.A. 2012, 109, E1019–E1027. 10.1073/pnas.1111317109. [DOI] [PMC free article] [PubMed] [Google Scholar]
- Kirchmair J.; Göller A. H.; Lang D.; Kunze J.; Testa B.; Wilson I. D.; Glen R. C.; Schneider G. Predicting drug metabolism: experiment and/or computation?. Nat. Rev. Drug Discovery 2015, 14, 387–404. 10.1038/nrd4581. [DOI] [PubMed] [Google Scholar]
Associated Data
This section collects any data citations, data availability statements, or supplementary materials included in this article.