Abstract
Nanoprobes have been increasingly applied in the biomedical field due to their superior optical, electronic, or magnetic properties. Among the many aspects involved in the interaction between nanoprobes and biospecimens, size plays an essential role. Although the influence of size on their internalization behavior and distribution in live cells has been extensively studied, how does the size affect penetration of nanoprobes into fixed cells remains unknown. We investigate here the influence of size on the penetration behavior of gold nanoprobes into fixed mammalian cells by dark-field microscopy and surface-enhanced Raman scattering (SERS) microspectroscopy. We show that 14, 20, and 29 nm nanoprobes can readily enter into methanol-fixed MCF-7 cells, while 42 and 55 nm nanoprobes cannot cross the cell membrane. For 4% paraformaldehyde-fixed cells, even 14 nm nanoprobes can hardly get into the cells, but after treatment with permeabilization reagents, 14 and 20 nm nanoprobes are permitted to enter the cells. These findings provide important implications in future design of nanoprobes for cellular immunostaining.
Introduction
Nanoparticles (NPs) are typically in the size range of 1–100 nm. Their small size imparts physical/chemical properties that are distinct from those of the same material in the bulk form, making them highly attractive for use in various biomedical applications.1 For instance, NP-based drug delivery and imaging systems have been largely developed in the past decades for disease treatment and diagnosis, showing enhanced therapeutic efficacy and improved diagnostic accuracy.2 In particular, optical nanoprobes based on noble metal NPs, quantum dots (QDs), upconversion NPs, and carbon/silica NPs in combination with a fluorescence/electronic/photoacoustic/Raman microscope may provide bright signals for highly sensitive and selective detection of analytes and have been widely applied in immunoassays.3
Understanding the interaction between NPs and biosystems (cell/tissue/body) is of fundamental importance for rational design of nanoprobes and facilitating their efficient applications.4 Among the many factors involved in the NP–biosystem interaction, size is known to play a key role.2b For in vivo applications, size affects systemic biodistribution and metabolic kinetics of particles after intravenous injection: in general, larger particles (>200 nm) mostly accumulate in the liver and spleen; NPs with a size lower than 200 nm extravasate out of blood vessels and retain in the tumor interstitium owing to its leaky vasculature structures and the lack of a draining lymphatic system, that is, the enhanced permeation and retention (EPR) effect; NPs smaller than 5–10 nm can pass through the glomerular basement membrane of the kidney and are quickly cleared from the blood.5 When met with live cells, NPs are easily taken up by the cells through various endocytic pathways such as macropinocytosis, clathrin-mediated endocytosis, caveolin-mediated endocytosis, and so on. The influence of size on the uptake of NPs by cultured cells has been extensively investigated in recent years.6 For example, Chithrani et al. evaluated nanoparticle entry into HeLa cells for Au NPs in the 14–100 nm size range. By inductively coupled plasma atomic emission spectroscopy (ICP-AES) detection and transmission electron microscopy (TEM) observation, the authors found that Au NPs of 50 nm had maximum uptake by Hela cells compared to the NPs with either smaller sizes (14 and 30 nm) or larger sizes (74 and 100 nm).7 Later on, Lu et al. evaluated cellular uptake of FITC-labeled mesoporous silica nanoparticles (MSNs) in the size range of 30–280 nm. Confocal laser scanning microscopy (CLSM) and inductively coupled plasma mass spectrometry (ICP–MS) were employed to investigate the particle internalization, showing highly particle size-dependent cellular uptake in the order 50 > 30 > 110 > 280 > 170 nm.8 These findings suggest that NPs with a diameter of 50 nm may be the most suitable candidate to serve as a carrier or nanoprobe for live cell studies.
On the other hand, nanoprobes have shown great advantages in immunostaining of fixed cells/tissue specimens in terms of sensitivity, stability, and multiplexing capacity.9 In an immunocytochemistry process, fixation and permeabilization of cells are usually necessary before treatment with antibodies to determine the location of antigens within the cells.10 Commonly used chemical fixatives include organic solvents, formaldehyde/paraformaldehyde (PFA), and glutaraldehyde. Solvents such as alcohols and acetone are strong coagulants and simultaneous permeabilization agents, with which proteins are precipitated, carbohydrates and nucleic acids are removed by washing, and lipids in both the membranes and cytoplasm are solubilized and extracted. Formaldehyde crosslinks proteins by addition to amino, amido, guanidino, thiol, phenolic, imidazolyl, and indolyl groups and forms chemically stable methylene bridges. It is also a good fixative for membrane lipids, and therefore, an additional permeabilization step is usually required to render the membrane permeable to antibodies. Glutaraldehyde is very effective in preserving the fine structure and is usually paired with osmium tetroxide postfixation to provide excellent cytological preservation for electron microscopy, but it often results in lowered protein antigenicity.11 Different from the endocytic pathways involved in live cells, NPs enter into fixed cells mainly by diffusion since the proteins are fixed and lose their biological activities and the lipids are partially dissolved during the permeabilization process, leaving some pores in the membrane. NPs are typically larger than antibodies, and therefore, one would ask whether NPs can enter into fixed cells during the immunostaining process. However, as far as we know, the influence of particle size on their penetrating behavior into fixed cells has not been explored.
In this study, we synthesized Au NPs with different sizes (14, 20, 29, 42, and 55 nm) to study the size effect on their permeability into fixed cells. We select Au NPs as the model system because (1) the size of Au NPs can be well controlled;12 (2) Au NPs as one kind of plasmonic-active NPs have been increasingly applied in various immunoanalytical assays;3b and (3) Au NPs can be used as metal substrates to produce surface-enhanced Raman scattering (SERS) signals and offer the convenience to be monitored by dark-field (DF) microscopy and SERS microspectroscopy.13 ICP-AES and ICP–MS are two commonly used methods for elemental analysis and allow an estimate of the number of NPs on the ensemble level but cannot provide in situ information in single cells. TEM allows direct visualization of intracellular metal NPs due to their high electron density but is rather low throughput since it necessitates time-consuming processing of the samples and requires many images taken from a large number of sliced cells to obtain significant results.6a In contrast, dark-field microscopy allows in situ observation of intracellular metal NPs in a global view, and SERS scanning performed in the Raman mapping mode provides a spectrally resolved detection of NPs at each pixel in single cells.
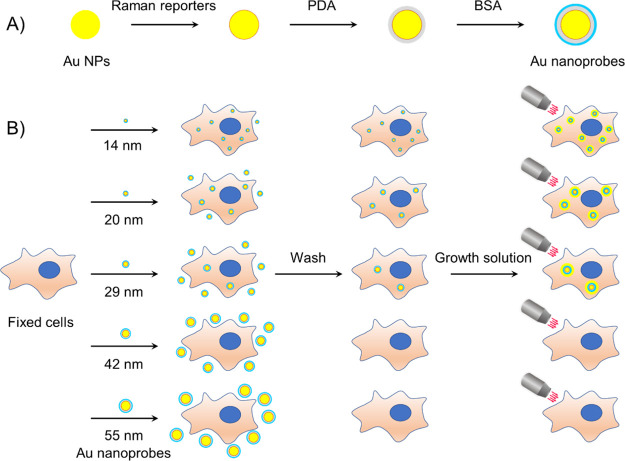
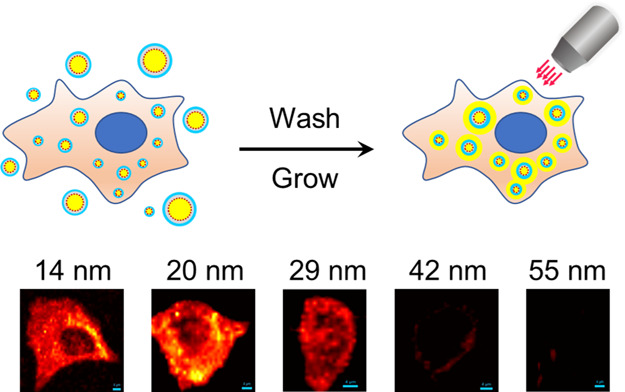
For fabricating the nanoprobes, we labeled the Au NPs with Raman reporter molecules (4-nitrothiobenzoate [4-NTB] or 7-mercapto-4-methylcoumarin [MMC]), encapsulated them with a polydopamine (PDA) layer for stabilization, and then blocked with bovine serum albumin (BSA). The Au nanoprobes were incubated with cultured cells (MCF-7, T47D, and HEK293) fixed with either methanol or 4% PFA. After a short incubation with a Au growth solution composed of tetrachloroauric acid and hydroxylamine hydrochloride, the cells were observed using bright-field (BF) microscopy, dark-field microscopy, and Raman microspectroscopy (Scheme 1). We found that 14, 20, and 29 nm NPs penetrated into methanol-fixed cells more easily than PFA-fixed cells since methanol as an organic solvent may permeabilize cell membranes at the same time of fixation. However, with the help of permeabilization detergents such as digitonin, Tween 20, and Triton X-100, 14 and 20 nm nanoprobes were permitted to enter the PFA-fixed cells.
Scheme 1. Schematic Illustration of (A) Fabrication Process of Au Nanoprobes and (B) Size-Dependent Penetration of Au Nanoprobes into Fixed Cells and Observation using a Microscope.
Results and Discussion
Synthesis of Nanoprobes
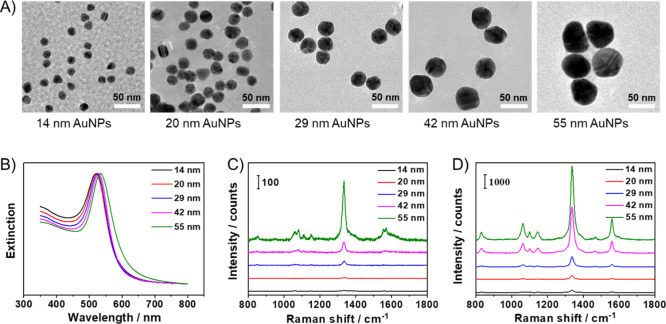
Monodisperse citrate-stabilized Au NPs of different sizes were synthesized via a seed-mediated growth method. TEM images and UV–Vis spectra of the NPs are shown in Figure 1A,B, respectively. With the increasing of the particle diameter from 14 to 55 nm, the maximum extinction peak shifted from 520 to 534 nm. The NPs were modified with 4-NTB, a typical Raman reporter molecule which produces a strong characteristic peak at 1339 cm–1. Then, dopamine was added to form a thin encapsulating layer of PDA outside the NP, which protects Raman reporter molecules from releasing and simultaneously provides catechol moieties for further conjugation with amine/sulfur groups of biomolecules.14 After that, BSA was adopted as a model protein to modify the nanoprobes since it is frequently used as a blocking reagent in immunostaining. After encapsulation of the NPs with 4-NTB, PDA, and BSA sequentially, a 11 nm red shift of the extinction peak was detected in the UV–Vis spectra (Figure S1A) and a 1.5 nm increase in the diameter was observed in the TEM image (Figure S1B), confirming the successful modification of the NPs. The SERS spectra of the nanoprobes are presented in Figure 1C, showing a strong Raman vibrational peak at 1339 cm–1 for the 55 nm nanoprobes. However, with the decreasing of the particle size, the SERS signals declined dramatically. This is because the intensity of the electromagnetic field is strongly dependent on the number of electrons excited and, thus, on the volume of the NPs.15 For further enhancement of the Raman signals, a Au growth solution composed of tetrachloroauric acid and hydroxylamine hydrochloride was added to enlarge the particle size and produce gap-enhanced Raman signals.16 As shown in Figure S2, after adding the Au growth solution, the sizes of NPs increased obviously according to the TEM images, and the extinction peaks of the Au NPs red-shifted to 547, 565, 582, 618, and 687 nm for the 14–55 nm NPs, respectively. Meanwhile, an obvious rise in peak intensity was observed in the SERS spectra of the grown NPs (Figure 1D).
Figure 1.
(A) TEM images and (B) UV–Vis spectra of the synthesized Au NPs. (C) SERS spectra of the nanoprobes (Au NP/4-NTB/PDA/BSA) with successively increased size from bottom to top. (D) SERS spectra of the nanoprobes after adding the Au growth solution.
Penetration of Nanoprobes into Methanol-Fixed MCF-7 Cells
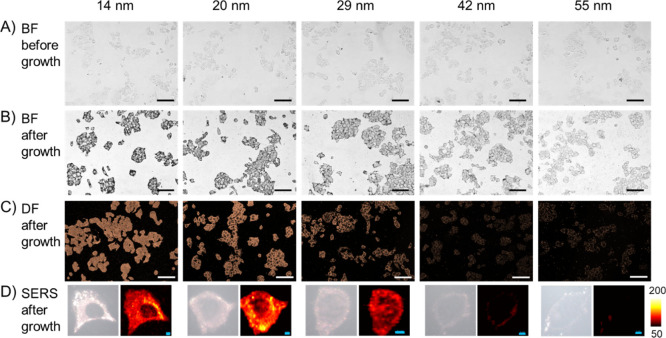
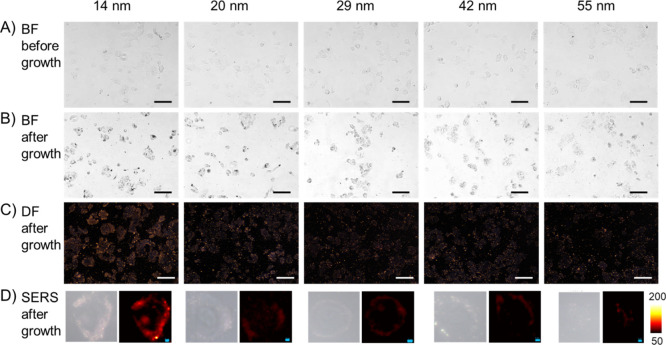
After fixation of MCF-7 cells with chilled methanol at −20 °C for 15 min, the cells were washed with PBS, blocked with 2% BSA, and incubated with nanoprobes of different sizes. As shown in Figure 2A, no obvious difference was observed in the bright-field images among the five samples (images with higher magnification are shown in Figure S3). However, after adding the Au growth solution for 10 min, the cells became apparently darker (Figure 2B), especially for the cells incubated with 14, 20, and 29 nm nanoprobes. In the dark-field microscopy images, strong scattering can also be observed in the 14, 20, and 29 nm nanoprobe-treated cells. We next performed SERS mapping to investigate the precise location of the nanoprobes inside the cells. As presented in Figure 2D, strong SERS signals were detected inside the cells incubated with 14 or 20 nm nanoprobes, showing that the nanoprobes penetrated into the cells. SERS signals can also be detected inside the cells incubated with 29 nm nanoprobes, but the signal intensity was weaker compared with that of the smaller ones. For the cells incubated with 42 nm nanoprobes, only a very weak profile can be seen around the cell. Almost no SERS signal was detected in the cells incubated with 55 nm nanoprobes. The bright-field images, dark-field images, and typical SERS scanning images of methanol-fixed MCF-7 cells incubated without nanoprobes are presented in Figure S4. No SERS signals were detected in cells either before or after adding the Au growth solution.
Figure 2.
Penetration of nanoprobes into methanol-fixed MCF-7 cells. (A) Bright-field images of cells incubated with nanoprobes of different sizes. (B) Bright-field images and (C) dark-field images of the cells after adding the Au growth solution. (D) Typical SERS scanning images of the cells incubated with nanoprobes of different sizes and after growth. Scalebar in BF/DF images: 100 μm; scalebar in SERS images: 4 μm.
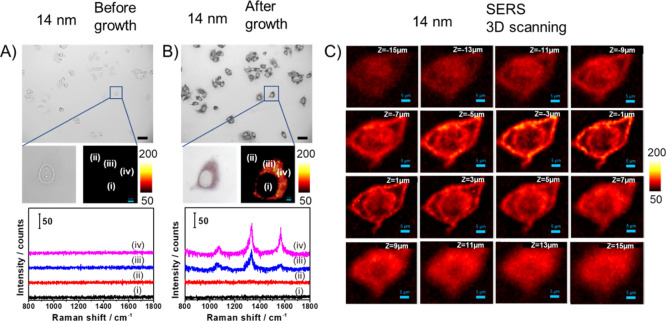
We monitored the change in SERS signals in a single cell before and after adding the growth solution. Figure 3A,B presents bright-field images, SERS images, and representative SERS spectra of the 14 nm nanoprobe-treated cells before and after growth, respectively. Before adding the growth solution, no SERS signals could be detected, while after growth, strong SERS signals appeared in the same cell. Figure 3C depicts three-dimensional SERS scanning images of a cell at different Z planes, showing that the 14 nm nanoprobes enter into the fixed cell. A majority of the nanoprobes are located in the vicinity of the cell membrane or nuclear membrane, and some nanoprobes entered into the cell nucleus. For comparison, we also performed 3D SERS scanning of cells incubated with the 55 nm nanoprobes, but no signals could be observed (Figure S5).
Figure 3.
In situ SERS detection of a single MCF-7 cell incubated with 14 nm nanoprobes (A) before and (B) after adding the Au growth solution. Scalebar in BF images: 50 μm and scalebar in SERS images: 4 μm. (C) Three-dimensional SERS scanning images of a fixed MCF-7 cell incubated with 14 nm nanoprobes and after growth at different Z planes (−15–15 μm). Scalebar: 5 μm.
Penetration of Nanoprobes into PFA-Fixed MCF-7 Cells
PFA is another frequently used cell fixation reagent, which crosslinks amino groups without changing the tertiary structure of proteins so that most epitopes remain available for specific antibodies.17 We fixed MCF-7 cells with 4% PFA and incubated the cells with nanoprobes of different sizes. The microscopy images are presented in Figure 4. Very different from the methanol-fixed cells, the PFA-fixed cell samples became only mildly darker after adding the Au growth solution for 10 min. In the dark-field images (Figure 4C), a slightly stronger scattering was observed in the cells incubated with 14 nm nanoprobes compared to the other samples. SERS signals are also only observed in the periphery of 14 nm nanoprobe-treated cells, indicating that even the smallest nanoprobes used here can hardly penetrate across the cell membrane.
Figure 4.
Penetration of nanoprobes into 4% PFA-fixed MCF-7 cells. (A) Bright-field images of cells incubated with nanoprobes of different sizes. (B) Bright-field images and (C) dark-field images of the cells after adding the Au growth solution. (D) Typical SERS scanning images of the cells incubated with nanoprobes of different sizes and after growth. Scalebar in BF/DF images: 100 μm; scalebar in SERS images: 2 μm.
The distinct behavior of nanoprobes in methanol-fixed cells and PFA-fixed cells may result from the varied membrane permeabilization by methanol and PFA. Organic solvents such as methanol and acetone can simultaneously fix and break the cell membrane, making the immunostaining process more simplified.18 The one-step fixation and membrane breaking process of the reagents is useful if the major protein systems in the cell are studied, whereas when it comes to studying less-stable intracellular antigens, this type of reagents may not be the first choice. Instead, PFA fixation in combination with permeabilization detergents is usually employed in this case. Detergents, such as digitonin, Tween 20, and Triton X-100, can break the membrane by either dissolving the phospholipid or the cholesterol of the cell membrane.19 Tween 20 and Triton X-100 are nonselective. They interact with proteins and lipids to form pores and potentially remove proteins and lipids from the cell membrane. Digitonin can selectively only break cell membranes by combining with cholesterol or other β-hydroxysteroids. Therefore, we permeabilized the PFA-fixed cells with digitonin, Tween 20, and Triton X-100 individually using the commonly selected conditions and investigated the penetration behavior of nanoprobes into the permeabilized PFA-fixed cells.
Penetration of Nanoprobes into Permeabilized PFA-Fixed MCF-7 Cells
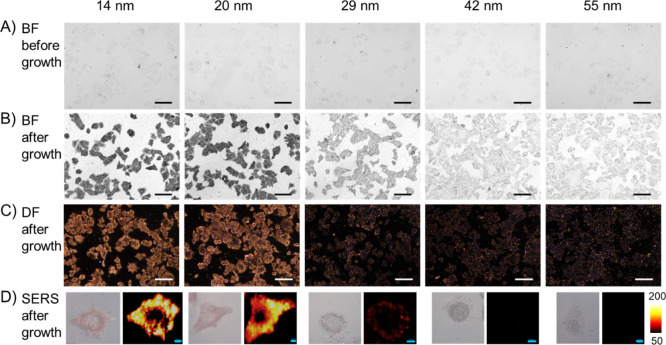
To investigate the influence of permeabilization detergents on nanoprobe penetration, PFA-fixed cells were permeabilized with digitonin, Tween 20, or Triton X-100 individually and then incubated with nanoprobes of different sizes. Figure 5 presents the results of cells treated with 50 μg/mL digitonin for 5 min. It can be seen that 14 and 20 nm nanoprobes can readily penetrate into the permeabilized cells since the cells became dark in the bright-field images and became bright in the dark-field images after adding the Au growth solution. Intense SERS signals were observed inside the cells incubated with 14 or 20 nm nanoprobes, while very weak or almost no SERS signals could be detected in the cells incubated with larger NPs. A similar phenomenon was observed in the cells fixed with 4% PFA and permeabilized with 4% Tween 20 (Figure S6) or 0.1% Triton X-100 (Figure S7) for 5 min, showing that the detergents form pores smaller than 29 nm in the cell membranes.
Figure 5.
Penetration of nanoprobes into 4% PFA-fixed and 50 μg/mL digitonin-permeabilized MCF-7 cells. (A) Bright-field images of cells incubated with nanoprobes of different sizes. (B) Bright-field images and (C) dark-field images of the cells after adding the Au growth solution. (D) Typical SERS scanning images of the cells incubated with nanoprobes of different sizes and after growth. Scalebar in BF/DF images: 100 μm; scalebar in SERS images: 4 μm.
TEM Imaging of Nanoprobes in Cell Slices
For direct visualization of the nanoprobes inside the cells, we incubated the fixed cells with nanoprobes, embedded, sectioned, and observed the cell slices by TEM. As shown in Figure 6A, for the 14 nm Au nanoprobes, no NPs were observed inside the 4% PFA-fixed cells, but after permeabilization with digitonin, a number of nanoprobes were found in the cytoplasm (Figure 6B, marked in red circles). In contrast, for the 55 nm Au nanoprobes, no NPs were found inside the cell even after permeabilization, with only one NP observed to be adhered on the outer cell membrane (Figure 6C, marked in a blue circle). The TEM results are in consistence with the phenomenon observed by dark-field microscopy and SERS microspectroscopy, but the latter two techniques are more easily performed and provide higher throughput of information.
Figure 6.
TEM images of cell slices. (A) MCF-7 cells fixed with 4% PFA and incubated with 14 nm Au nanoprobes; (B) MCF-7 cells fixed with 4% PFA, permeabilized with digitonin, and incubated with 14 nm Au nanoprobes; (C) MCF-7 cells fixed with 4% PFA, permeabilized with digitonin, and incubated with 55 nm Au nanoprobes.
Penetration of Nanoprobes into Fixed T47D Cells and HEK 293 Cells
To investigate the penetration behavior of nanoprobes in response to particle size in other cells lines, the human breast cancer T47D cells and the human embryonic kidney HEK 293 cells were fixed with methanol and incubated with nanoprobes of different sizes. As shown in Figure S8, a similar tendency was observed in T47D cells as in MCF-7 cells, that is, 14 and 20 nm nanoprobes penetrated into the fixed cells readily and bright SERS signals were observed inside the cells; 29 nm nanoprobes could enter the cells but with a lower amount so that the SERS signals were weaker, while the 42 and 55 nm nanoprobes could not cross the cell membrane. In the case of HEK 293 cells (Figure S9), SERS signals could be detected in fixed cells incubated with 42 nm nanoprobes and smaller ones, but the 55 nm nanoprobes cannot enter the cells. The difference among cell lines might be induced by varied protein and lipid compositions in the cell membranes of HEK 293 cells with the other two cancer cell lines.
Influence of Surface Modification and Concentration of Nanoprobes
In the above-performed experiments, Au NPs were labeled with 4-NTB to fabricate nanoprobes for SERS imaging. We also fabricated nanoprobes labeled with another Raman reporter molecule, MMC, and tested their penetration behavior. The peak intensity at 1588 cm–1 was used to create the SERS mapping images. As shown in Figure S10, SERS signals were observed in the cells incubated with 29 nm nanoprobes and smaller ones, in consistence with the results obtained with the 4-NTB-labeled nanoprobes. In addition, we modified the Au NPs of different sizes only with BSA and then incubated them with fixed cells. Since there was no reporter molecule on the NPs, SERS imaging was not performed. The bright-field images of the cells are shown in Figure S11. After adding the growth solution, the cells incubated with 14, 20, or 29 nm NPs became dark, while the cells incubated with 42 or 55 nm NPs were much lighter, indicating more penetration of the small-sized NPs.
We also tested whether the size-dependent penetration effect occurs on specific targeting nanoprobes. Mucin1 (MUC1) is a glycoprotein overexpressed in most of the breast cancer cells.20Figure S12A shows immunofluorescence staining results of MUC1 in MCF-7 cells. We modified the Au NPs of different sizes with aptamers against MUC1 to fabricate targeting nanoprobes and incubated them with methanol-fixed MCF-7 cells. As shown in Figure S12B,C, 14, 20, and 29 nm MUC1-targeting nanoprobes were able to enter into the methanol-fixed MCF-7 cells, but the 42 and 55 nm MUC1-targeting nanoprobes could only be bound to the cell membranes. This experiment indicates that even for the specific targeting nanoprobes, the NP sizes play an important role in their penetration behaviors.
As detailed in the experimental part, in the abovementioned experiments, NPs of different sizes were adjusted to have the same surface area and applied for incubation with fixed cells. In this case, the concentration of smaller NPs is higher than that of the larger ones. To exclude the effect of varied concentrations, we adjusted the concentration of the nanoprobes to be the same (0.28 nM) and incubated them with methanol-fixed MCF-7 cells. As shown in Figure S13, a similar tendency was observed as that before when the surface areas were kept the same: 14, 20, and 29 nm NPs were able to enter into the cells, but the 42 and 55 nm NPs could not, confirming the size-dependent penetration behavior of nanoprobes into fixed cells.
Conclusions
In summary, we fabricated Au nanoprobes of different sizes, incubated them with fixed cells, and observed their location within the cells using dark-field microscopy and SERS imaging. We found that the penetration behavior of the nanoprobes is size-dependent and also relies on the fixation/permeabilization reagents. Nanoprobes up to 29 nm were able to enter the methanol-fixed cells; in contrast, for the PFA-fixed cells, nanoprobes with an even smaller size (14 nm) can hardly cross the cell membrane. However, after treatment with a permeabilization surfactant such as digitonin, Tween 20, or Triton X-100, 14 and 20 nm nanoprobes may penetrate into the cells. The results indicate that the size of nanoprobes needs to be carefully considered in future NP-based immunostaining studies, especially for intracellular applications.
Experimental Section
Reagents and Instruments
Tetrachloroauric acid (HAuCl4), sodium citrate, hydroxylamine hydrochloride (NH2OH-HCl), BSA, dopamine, 4-NTB, MMC, methanol, paraformaldehyde, Tween 20, Triton X-100, and digitonin were purchased from Sigma-Aldrich. Ultrapure water (Milli-Q, 18.2 MΩ) was obtained from a Millipore water system. MCF-7, T47D, and HEK293 cells were supplied by American Type Culture Collection (ATCC, USA). DMEM culture medium, RPMI 1640 culture medium, and fetal bovine serum (FBS) were purchased from BBI Life sciences. The mouse anti-MUC1 antibody was purchased from Abcam, and the Alexa 555-labeled secondary antibody was obtained from Thermo Fisher. The aptamer against MUC1 (5′ GCAGTTGATCCTTTGGATACCCTGG 3′) was synthesized by Shanghai Sangon Biotechnology Co. The morphology and size of the NPs were measured using a transmission electron microscope (JEOL JEM-2800, Japan). Extinction spectra were recorded with a PerkinElmer LAMBDA650 UV/Vis absorption spectrometer.
Synthesis of Au NPs of Different Sizes
Au NPs ranging in size from 14 to 55 nm were synthesized by citrate reduction and seed-mediated growth.21 In brief, a solution of 2.2 mM sodium citrate in Milli-Q water (150 mL) was heated with a heating mantle in a 250 mL three-necked round-bottomed flask for 15 min under vigorous stirring. After boiling, 1 mL of HAuCl4 (25 mM) was injected. Immediately after the synthesis of the Au seeds and in the same vessel, the reaction was cooled until the temperature of the solution reached 90 °C. Then, 1 mL of sodium citrate (60 mM) and 1 mL of a HAuCl4 solution (25 mM) were sequentially injected (time delay ∼2 min). By repeating this process (sequential addition of 1 mL of 60 mM sodium citrate and 1 mL of 25 mM HAuCl4), up to five generations of Au NPs of progressively larger sizes were grown. The concentrations of the Au NPs were calculated by the extinction spectra according to the literature.22
Fabrication of Au Nanoprobes
A total of 10 μL of 4-NTB (10 mM) or MMC (10 mM) in ethanol was added into 1 mL of Au NPs of different sizes and incubated for 4 h. After that, the Au NPs were centrifuged and re-dispersed in 1 mL of Tris-HCL buffer (pH = 8.5). Subsequently, 5 μL of 5 mg/mL dopamine was added to the suspension and vortexed for 30 min. Then, the NPs were centrifuged and blocked overnight with 2% BSA/PBS. For preparation of MUC1-targeting nanoprobes, after dopamine encapsulation, the Au NPs were centrifuged and re-dispersed in Tris-HCL buffer (pH = 8.5). Then, a 10 μM SH-terminated aptamer was added to the suspension with a NP/aptamer ratio of 1:200 and incubated for 2 h. Finally, the nanoprobes were centrifuged and dispersed in 2% BSA/PBS.
Cell Culture
MCF-7 and HEK 293 cells were cultured in RPMI 1640 medium supplemented with 10% FBS and 1% penicillin/streptomycin. T47D cells were cultured in DMEM medium supplemented with 10% FBS and 1% penicillin/streptomycin. The cells were cultured in a 95% air and 5% CO2 atmosphere at 37 °C. For the sake of dark-field and SERS imaging, the cells were seeded on coverslips and incubated overnight to adhere. After treating with fixed agents and permeabilization reagents, the coverslips were transferred to a 24-well plate and incubated with nanoprobes.
Incubation with Nanoprobes
The cells were fixed either with chilled methanol at −20 °C for 15 min or with 4% PFA at room temperature for 15 min and then washed with PBS three times. For permeabilization, 4% PFA-fixed cells were further treated with 50 μg/mL digitonin, 4% Tween 20, or 0.1% Triton X-100 for 5 min. Subsequently, the cells were washed with PBS and blocked with 2% BSA/PBS for 2 h and then, 300 μL of nanoprobes of different sizes was added and incubated for 1 h. For comparison, either the surface areas or the concentrations of the NPs were kept equal. Specifically, the Au nanoprobes were dispersed in 2% BSA/PBS, with OD = 0.5 for the 55 nm Au nanoprobes (which is proper for immunostaining according to our previous study and the literature23) and the surface areas of the nanoprobes of other sizes were kept equal to those of the 55 nm nanoprobes for comparison. In this case, the concentration of the NPs was 0.28, 0.16, 0.07, 0.04, and 0.02 nM for the 14–55 nm NPs, respectively. For equal-concentration studies, we adjusted the concentration of the NPs with varied sizes to be the same (0.28 nM) and incubated them with the fixed cells. After that, the cells were washed thoroughly with PBS and Milli-Q water each three times. Finally, the Au growth solution was added and incubated for 10 min, and the cells were observed with a Zeiss microscope for bright-field images and a Nikon Ci-L microscope for dark-field images.
SERS Measurements
SERS spectra (800–1800 cm–1) were recorded on a Raman spectrophotometer (Horiba HR evolution, 600 grooves/mm grating) with a laser excitation wavelength of 633 nm (HeNe laser). A 10× (NA 0.5) microscope objective, 13.4 mW laser beam, and 10 s acquisition time were applied to measure the solution samples. A 50× (NA 0.5) microscope objective and 5.4 mW laser beam were used for Raman imaging of the cells. The mapping images were acquired at an interval of 1 μm with an acquisition time of 0.05 s. For three-dimensional SERS scanning, different Z planes (−15–15 μm) were scanned with an interval of 2 μm.
Immunofluorescence Staining
Methanol-fixed MCF-7 cells were washed with PBS three times, blocked with 2% BSA/PBS for 2 h, and then incubated with the primary mouse anti-MUC1 antibody (1:150 dilution) overnight at 4 °C. Then, the cells were washed with PBS and incubated with the Alexa555-labeled secondary antibody (1:300 dilution) for 30 min at RT. After that, the cells were washed with PBS and treated with DAPI as a nuclear counterstain.
TEM Imaging of Cell Slices
MCF-7 cells were trypsinized, centrifuged, and fixed with 4% PFA. The cells were divided to three aliquots. One was incubated with 14 nm Au nanoprobes and the other two were treated with 50 μg/mL digitonin for 5 min and then incubated with 14 and 55 nm Au nanoprobes individually. After removing the free nanoprobes by centrifugation, the cells were washed with PBS and dehydrated in an alcohol series, embedded in Epon, and sliced to a thickness of 70 nm. Images of the slices were taken with a HITACHI H-7650 transmission electron microscope.
Acknowledgments
The authors would like to acknowledge the financial support from the National Natural Science Foundation of China (81871487) and Special fund for central university basic scientific research (63191173).
Glossary
Abbreviations
- 4-NTB
4-nitrothiobenzoate
- MMC
7-mercapto-4-methylcoumarin
- BSA
bovine serum albumin
- BF
bright-field
- CLSM
confocal laser scanning microscopy
- DF
dark-field
- EPR
enhanced permeation and retention
- FBS
fetal bovine serum
- ICP-AES
inductively coupled plasma atomic emission spectroscopy
- ICP-MS
inductively coupled plasma mass spectrometry
- MSNs
mesoporous silica nanoparticles
- MUC1
mucin1
- NPs
nanoparticles
- PFA
paraformaldehyde
- QDs
quantum dots
- SERS
surface-enhanced Raman scattering
- TEM
transmission electron microscopy
Supporting Information Available
The Supporting Information is available free of charge at https://pubs.acs.org/doi/10.1021/acsomega.0c05458.
UV–Vis spectra of 14 nm nanoprobes at each step during surface modification and TEM image of the 14 nm nanoprobes; TEM images and UV–Vis spectra of the NPs after adding the Au growth solution; highly magnified BF images of cells incubated with nanoprobes of different sizes; BF images, DF images, and SERS images of methanol-fixed MCF-7 cells incubated without nanoprobes; three-dimensional SERS scanning images of a methanol-fixed MCF-7 cell incubated with 55 nm nanoprobes and after growth; penetration of nanoprobes into 4% PFA-fixed and 4% Tween 20-permeabilized MCF-7 cells; penetration of nanoprobes into 4% PFA-fixed and 0.1% Triton X-100-permeabilized MCF-7 cells; penetration of nanoprobes into methanol-fixed T47D cells; penetration of nanoprobes into methanol-fixed HEK293 cells; penetration of nanoprobes into methanol-fixed MCF-7 cells using MMC as the Raman reporter molecules; penetration of Au NP-BSA into methanol-fixed MCF-7 cells; penetration of MUC1-targeting nanoprobes into methanol-fixed MCF-7 cells; and penetration of nanoprobes into methanol-fixed MCF-7 cells at equal NP concentrations (0.28 nM) (PDF)
Author Contributions
The manuscript was written through contributions of all authors. All authors have given approval to the final version of the manuscript.
The authors declare no competing financial interest.
Supplementary Material
References
- Azzazy H. M. E.; Mansour M. M. H. In vitro diagnostic prospects of nanoparticles. Clin. Chim. Acta 2009, 403, 1–8. 10.1016/j.cca.2009.01.016. [DOI] [PubMed] [Google Scholar]
- a Anselmo A. C.; Mitragotri S. Nanoparticles in the clinic. Bioeng. Transl. Med. 2016, 1, 10–29. 10.1002/btm2.10003. [DOI] [PMC free article] [PubMed] [Google Scholar]; b Shi J.; Kantoff P. W.; Wooster R.; Farokhzad O. C. Cancer nanomedicine: progress, challenges and opportunities. Nat. Rev. Cancer 2017, 17, 20–37. 10.1038/nrc.2016.108. [DOI] [PMC free article] [PubMed] [Google Scholar]
- a Fu X.; Chen L.; Choo J. Optical Nanoprobes for Ultrasensitive Immunoassay. Anal. Chem. 2017, 89, 124–137. 10.1021/acs.analchem.6b02251. [DOI] [PubMed] [Google Scholar]; b Zhou W.; Gao X.; Liu D.; Chen X. Gold Nanoparticles for In Vitro Diagnostics. Chem. Rev. 2015, 115, 10575–10636. 10.1021/acs.chemrev.5b00100. [DOI] [PMC free article] [PubMed] [Google Scholar]; c Gao D.; Yuan Z. Photoacoustic-based multimodal nanoprobes: from constructing to biological applications. Int. J. Biol. Sci. 2017, 13, 401–412. 10.7150/ijbs.18750. [DOI] [PMC free article] [PubMed] [Google Scholar]
- a Mu Q.; Jiang G.; Chen L.; Zhou H.; Fourches D.; Tropsha A.; Yan B. Chemical basis of interactions between engineered nanoparticles and biological systems. Chem. Rev. 2014, 114, 7740–7781. 10.1021/cr400295a. [DOI] [PMC free article] [PubMed] [Google Scholar]; b Cheng L.-C.; Jiang X.; Wang J.; Chen C.; Liu R.-S. Nano-bio effects: interaction of nanomaterials with cells. Nanoscale 2013, 5, 3547–3569. 10.1039/c3nr34276j. [DOI] [PubMed] [Google Scholar]
- a Blanco E.; Shen H.; Ferrari M. Principles of nanoparticle design for overcoming biological barriers to drug delivery. Nat. Biotechnol. 2015, 33, 941–951. 10.1038/nbt.3330. [DOI] [PMC free article] [PubMed] [Google Scholar]; b Park S.-m.; Aalipour A.; Vermesh O.; Yu J. H.; Gambhir S. S. Towards clinically translatable in vivo nanodiagnostics. Nat. Rev. Mater. 2017, 2, 17014. 10.1038/natrevmats.2017.14. [DOI] [PMC free article] [PubMed] [Google Scholar]; c Popović Z.; Liu W.; Chauhan V. P.; Lee J.; Wong C.; Greytak A. B.; Insin N.; Nocera D. G.; Fukumura D.; Jain R. K.; Bawendi M. G. A nanoparticle size series for in vivo fluorescence imaging. Angew. Chem., Int. Ed. Engl. 2010, 49, 8649–8652. 10.1002/anie.201003142. [DOI] [PMC free article] [PubMed] [Google Scholar]
- a Lévy R.; Shaheen U.; Cesbron Y.; Sée V. Gold nanoparticles delivery in mammalian live cells: a critical review. Nano Rev. 2010, 1, 4889. 10.3402/nano.v1i0.4889. [DOI] [PMC free article] [PubMed] [Google Scholar]; b Walkey C. D.; Olsen J. B.; Guo H.; Emili A.; Chan W. C. W. Nanoparticle size and surface chemistry determine serum protein adsorption and macrophage uptake. J. Am. Chem. Soc. 2012, 134, 2139–2147. 10.1021/ja2084338. [DOI] [PubMed] [Google Scholar]; c Chen D.; Monteiro-Riviere N. A.; Zhang L. W. Intracellular imaging of quantum dots, gold, and iron oxide nanoparticles with associated endocytic pathways. Wiley Interdiscip. Rev.: Nanomed. Nanobiotechnol. 2016, 9, e1419 10.1002/wnan.1419. [DOI] [PubMed] [Google Scholar]
- Chithrani B. D.; Ghazani A. A.; Chan W. C. W. Determining the Size and Shape Dependence of Gold Nanoparticle Uptake into Mammalian Cells. Nano Lett. 2006, 6, 662–668. 10.1021/nl052396o. [DOI] [PubMed] [Google Scholar]
- Lu F.; Wu S.-H.; Hung Y.; Mou C.-Y. Size effect on cell uptake in well-suspended, uniform mesoporous silica nanoparticles. Small 2009, 5, 1408–1413. 10.1002/smll.200900005. [DOI] [PubMed] [Google Scholar]
- a Zrazhevskiy P.; Gao X. Quantum dot imaging platform for single-cell molecular profiling. Nat. Commun. 2013, 4, 1619. 10.1038/ncomms2635. [DOI] [PMC free article] [PubMed] [Google Scholar]; b Xu H.; Xu J.; Wang X.; Wu D.; Chen Z. G.; Wang A. Y. Quantum dot-based, quantitative, and multiplexed assay for tissue staining. ACS Appl. Mater. Interfaces 2013, 5, 2901–2907. 10.1021/am303267g. [DOI] [PubMed] [Google Scholar]; c Stepula E.; Wang X.-P.; Srivastav S.; König M.; Levermann J.; Kasimir-Bauer S.; Schlücker S. 6-Color/1-Target Immuno-SERS Microscopy on the Same Single Cancer Cell. ACS Appl. Mater. Interfaces 2020, 12, 32321–32327. 10.1021/acsami.0c07269. [DOI] [PubMed] [Google Scholar]; d Li J.; Liu H.; Rong P.; Zhou W.; Gao X.; Liu D. A universal strategy for the one-pot synthesis of SERS tags. Nanoscale 2018, 10, 8292–8297. 10.1039/c8nr00564h. [DOI] [PubMed] [Google Scholar]
- Skoog L.; Tani E. Immunocytochemistry: an indispensable technique in routine cytology. Cytopathology 2011, 22, 215–229. 10.1111/j.1365-2303.2011.00887.x. [DOI] [PubMed] [Google Scholar]
- Melan M. A. Overview of cell fixation and permeabilization. Methods Mol. Biol. 1994, 34, 55–66. 10.1385/0-89603285-x:55. [DOI] [PubMed] [Google Scholar]
- Njoki P. N.; Lim I.-I. S.; Mott D.; Park H.-Y.; Khan B.; Mishra S.; Sujakumar R.; Luo J.; Zhong C.-J. Size Correlation of Optical and Spectroscopic Properties for Gold Nanoparticles. J. Phys. Chem. C 2007, 111, 14664–14669. 10.1021/jp074902z. [DOI] [Google Scholar]
- Schlücker S. Surface-enhanced Raman spectroscopy: concepts and chemical applications. Angew. Chem., Int. Ed. 2014, 53, 4756–4795. 10.1002/anie.201205748. [DOI] [PubMed] [Google Scholar]
- a Kumar S.; Kumar A.; Kim G.-H.; Rhim W.-K.; Hartman K. L.; Nam J.-M., Myoglobin and Polydopamine-Engineered Raman Nanoprobes for Detecting, Imaging, and Monitoring Reactive Oxygen Species in Biological Samples and Living Cells. Small 2017, 13 (), 10.1002/smll.201701584; [DOI] [PubMed] [Google Scholar]; b Dong Z.; Gong H.; Gao M.; Zhu W.; Sun X.; Feng L.; Fu T.; Li Y.; Liu Z. Polydopamine Nanoparticles as a Versatile Molecular Loading Platform to Enable Imaging-guided Cancer Combination Therapy. Theranostics 2016, 6, 1031–1042. 10.7150/thno.14431. [DOI] [PMC free article] [PubMed] [Google Scholar]
- a Benz F.; Chikkaraddy R.; Salmon A.; Ohadi H.; de Nijs B.; Mertens J.; Carnegie C.; Bowman R. W.; Baumberg J. J. SERS of individual nanoparticles on a mirror: size does matter, but so does shape. J. Phys. Chem. Lett. 2016, 7, 2264–2269. 10.1021/acs.jpclett.6b00986. [DOI] [PMC free article] [PubMed] [Google Scholar]; b Wang Y.; Yan B.; Chen L. SERS tags: novel optical nanoprobes for bioanalysis. Chem. Rev. 2013, 113, 1391–1428. 10.1021/cr300120g. [DOI] [PubMed] [Google Scholar]
- a Lim D.-K.; Jeon K.-S.; Hwang J.-H.; Kim H.; Kwon S.; Suh Y. D.; Nam J.-M. Highly uniform and reproducible surface-enhanced Raman scattering from DNA-tailorable nanoparticles with 1-nm interior gap. Nat. Nanotechnol. 2011, 6, 452–460. 10.1038/nnano.2011.79. [DOI] [PubMed] [Google Scholar]; b Lin L.; Gu H.; Ye J. Plasmonic multi-shell nanomatryoshka particles as highly tunable SERS tags with built-in reporters. Chem. Commun. 2015, 51, 17740–17743. 10.1039/c5cc06599b. [DOI] [PubMed] [Google Scholar]
- Leyton-Puig D.; Kedziora K. M.; Isogai T.; van den Broek B.; Jalink K.; Innocenti M. PFA fixation enables artifact-free super-resolution imaging of the actin cytoskeleton and associated proteins. Biol. Open 2016, 5, 1001–1009. 10.1242/bio.019570. [DOI] [PMC free article] [PubMed] [Google Scholar]
- Jamur M. C.; Oliver C. Cell fixatives for immunostaining. Methods Mol. Biol. 2010, 588, 55–61. 10.1007/978-1-59745-324-0_8. [DOI] [PubMed] [Google Scholar]
- Jamur M. C.; Oliver C. Permeabilization of cell membranes. Methods Mol. Biol. 2010, 588, 63–66. 10.1007/978-1-59745-324-0_9. [DOI] [PubMed] [Google Scholar]
- Pal S.; Harmsen S.; Oseledchyk A.; Hsu H.-T.; Kircher M. F. MUC1 Aptamer Targeted SERS Nanoprobes. Adv. Funct. Mater. 2017, 27, 1606632. 10.1002/adfm.201606632. [DOI] [PMC free article] [PubMed] [Google Scholar]
- Bastús N. G.; Comenge J.; Puntes V. Kinetically controlled seeded growth synthesis of citrate-stabilized gold nanoparticles of up to 200 nm: size focusing versus Ostwald ripening. Langmuir 2011, 27, 11098–11105. 10.1021/la201938u. [DOI] [PubMed] [Google Scholar]
- Khlebtsov N. G. Determination of size and concentration of gold nanoparticles from extinction spectra. Anal. Chem. 2008, 80, 6620–6625. 10.1021/ac800834n. [DOI] [PubMed] [Google Scholar]
- a Zhang Y.; Wang X.-P.; Perner S.; Bankfalvi A.; Schlücker S. Effect of Antigen Retrieval Methods on Nonspecific Binding of Antibody-Metal Nanoparticle Conjugates on Formalin-Fixed Paraffin-Embedded Tissue. Anal. Chem. 2018, 90, 760–768. 10.1021/acs.analchem.7b03144. [DOI] [PubMed] [Google Scholar]; b Salehi M.; Schneider L.; Ströbel P.; Marx A.; Packeisen J.; Schlücker S. Two-color SERS microscopy for protein co-localization in prostate tissue with primary antibody-protein A/G-gold nanocluster conjugates. Nanoscale 2014, 6, 2361–2367. 10.1039/c3nr05890e. [DOI] [PubMed] [Google Scholar]
Associated Data
This section collects any data citations, data availability statements, or supplementary materials included in this article.


