

Abstract
The increasing use of engineered nanoparticles (ENPs) in many industries has generated significant research interest regarding their impact on the environment and human health. The major routes of ENPs to enter the human body are inhalation, skin contact, and ingestion. Following ingestion, ENPs have a long contact time in the human stomach. Hence, it is essential to know the fate of the ENPs under gastric conditions. This study aims to investigate the fate of the widely used nanoparticles Ag-NP, Au-NP, CeO2-NP, and ZnO-NP in simulated gastric fluid (SGF) under different conditions through the application of single-particle inductively coupled plasma-mass spectrometry (SP-ICP-MS). The resulting analytical methods have size detection limits for Ag-NP, Au-NP, ZnO-NP, and CeO2-NP from 15 to 35 nm, and the particle concentration detection limit is 135 particles/mL. Metal ions corresponding to the ENPs of interest were detected simultaneously with detection limits from 0.02 to 0.1 μg/L. The results showed that ZnO-NPs dissolved completely and rapidly in SGF, whereas Au-NPs and CeO2-NPs showed apparent aggregation and did not dissolve significantly. Both aggregation and dissolution were observed in Ag-NP samples following exposure to SGF. The size distributions and concentrations of ENPs were affected by the original ENP concentration, ENP size, the contact time in SGF, and temperature. This work represents a significant advancement in the understanding of ENP characteristics under gastric conditions.
Keywords: nanoparticles, single-particle (SP)-ICP-MS, simulated gastric fluid (SGF), ingestion exposure
Graphical Abstract

INTRODUCTION
In recent years, the increased use of nanotechnology and nanoenabled consumer products has penetrated every field of science and the economic sector. The increasing value of engineered nanoparticles (ENPs) for various applications has led to a significant increase in their presence in the environment. The emerging utility of ENPs has raised concerns about their potential risks related to human health and the environment.1 Engineered nanomaterials and nanoagrochemicals could be taken up by plants and accumulate in plant tissues, which provides a potential pathway for entering the food chain, subsequently posing health risks.2 ENPs are also widely used in the food industry as food additives for enhancing the texture and color of food, as antimicrobials for improving food preservation in food packaging, and as nutritional supplements. In the pharmaceutical/medical field, ENPs are used as catalysts to make specific drugs, such as potential anticancer agents. These applications could directly increase human exposure to ENPs.3–6 Many studies imply that exposure to ENPs is strongly correlated to some pathophysiological mechanisms.7–9 The toxicity of nanoparticles is determined by various factors, such as size, concentration, shape, stability, and agglomeration.10 While there are a few pathways by which ENPs can enter the body, ingestion is of interest due to the use of ENPs as food additives and in agriculture and pharmaceuticals. Ingested ENPs first pass the digestive system before distributing to the circulatory or lymphatic systems or being removed from the body as waste.11,12 The fate of the ENP depends on its characteristics. Therefore, it is necessary to study the aspects of ENPs under gastric conditions.
Nanoparticles of silver (Ag-NPs), gold (Au-NPs), zinc oxide (ZnO-NPs), and cerium oxide (CeO2-NPs) are the most commonly used metallic ENPs.7,13–17 The fates of Au-NPs and CeO2-NPs in simulated gastric fluid (SGF) have not been investigated, to the best of our knowledge. There are several studies for Ag-NPs and ZnO2-NPs in gastric conditions,4,14–18–26 and these studies provided very valuable information. However, these previous studies mostly tested limited experimental conditions, such as a single high concentration of ENPs, one specific contact time, as well as one single temperature. More importantly, particle concentration, particle size distribution, and dissolved concentration could not be simultaneously and quantitatively measured in most of these studies due to the limits of experimental methodologies. Thus, the fates of these ENPs under more realistic conditions were not well confirmed.
Single-particle inductively coupled plasma-mass spectrometry (SP-ICP-MS) is a high throughput and ultrasensitive emerging technology for the simultaneous analysis of nanoparticle and metal ion concentrations27,28 with size detection limits in the range 10–20 nm for some monoelemental nanoparticles.29 The results of size distribution experiments with SP-ICP-MS have shown good agreement with scanning electron microscopy (SEM).30–32 The development of SP-ICP-MS technology has advanced nanoparticle analysis and is expected to play an increasing role, thereby becoming a standard method for nanoparticle analysis.28,32 SP-ICP-MS has been applied to several metal-based ENP analyses in different sample matrices, such as plant tissues, water, animal tissues, etc.2,27,31–41 However, to the best of our knowledge, SP-ICP-MS has not been widely applied to the analysis of ENPs in gastric fluid. Therefore, this SP-ICP-MS application for rapid and sensitive tracking of the metal-based ENP fate in gastric fluid represents a useful advancement in the field of ENP analysis.
This study aims to establish SP-ICP-MS methods for characterization and quantification of several broadly used metal-based ENPs, including Ag-NPs, Au-NPs, CeO2-NPs, and ZnO-NPs, in SGF and systematically investigates the fates of these ENPs in SGF with different contact times, particle sizes, particle concentrations, and exposure temperatures using the state-of-the-art SP-ICP-MS technology. The particle concentrations, size distributions, and concentrations of metal ions were also monitored simultaneously.
MATERIALS AND METHODS
Materials and Reagents.
Different sizes (10, 20, 40, 70, and 100 nm) of citrate-stabilized Ag-NPs (0.02 mg/mL) and Au-NPs (10, 15, 20, 30, 40, 50, and 80 nm at a concentration of 0.05 mg/mL) were purchased from nanoComposix (San Diego, CA). These ENPs are spherical with narrow size distributions (coefficient of variation of <15%). ZnO-NPs (<100 nm) were obtained from Sigma-Aldrich (St. Louis, MO). ZnO-NP (80–200 nm) and CeO2-NPs (30–50 nm, stock suspension of 40% CeO2-NPs in H2O) were purchased from US Research Nanomaterials Inc. (Houston, TX). SEM analysis was carried out to determine the shapes and size distributions of the CeO2 and ZnO NPs. The SEM images of these ENPs are provided in the Supporting Information (Figures S1 and S2). Ultrahigh purity (MQ) water (18.2 MΩ cm) was produced by an Elix-3 water purification system from Millipore (Billerica, MA). Hydrochloric acid (HCl) (trace metal grade) and glycine (>99%) were purchased from Fisher Scientific (Fair Lawn, NJ) and Sigma-Aldrich (St. Louis, MO), respectively. Dissolved Au, Ag, Zn, and Ce ions (1000 mg/L) were purchased from High-Purity Standards (Charleston, SC). For the pH value of SGF, the pH of the biological gastric fluid is biologically regulated in a narrow pH range. Other researchers have studied it for Ag-NPs.26 The SGF in this study was prepared in MQ water with 0.42 mol/L HCl and 0.40 mol/L glycine18,19 It is a broadly used formula of SGF in the scientific research field. The pH value of the SGF was 1.2, measured with a pH meter.
SP-ICP-MS Method.
An ICP-MS (NexION 300/350D, PerkinElmer, Shelton, CT) equipped with Syngistix Single-Particle Application software was used for the single-particle analysis of ENPs in SGF. 197Au, 107Ag, 64Zn, and 140Ce with natural abundances of 100%, 51.84%, 48.6%, and 88.45%, respectively, were monitored by the SP-ICP-MS. Details of the optimized ICP-MS operating conditions and SP-ICP-MS parameters are shown in Table 1. The 40 nm Au-NP suspension served as a standard to determine the transportation efficiency of the SP-ICP-MS method that was optimized for each batch of samples. Citrate-stabilized Au-NP (10, 15, 20, 30, 40, 50, and 80 nm) and Ag-NP (10, 20, 40, 70, and 100 nm) standards diluted in MQ water were used to test the particle size detection limits under optimal SP-ICP-MS conditions. Dissolved Au and Ag calibration standards at concentrations of 0.1, 0.2, 0.5, 1, 2, 5, 10, and 20 μg/L were also incorporated into the methods to measure the concentrations of corresponding dissolved ions. For ZnO-NPs and CeO2-NPs, there were no commercially available ENP standards with relatively narrow size distribution. Therefore, dissolved Zn and Ce calibration curves were used for the determination of dissolved ion concentrations, particle sizes, and particle number concentrations. The dissolved standard SP-ICP-MS signals were converted to the corresponding ENP sizes according to the mass fraction and density of the material.40,42 The particle size detection limits of ZnO-NPs and CeO2-NPs were determined to be five times the standard deviation above the background intensity in MQ water.28,29 Equation 1 was employed to measure the particle concentration detection limit (LOD):
| (1) |
where ηneb is the nebulization efficiency, Qsam is the sample flow rate, and ti is the total acquisition time.43
Table 1.
Optimized ICP-MS Operating Conditions and SP-ICP-MS Method Parameters
| optimized ICP-MS operating conditions | ||||
|---|---|---|---|---|
| nebulizer gas flow (L/min)a | 1.02 | |||
| auxiliary gas flow (L/min) | 1.2 | |||
| plasma gas flow (L/min) | 18 | |||
| ICP radiofrequency (RF) power (W) | 1600 | |||
| analog stage voltage (V) | −1675 | |||
| pulse stage voltage (V) | 1250 | |||
| cell entrance voltage (V) | −6 | |||
| cell exit voltage (V) | −6 | |||
| cell rod offset | −15 | |||
| sampler cones | platinum | |||
| skimmer cones | platinum | |||
| sample introduction system | cyclonic spray chamber with a Meinhard nebulizer | |||
| transport efficiency (%)a | 7–9 | |||
| SP-ICP-MS method parameters | ||||
| analyte | Au | Ag | Zn | Ce |
| mass | 197 | 107 | 64 | 140 |
| dwell time (ms) | 0.05 | 0.05 | 0.05 | 0.05 |
| settling time (ms) | 0 | 0 | 0 | 0 |
| density (g/cm3) | 19.3 | 10.5 | 5.606 | 7.215 |
Parameters optimized daily.
The lowest spiked concentration that maintained regression linearity (R2 > 0.99) was set to be the dissolved detection limit of the element. The calibration range of dissolved element ions was set to 0.1–20 μg/L in a single-particle mode of ICP-MS.
Nanoparticles Exposure in SGF.
To test the fates of different ENPs in SGF, each nanoparticle sample was prepared in the SGF at 1, 10, and 100 μg/L in ICP-MS individual autosampler tube, followed by incubation in a water bath shaker (120 rpm)44 at 23 or 37 °C for different time periods (from 0 to 360 min). The same experiments were conducted for all the ENPs. Control samples were conducted in parallel with the equal amounts of ENPs spiked into Milli-Q (MQ) water. At the selected contact times (at the beginning of spiking (about 2 min), 15, 30, 60, 120, and 360 min), samples were collected and diluted appropriately (to approximately 105 ENPs/mL or lower) with MQ water and subsequently analyzed by SP-ICP-MS. MQ water was used as a dilution solvent because all the NPs studied in this paper are stable in MQ water in the selected concentration ranges, except ZnO-NPs. The dilution factor and the matrix effect were also tested for different dilution factors (1, 5, 10, 50, 100, 500, and 1000 depending on the initial concentration) for SP-ICP-MS analysis. The results showed that the initial concentrations of dissolved ions and nanoparticles are basically the same in specific ranges of dilution factors except for ZnO-NPs, which dissolve quickly in SGF. We selected these ranges of the dilution factors for the NPs analyses.
RESULTS AND DISCUSSION
SP-ICP-MS Method Performance.
The size detection limits for Au-NPs and Ag-NPs were determined by analyzing ENP standard suspensions of Au-NPs at 10, 15, 20, 30, 40, 50, and 80 nm and Ag-NPs at 10, 20, 40, 70, and 100 nm. The ICP-MS response intensities of Au-NPs vis size were linear from 15 to 80 nm, whereas for Ag-NPs, the linear range was from 20 to 100 nm. Therefore, the size detection limits for Au-NPs and Ag-NPs were determined to be 15 and 20 nm. The particle concentration detection limits of the Au-NPs, Ag-NPs, and CeO2-NPs were estimated on the basis of the published method43 to be ~135 NPs/mL. However, due to the rapid dissolution of ZnO-NPs in MQ water and SGF, the data shows that the detection limit for the particle number concentration could not be measured accurately. The particle size detection limits of CeO2-NP and ZnO-NP were determined to be 25 and 35 nm, respectively, by the same way of our previously published method.31 The particle size detection limits, particle concentration detection limits, and dissolved ions concentration detection limits determined using SP-ICP-MS are shown in Table 2.
Table 2.
Detection Limits of Different ENPs
| detection limits |
|||
|---|---|---|---|
| particle ID | size (nm) | particle concentration (particles/mL) | dissolved ion (μg/L) |
| Ag-NPs | 20 | 135 | 0.05 |
| Au-NPs | 15 | 135 | 0.05 |
| CeO2-NPs | 25 | 135 | 0.02 |
| ZnO-NPs | 35 | N/Aa | 0.1 |
N/A means not available.
Fate of Ag-NPs in SGF.
The fates of Ag-NPs (40 and 70 nm) at concentrations (1, 10, and 100 μg/L) in SGF were monitored for over 6 h at 23 and 37 °C. The corresponding controls were conducted in filtered deionized MQ water. Figure 1a shows that Ag-NP particle concentrations did not change significantly for the 6 h of contact time in the water at 23 °C, which was also confirmed by the stable size distributions of Ag-NPs shown in Figures S3a–c and S4a–c. Ag-NPs in MQ water at 37 °C also exhibited similar stability from the beginning to 6 h of contact time (data is not shown here). At a low concentration of 1 μg/L Ag-NPs, both 40 and 70 nm Ag-NP particle concentrations decreased rapidly to below size detection limit within 15 min in SGF. This decrease was due to the dissolution, as confirmed by the increased concentration of dissolved Ag+ ion shown in Table 3. Figure 1b illustrates the decrease of particle concentration with contact time for 40 nm Ag-NPs at a concentration of 10 μg/L. Figure 1c shows profiles of 40 nm Ag-NPs in SGF at a high concentration of 100 μg/L. The particle concentrations decreased slower when the concentration is higher. The particles were still present in the samples up to 6 h of contact time. Similarly, Figure 1(d) and 1(e) represent the profiles of 70 nm Ag-NPs in SGF. At 10 μg/L, the particle concentration decreased with time and all dissolved in 2 h at a decreasing rate lower than that of 40 nm Ag-NPs at the same mass concentration. For high concentrations (100 μg/L) of 70 nm Ag-NPs in SGF, the particle concentration decreased first and then slowed down. Comparing the Ag-NPs profiles based on their particle sizes, the smaller Ag-NPs dissolved faster than the larger ones under the same condition, as expected. A possible reason is that the higher specific surface area of the smaller Ag-NP contributes to a higher dissolution/reaction rate in SGF. Moreover, analysis of obtained data suggests that the particles dissolve/react faster at body temperature (37 °C) than at room temperature (23 °C) from Figure 1, indicating that temperature also has a significant impact on the fate of Ag-NPs in SGF.
Figure 1.
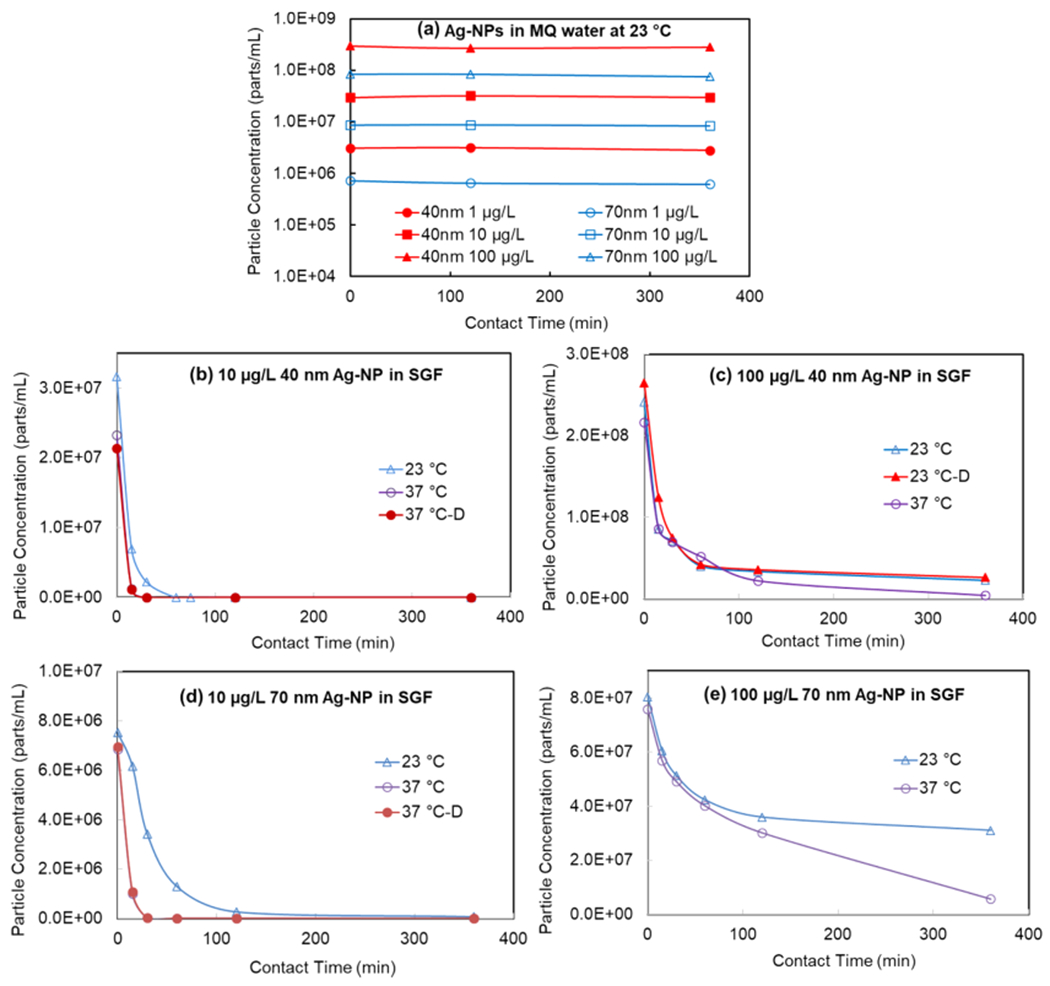
Particle concentration profiles of Ag-NPs with time in MQ and SGF at different temperatures. -D means duplicate sample. The samples were diluted appropriately at the time of SP-ICP-MS analysis, and the concentrations were before the dilutions.
Table 3.
Dissolved Metal Ion Concentration in MQ Water and SGF at Different Contact Timesa
| dissolved metal ion concentration (μg/L) |
||||||||||
|---|---|---|---|---|---|---|---|---|---|---|
| in MQ Water at 23 °C |
in SGF at 23 °C |
in SGF at 37 °C |
||||||||
| nanoparticle species | contact time (min) | 1 μg/Lb | 10 μg/L | 100 μg/L | 1 μg/L | 10 μg/L | 100 μg/L | 1 μg/L | 10 μg/L | 100 μg/L |
| 40 nm Ag-NP | 2 | <LODc | <LOD | <LOD | 0.60 | 5.77 | 28.78 | 0.66 | 6.14 | 39.89 |
| 15 | <LOD | <LOD | <LOD | 0.75 | 8.07 | 28.96 | 0.99 | 8.42 | 42.76 | |
| 30 | <LOD | <LOD | <LOD | 1.00 | 8.46 | 29.37 | 1.02 | 11.07 | 45.75 | |
| 60 | <LOD | <LOD | <LOD | 0.92 | 9.77 | 36.98 | 1.04 | 10.61 | 74.79 | |
| 120 | <LOD | <LOD | <LOD | 0.94 | 10.04 | 37.81 | 0.97 | 11.24 | 75.96 | |
| 360 | <LOD | <LOD | <LOD | 0.99 | 10.64 | 54.96 | 0.94 | 11.38 | 78.61 | |
| 70 nm Ag-NP | 2 | <LOD | <LOD | <LOD | 0.45 | 3.1 | 19.33 | 0.51 | 4.32 | 25.76 |
| 15 | <LOD | <LOD | <LOD | 0.75 | 6.47 | 23.77 | 0.99 | 9.95 | 43.22 | |
| 30 | <LOD | <LOD | <LOD | 1.07 | 8.87 | 27.64 | 1.03 | 10.16 | 46.40 | |
| 60 | <LOD | <LOD | <LOD | 1.11 | 9.44 | 29.31 | 1.11 | 11.40 | 46.95 | |
| 120 | <LOD | <LOD | <LOD | 1.05 | 11.18 | 29.51 | 1.10 | 11.16 | 50.26 | |
| 360 | <LOD | <LOD | <LOD | 1.04 | 11.21 | 43.93 | 1.14 | 11.75 | 70.54 | |
| 40 nm Au-NP | 2 | <LOD | <LOD | <LOD | <LOD | <LOD | <LOD | <LOD | <LOD | <LOD |
| 360 | <LOD | <LOD | <LOD | <LOD | <LOD | <LOD | <LOD | <LOD | <LOD | |
| 80 nm Au-NP | 2 | <LOD | <LOD | <LOD | <LOD | <LOD | <LOD | <LOD | <LOD | <LOD |
| 360 | <LOD | <LOD | <LOD | <LOD | <LOD | <LOD | <LOD | <LOD | <LOD | |
| 30–50 nm CeO2-NP | 2 | <LOD | <LOD | <LOD | <LOD | <LOD | <LOD | <LOD | <LOD | <LOD |
| 360 | <LOD | <LOD | <LOD | <LOD | <LOD | <LOD | <LOD | <LOD | <LOD | |
| <100 nm ZnO-NP | 2 | 0.79 | 7.78 | 54.00 | 1.17 | 9.08 | 84.21 | 1.13 | 11.50 | 113.64 |
| 120 | 0.88 | 8.36 | 80.70 | 1.15 | 9.33 | 97.35 | 1.07 | 11.40 | 103.61 | |
| 360 | 1.09 | 10.64 | 98.26 | 1.15 | 9.53 | 99.22 | 1.14 | 11.67 | 110.39 | |
| 80–200 nm ZnO-NP | 2 | 0.82 | 3.71 | 45.15 | 1.10 | 11.03 | 114.04 | NAd | NA | NA |
| 120 | 1.13 | 5.19 | 60.85 | 1.13 | 11.21 | 112.27 | NA | NA | NA | |
| 360 | 1.18 | 7.85 | 73.49 | 1.09 | 11.27 | 115.62 | NA | NA | NA | |
Note: For Au- and CeO2-NPs, all the measured dissolved concentrations at different contact times (2, 15, 30, 60, 120, and 360 min) are lower than the detection limits. ZnO-NPs dissolve rapidly in SGF in a couple of minutes. Partial data are presented in the table.
Dosing concentration of ENPs into MQ water and SGF.
LOD means limit of detection of dissolved ions, which is shown in Table 2.
NA means not analyze.
Figure 2 shows the change of the most frequent size and mean size of Ag-NPs at 100 μg/L in MQ water and SGF at time intervals of 2, 15, 30, 60, 120, and 360 min. It is worth noting that, though the samples were analyzed immediately after mixing well, the mixing and analysis take roughly 2 min. Thus, the first data point was at time 2 min contact time, not at 0 min. The control tests where ENPs were spiked in MQ water indicated that the size distributions of Ag-NPs remained stable for both 40 and 70 nm Ag-NPs during the 6 h tested period (Figures S3a–c and S4a–c). However, the size distributions of Ag-NPs changed significantly in SGF during the test, implicating SGF as a causative factor in the decreasing signal. The Ag-NPs dissolved very rapidly at a low concentration of 1 μg/L for both 40 and 70 nm Ag-NPs in SGF at 23 and 37 °C. As a result, the histograms at this concentration could not be reliably measured. The size distribution histograms of spiked 40 nm Ag-NPs at a concentration of 10 μg/L in SGF at 23 and 37 °C are shown in Figure S3d,f, which indicate that the most common particle size decreased with exposure time. When high concentration (100 μg/L) 40 nm Ag-NPs were spiked in SGF at 23 °C, the most frequent size of the particles increased rapidly from 47 nm at the beginning of dosing (about 2 min) to 62 nm within 60 min and then stayed the same until 6 h tested (Figure 2a). This indicated that the aggregation of the Ag-NP likely occurred at a high concentration at room temperature, which could contribute to the rapid decreasing of the particle concentration during the early contact time. Additionally, Figure 2a shows that the most frequent size Ag-NPs increased from 21 to 50 nm first and then decreased to 35 nm in SGF at the temperature of 37 °C. The mean size of 40 nm Ag-NPs spiked at a concentration of 100 μg/L in SGF at 37 °C was smaller than those incubated at 23 °C, as also shown in Figure 2b. The fate of Ag-NPs in a biological system is complicated by different factors. Liu et al.45 also referred that the dissolution and aggregation of Ag-NPs is a complicated dynamic process that was influenced by particle size, concentration, surface coating material, and exposure environment. For 70 nm Ag-NP, the most frequent particle size decreased with time for the 10 μg/L 70 nm Ag-NP in SGF at 23 and 37 °C, as shown in Figure S4d,f. However, the most frequent and mean sizes increased when spiked 100 μg/L 70 nm Ag-NP in SGF at 23 and 37 °C. The most frequent and mean size of 70 nm Ag-NPs at 37 °C were slightly lower than at 23 °C, as shown in Figure 2c,d.
Figure 2.

Most frequent size and mean size profiles of 100 μg/L Ag-NPs in MQ water and SGF with time.
The rate of dissolution of the Ag-NPs spiked into SGF at body temperature (37 °C) was rapid at the beginning of the exposure and then slowed down. This phenomenon was likely attributed to the fact that the dissolved Ag+ ions reacted with the chloride in SGF to form AgCl precipitation on the surface of the Ag-NPs or as separate AgCl particles, due to the low Ksp value of AgCl and high Cl− concentration in solution.46 A similar phenomenon was found and explained when Ag-NPs were exposed to highly acidic conditions (pH 2) in other publications.19,26 At a longer contact time, the particles might also redistribute, making more change in the Ag-NPs, together with AgCl. Mwilu et al. observed that the size of Ag-NPs increased significantly after spiking a high concentration (2 mg/L) of 10 and 75 nm Ag-NPs into SGF for up to 30 min. However, Walczak et al.20 reported that the size of Ag-NPs decreased from 60 nm to 20–30 nm after spiking 60 nm Ag-NPs (500 μg/L) into SGF for 2 h without reporting the shorter exposure time. In this study, Figure 2 shows the fate profiles of Ag-NPs with different exposure times in the SGF from the beginning to 6 h, which is the longest possible exposure time in the stomach.
The concentrations of Ag+ tend to increase from the initial spiking to 6 h in all suspensions (Table 3), which indicates that both 40 and 70 nm Ag-NPs dissolved in SGF. At concentrations of 1 and 10 μg/L, all the Ag-NPs were dissolved within 15 and 120 min. Correspondingly, the detected Ag+ ion concentration is about equivalent to Ag-NPs concentrations of 1 and 10 μg/L. At a high concentration (100 μg/L) of Ag-NPs, the situation is more complex. Ag+ ion concentration increased initially and then slowed down and only slightly increased from 1 to 6 h of exposure. The temperature of SGF in all previous studies was set at 37 °C, based on a basic understanding of human physiology. However, Bekkby et al.47 and Bateman48 showed that the gastric fluid temperature is affected by the temperature and volume of ingested meals. This study showed that temperature played a vital role in the fate of Ag-NPs in SGF. Both the most frequent and mean size of Ag-NPs are smaller at 37 °C than at 23 °C. At the same time, the dissolved Ag concentration reached 78.61 μg/L after 6 h for 40 nm Ag-NPs and 70.54 μg/L for 70 nm Ag-NP at 37 °C. Lower dissolved Ag was observed at 23 °C and 54.96 and 43.93 μg/L for 40 and 70 nm Ag NPs, respectably, at 6 h of exposure time. The actual Ag+ ion concentration might be lower than the detected concentrations because, if AgCl particles were formed at sizes smaller than the size detection limit of Ag-NP, they would also be identified as “dissolved” Ag. Due to the limitation of the SP-ICP-MS technology, it detects metal in particulate form but cannot distinguish the different chemical species and the exact types of particles, thus the actual form of the Ag is not clear. Therefore, the Ag-NPs determined by SP-ICP-MS in this study should be Ag-NPs and other silver-containing NPs. It has been reported that Ag-NPs may convert to Ag2S during water treatment and AgCl in SGF.19,49 Furthermore, the detected particle concentration in SGF might also be influenced by aggregation and redistribution of the particles. Therefore, the fate of Ag-NPs in SGF appeared to be affected by multiple factors, including particle size, initial mass concentration, temperature, reaction with a component of SGF, dissolution, aggregation, particle redistribution, and possibly more. The particle surface coating may be another factor that affects the fate of the particles. For example, Axson et al.26 found that the citrate-coated Ag-NPs aggregate more than the PVP Ag-NPs after 17 min exposure to SGF at pH 2. Thus, the fate of Ag-NPs in the gastric system is a complex process that warrants further study.
Fate of Au-NPs in SGF.
The fates of 40 and 80 nm Au-NPs in SGF with different initial concentrations were studied using SP-ICP-MS. The changes in particle concentrations and the most frequent and mean sizes of Au-NPs are shown in Figures 3 and 4. All suspensions of Au-NPs in MQ water at 23 °C show no change in either particle concentration (Figure 3a) or the size distribution histograms (Figures S5a–c and S6a–c). The same result was observed at 37 °C (data are not shown here). For the 40 nm Au-NPs, the particle concentrations decreased during incubation in SGF at 23 and 37 °C with all concentrations of 1, 10, and 100 Ꮌg/L. The rate of decrease in the particle concentration was inversely dependent on the initial particle concentration (Figure 3b,c). Parts a and b of Figure 4 show that both the most frequent and mean size of the 40 nm Au-NPs increased more at 100 μg/L than at 10 or 1 μg/L, indicating that the particles tend to aggregate at a higher concentration. Additionally, the results tested at temperatures of 23 and 37 °C did not affect the fate of 40 nm Au-NPs in SGF at the spiked concentration of 1 μg/L. However, at higher concentrations of 10 and 100 μg/L, increased temperatures enhanced aggregation rates.
Figure 3.

Particle concentration profiles of Au-NPs with time in MQ and SGF at different temperatures. -D means duplicate sample. The samples were diluted appropriately at the time of SP-ICP-MS analysis, and the concentrations were before the dilutions.
Figure 4.

Most frequent size and mean size profiles of Au-NPs in MQ water and SGF with time. (Note: First number in the labels represents Au-NP concentration. The second number represents temperature of SGF).
A similar trend was observed for the 80 nm Au-NPs (Figures 3d and 4c,d). The rate of decrease in the particle concentration was inversely dependent on the initial particle concentration, and aggregation was positively dependent on the initial particle concentration. However, the concentration of the 80 nm Au-NPs decreased at a slower rate, and the most frequent and the mean particle sizes increased at a slower rate than the 40 nm Au-NPs at the same concentration. The size, initial spike concentration, and temperature of the particles play a significant role in the aggregation of Au-NPs in SGF. No dissolved Au was detected in any suspensions during the experiment, as shown in Table 3, which indicates that no dissolution of Au-NPs occurred in SGF. The Au-NPs size increased while their particle concentration decreased, indicating that the reduced concentration was solely due to the aggregation of Au-NPs in SGF.
Fate of CeO2−NPs in SGF.
The fate of CeO2-NPs in SGF was studied using CeO2-NPs (30–50 nm, a SEM image is shown in Figure S1. These ENPs were spiked into SGF at concentrations of 1, 10, and 100 μg/L CeO2-NPs (calculated Ce element concentration), incubated at 23 or 37 °C for different times, and samples were collected at the set time and analyzed by SP-ICP-MS. In MQ water, the particle concentrations of CeO2-NPs did not change over extended periods at different concentrations and particle sizes (Figure 5a). When spiked these different concentrations of CeO2-NPs in SGF, the particle concentration profiles versus contact time are shown in Figure 5b–d. The particle concentration decreased only slightly for mass concentrations of 1 and 10 μg/L CeO2-NPs. However, the particle concentration rapidly reduced for the high concentration of 100 μg/L, with a more than 50% decrease in the first 60 min at 37 °C, while there was only a slight decrease at 23 °C. Figure 6 shows the changes in the mean and most frequent particle sizes of CeO2-NPs in MQ water and SGF. The mode and the mean particle sizes did not change significantly at low mass concentrations of 1 and 10 μg/L. But, the mode and the mean particle sizes of CeO2-NPs increased significantly for 100 μg/L at body temperature (37 °C), while remaining stable at 23 °C (Figure 6). The dissolved Ce concentration was below the detection limit in all suspensions (Table 3). These results concluded that CeO2-NPs are stable in SGF at low concentrations but aggregate at a high concentration at body temperature. It has been proven that some redox reactive elements, such Fe2+ and Mn2+, react with CeO2-NPs and produce dissolved Ce3+ after being absorbed on the surface of CeO2-NPs.50,51 In addition, the redox action of CeO2-NPs can be more complicated when CeO2-NPs absorbed the polymers and Fe2+. These reactions have a significant impact on the fate, transport, and toxicity of CeO2-NPs.50,51 Therefore, the biological gastric fluid with unique redox properties,52 which may affect the fate of CeO2-NPs, deserves further study. Again, SP-ICP-MS has limited capability to distinguish species of Ce, and ion chromatography in combination with ICP-MS may be applied to the further study fate of CeO2-NPs, in biological gastric fluid.
Figure 5.

Particle concentration profiles of 30–50 nm CeO2-NPs with time in MQ and SGF at different temperatures. -D means duplicate sample. The samples were diluted appropriately at the time of SP-ICP-MS analysis, and the concentrations were before the dilutions.
Figure 6.

Most frequent size and mean size profiles of 30–50 nm CeO2-NPs in MQ water and SGF with time. (Note: First number in the labels represents Au-NP concentration. The second number represents temperature of SGF).
Fate of ZnO-NPs in SGF.
The fate of ZnO-NPs in SGF was investigated for two different particle size ranges, one with a manufacture specified size less than 100 nm and the other one with a product specified size 80–200 nm. The SEM images of both types of ZnO-NPs show the irregular shape and broad range of particle size distributions (Figure S2). SP-ICP-MS experiments were performed by spiking selected concentrations of 1, 10, and 100 μg/L ZnO-NPs (calculated Zn element concentration) into MQ water and SGF, and then, samples were collected and analyzed at different contact times. The particle concentrations decreased very rapidly with time. Thus, the reliable particle concentration, particle size, and size distribution histogram could not be obtained with this technique due to such rapid dissolution of this ENP. Table 3 shows dissolved Zn concentrations at 2 and 360 min contact times. In MQ water, most of the ZnO-NPs at low concentration dissolved quickly within 2 min contact time and about 50% dissolved at a high concentration of 100 μg/L. Larger sized ZnO-NPs dissolved slower than the smaller sized ones. In SGF, all the ZnO-NPs dissolved quickly and all dissolved within 2 min of contact time (during mixing and SP-ICP-MS analysis). At high concentration (100 μg/L), ZnO-NPs appeared to dissolve faster at body temperature (37 °C) (113.6 μg/L dissolved Zn) than at room temperature (23 °C) (84.21 μg/L). However, these dissolution differences compared with the real concentration (100 μg/L) might not be significant enough to make this conclusion. Other researchers have also reported the complete dissolution of ZnO-NPs in the gastric system or under low pH fluid.4,21,23 Therefore, our experimental results in this study confirmed that ZnO-NPs dissolved very rapidly under gastric pH.
Because biological gastric fluid has more complicated compositions and unique properties, it will be interesting to study real biological gastric systems, such as using an animal study and evaluating the fates of the nanoparticles in the real biological gastric system. However, SP-ICP-MS is a powerful tool for nanoanalysis with advantages of high performance for detecting, characterizing, and quantifying nanoparticles. The limitations of SP-ICP-MS on the exact form of NPs and chemical species determination make it necessary to combine with the other technologies, such as ion chromatography-ICP-MS and field flow fractionation-ICP-MS, for a more comprehensive study of a real biological system.
CONCLUSIONS
We have developed and validated sensitive and selective SP-ICP-MS methods capable of analyzing particle concentration, size, size distribution, aggregation, and dissolution for four types of broadly used ENPs. The fates of these ENPs in SGF are investigated systemically with the new methods. The experimental results indicated that particle size, initial concentration, and temperature all played significant roles in the fates of these nanoparticles when exposed to SGF. For Ag-NPs, the alterations of particle concentration, size distribution, and dissolved Ag concentration were affected by the initial concentration, particle size, and temperature. The Ag-NPs, and/or another form of particulate Ag, are still present at up to 6 h of contact time. The original chemical form of the particulate Ag could not be confirmed by the SP-ICP-MS method, and there is a desire to further study by combination with other technology. Au-NPs are stable at low concentrations and progressively aggregated with increasing concentrations. No dissolved Au ions were found at or the above detection limit, which confirmed that Au-NPs were present in the gastric system as Au-NPs particulates form without dissolution. The CeO2-NPs in SGF is stable at low concentrations and aggregate at high concentrations only at body temperature (37 °C). These particles also do not dissolve in SGF. On the contrary, ZnO-NPs behave differently from the other three types of ENPs in this study. They dissolved very quickly in SGF. Thus, Zn-NPs do not present in particulate form in the gastric system and should not get into other biological fluids and organs after intake through food and drink.
This study adds to the growing knowledge of the fates of ENPs under conditions that simulate the human stomach. The fates of different nanoparticles after exposure to a simulated human digestion system is highly relevant to understanding the impact of ENPs overall as they become more integrated into daily life, potentially resulting in increased exposures. Various factors such as species, size, the concentration of ingested ENPs, and body temperature on the fates of nanoparticles in the human digestion system proved to be varied and complex. This research highlights the need for a better understanding of nanomaterials’ properties in the digestive system under other physiologically relevant conditions. This work contributes to an improved understanding of the fates of ENPs in gastric fluid, which gives insights into the gastrointestinal uptake of these ENPs before they enter into the blood circulation and organ systems. It is especially crucial for nanoparticles not completely solubilized in the digestive system’s physiological contact time because these ENPs will enter into the other body systems and potentially circulate through the body as particulates. Using this study framework, sequentially studying in other tissues, especially for those ENPs not dissolved in SGF, including Ag-NPs, Au-NPs, and CeO2-NPs, would be valuable to evaluate the potential risk of ENPs to human health.
Supplementary Material
ACKNOWLEDGMENTS
The authors appreciate Xing Shen for the help of some experiments, Austin Sigler for editing this manuscript, and Qingbo Yang and Shuo Yang for the SEM analysis. The authors share their gratitude with PerkinElmer, Inc. (Shelton, CT) for providing the NexION 300/350D ICP-MS instrumentation. The authors are grateful for the support provided by the Center for Single Nanoparticle, Single Cell, and Single Molecule Monitoring, Center for Research in Energy and Environment, and Biomedical Research Center at Missouri University of Science and Technology. The study was funded by the US EPA Office of Research and Development. The study has been subjected to the Agency’s Administrative review and has been approved for external publication. Any opinion expressed in this paper is those of the authors and does not reflect the US EPA’s views.
Footnotes
Supporting Information
The Supporting Information is available free of charge at https://pubs.acs.org/doi/10.1021/jasms.0c00278.
Discussion of SEM image preparation and figures of SEM images and size distribution histograms (PDF)
Complete contact information is available at: https://pubs.acs.org/10.1021/jasms.0c00278
The authors declare no competing financial interest.
Contributor Information
Xiaolong He, Department of Chemistry and Center for Single Particle, Single Cell and Single Molecule Monitoring (CS3M), Missouri University of Science and Technology, Rolla, Missouri 65409, United States.
Haiting Zhang, Department of Chemistry and Center for Single Particle, Single Cell and Single Molecule Monitoring (CS3M), Missouri University of Science and Technology, Rolla, Missouri 65409, United States.
Honglan Shi, Department of Chemistry, Center for Single Particle, Single Cell and Single Molecule Monitoring (CS3M), and Center for Research in Energy and Environment, Missouri University of Science and Technology, Rolla, Missouri 65409, United States.
Wenyan Liu, Department of Chemistry and Center for Research in Energy and Environment, Missouri University of Science and Technology, Rolla, Missouri 65409, United States.
Endalkachew Sahle-Demessie, The U.S. Environmental Protection Agency, ORD, CESER, LRTD, Cincinnati, Ohio 45268, United States.
REFERENCES
- (1).Laborda F; Bolea E; Cepria G; Gomez MT; Jimenez MS; Perez-Arantegui J; Castillo JR Detection, characterization and quantification of inorganic engineered nanomaterials: A review of techniques and methodological approaches for the analysis of complex samples. Anal. Chim. Acta 2016, 904, 10—32. [DOI] [PubMed] [Google Scholar]
- (2).Dan YB; Zhang WL; Xue RM; Ma XM; Stephan C; Shi HL Characterization of gold nanoparticle uptake by tomato plants using enzymatic extraction followed by single-particle inductively coupled plasma-aass spectrometry analysis. Environ. Sci. Technol. 2015, 49, 3007–3014. [DOI] [PubMed] [Google Scholar]
- (3).Sohal IS; O’Fallon KS; Gaines P; Demokritou P; Bello D Ingested engineered nanomaterials: state of science in nanotoxicity testing and future research needs. Part. Fibre Toxicol. 2018, 15, 29. [DOI] [PMC free article] [PubMed] [Google Scholar]
- (4).Sohal IS; Cho YK; O’Fallon KS; Gaines P; Demokritou P; Bello D Dissolution behavior and biodurability of ingested engineered nanomaterials in the gastrointestinal environment. ACS Nano 2018, 12, 8115–8128. [DOI] [PubMed] [Google Scholar]
- (5).Mei W; Wu Q Applications of metal nanoparticles in medicine/metal nanoparticles as anticancer agents. Metal Nanoparticles: Synthesis and Applications in Pharmaceutical Sciences; Wiley-VCH: Hoboken, NJ, 2018, pp 169–190. [Google Scholar]
- (6).Harish K; Nagasamy V; Himangshu B; Anuttam K Metallic nanoparticle: a review. Biomed. J. Sci. & Tech. Res 2018, 4, 3765–3775. [Google Scholar]
- (7).Li CH; Shen CC; Cheng YW; Huang SH; Wu CC; Kao CC; Liao JW; Kang JJ Organ biodistribution, clearance, and genotoxicity of orally administered zinc oxide nanoparticles in mice. Nanotoxicology 2012, 6, 746–756. [DOI] [PubMed] [Google Scholar]
- (8).Dufour EK; Kumaravel T; Nohynek GJ; Kirkland D; Toutain H Clastogenicity, photo-clastogenicity or pseudo-photo-clastogenicity: Genotoxic effects of zinc oxide in the dark, in preirradiated or simultaneously irradiated Chinese hamster ovary cells. Mutat. Res., Genet. Toxicol. Environ. Mutagen 2006, 607, 215–224. [DOI] [PubMed] [Google Scholar]
- (9).Hackenberg S; Scherzed A; Technau A; Kessler M; Froelich K; Ginzkey C; Koehler C; Burghartz M; Hagen R; Kleinsasser N Cytotoxic, genotoxic and pro-inflammatory effects of zinc oxide nanoparticles in human nasal mucosa cells in vitro. Toxicol. In Vitro 2011, 25, 657–663. [DOI] [PubMed] [Google Scholar]
- (10).Sajid M; Ilyas M; Basheer C; Tariq M; Daud M; Baig N; Shehzad F Impact of nanoparticles on human and environment: review of toxicity factors, exposures, control strategies, and future prospects. Environ. Sci. Pollut. Res 2015, 22, 4122–4143. [DOI] [PubMed] [Google Scholar]
- (11).Williams KM; Gokulan K; Cerniglia CE; Khare S Size and dose dependent effects of silver nanoparticle exposure on intestinal permeability in an in vitro model of the human gut epithelium. J. Nanobiotechnol 2016, 14, 62. [DOI] [PMC free article] [PubMed] [Google Scholar]
- (12).Lichtenstein D; Ebmeyer J; Knappe P; Juling S; Bohmert L; Selve S; Niemann B; Braeuning A; Thunemann AF; Lampen A Impact of food components during in vitro digestion of silver nanoparticles on cellular uptake and cytotoxicity in intestinal cells. Biol. Chem. 2015, 396, 1255–1264. [DOI] [PubMed] [Google Scholar]
- (13).Smolkova B; El Yamani N; Collins AR; Gutleb AC; Dusinska M Nanoparticles in food. Epigenetic changes induced by nanomaterials and possible impact on health. Food Chem. Toxicol 2015, 77, 64–73. [DOI] [PubMed] [Google Scholar]
- (14).Wu W; Zhang R; McClements DJ; Chefetz B; Polubesova T; Xing B Transformation and speciation analysis of silver nanoparticles of dietary supplement in simulated human gastrointestinal tract. Environ. Sci. Technol 2018, 52, 8792–8800. [DOI] [PubMed] [Google Scholar]
- (15).Liu Q; Zhou Q; Jiang G Nanomaterials for analysis and monitoring of emerging chemical pollutants. TrAC, Trends Anal. Chem 2014, 58, 10–22. [Google Scholar]
- (16).Corma A; Atienzar P; Garcia H; Chane-Ching JY Hierarchically mesostructured doped CeO2 with potential for solar-cell use. Nat. Mater 2004, 3, 394–397. [DOI] [PubMed] [Google Scholar]
- (17).Kosynkin V; Arzgatkina A; Ivanov E; Chtoutsa M; Grabko A; Kardapolov A; Sysina N The study of process production of polishing powder based on cerium dioxide. J. Alloys Compd 2000, 303, 421–425. [Google Scholar]
- (18).Mwilu SK; El Badawy AM; Bradham K; Nelson C; Thomas D; Scheckel KG; Tolaymat T; Ma LZ; Rogers KR Changes in silver nanoparticles exposed to human synthetic stomach fluid: Effects of particle size and surface chemistry. Sci. Total Environ 2013, 447, 90–98. [DOI] [PubMed] [Google Scholar]
- (19).Rogers KR; Bradham K; Tolaymat T; Thomas DJ; Hartmann T; Ma L; Williams A Alterations in physical state of silver nanoparticles exposed to synthetic human stomach fluid. Sci. Total Environ 2012, 420, 334–339. [DOI] [PubMed] [Google Scholar]
- (20).Walczak AP; Fokkink R; Peters R; Tromp P; Rivera ZEH; Rietjens IMCM; Hendriksen PJM; Bouwmeester H Behaviour of silver nanoparticles and silver ions in an in vitro human gastrointestinal digestion model. Nanotoxicology 2012, 7, 1198–1210. [DOI] [PubMed] [Google Scholar]
- (21).Cho WS; Kang B-C; Lee JK; Jeong J; Che J-H; Seok SH Comparative absorption, distribution, and excretion of titanium dioxide and zinc oxide nanoparticles after repeated oral administration. Part. Fibre Toxicol 2013, 10 (1), 9. [DOI] [PMC free article] [PubMed] [Google Scholar]
- (22).Böhmert L; Girod M; Hansen U; Maul R; Knappe P; Niemann B; Weidner SM; Thünemann AF; Lampen A Analytically monitored digestion of silver nanoparticles and their toxicity on human intestinal cells. Nanotoxicology 2014, 8, 631–642. [DOI] [PubMed] [Google Scholar]
- (23).Gomez-Gomez B; Perez-Corona MT; Madrid Y Using single-particle ICP-MS for unravelling the effect of type of food on the physicochemical properties and gastrointestinal stability of ZnONPs released from packaging materials. Anal. Chim. Acta 2020, 1100, 12–21. [DOI] [PubMed] [Google Scholar]
- (24).Kästner C; Lichtenstein D; Lampen A; Thünemann AF Monitoring the fate of small silver nanoparticles during artificial digestion. Colloids Surf., A 2017, 526, 76–81. [Google Scholar]
- (25).Laloux L; Kastrati D; Cambier S; Gutleb AC; Schneider YJ The food matrix and the gastrointestinal fluids alter the features of silver nanoparticles. Small 2020, 16, 1907687. [DOI] [PubMed] [Google Scholar]
- (26).Axson JL; Stark DI; Bondy AL; Capracotta SS; Maynard AD; Philbert MA; Bergin IL; Ault AP Rapid kinetics of size and pH-dependent dissolution and aggregation of silver nanoparticles in simulated gastric fluid. J. Phys. Chem. C 2015, 119, 20632–20641. [DOI] [PMC free article] [PubMed] [Google Scholar]
- (27).Telgmann L; Nguyen MTK; Shen L; Yargeau V; Hintelmann H; Metcalfe CD Single particle ICP-MS as a tool for determining the stability of silver nanoparticles in aquatic matrixes under various environmental conditions, including treatment by ozonation. Anal. Bioanal. Chem 2016, 408, 5169–5177. [DOI] [PubMed] [Google Scholar]
- (28).Laborda F; Jiménez-Lamana J; Bolea E; Castillo JR Critical considerations for the determination of nanoparticle number concentrations, size and number size distributions by single particle ICP-MS. J. Anal. At. Spectrom 2013, 28, 1220–1232. [Google Scholar]
- (29).Lee S; Bi XY; Reed RB; Ranville JF; Herckes P; Westerhoff P Nanoparticle size detection limits by single particle ICP-MS for 40 elements. Environ. Sci. Technol. 2014, 48, 10291–10300. [DOI] [PubMed] [Google Scholar]
- (30).Montoro Bustos AR; Purushotham KP; Possolo A; Farkas N; Vladar AE; Murphy KE; Winchester MR Validation of single particle ICP-MS for routine measurements of nanoparticle size and number size distribution. Anal. Chem 2018, 90, 14376–14386. [DOI] [PubMed] [Google Scholar]
- (31).Donovan AR; Adams CD; Ma Y; Stephan C; Eichholz T; Shi H Detection of zinc oxide and cerium dioxide nanoparticles during drinking water treatment by rapid single particle ICP-MS methods. Anal. Bioanal. Chem 2016, 408, 5137–5145. [DOI] [PubMed] [Google Scholar]
- (32).Donovan AR; Adams CD; Ma Y; Stephan C; Eichholz T; Shi H Single particle ICP-MS characterization of titanium dioxide, silver, and gold nanoparticles during drinking water treatment. Chemosphere 2016, 144, 148–153. [DOI] [PubMed] [Google Scholar]
- (33).Dan YB; Ma XM; Zhang WL; Liu K; Stephan C; Shi HL Single particle ICP-MS method development for the determination of plant uptake and accumulation of CeO2 nanoparticles. Anal. Bioanal. Chem 2016, 408, 5157–5167. [DOI] [PubMed] [Google Scholar]
- (34).Li CC; Dang F; Li M; Zhu M; Zhong H; Hintelmann H; Zhou DM Effects of exposure pathways on the accumulation and phytotoxicity of silver nanoparticles in soybean and rice. Nanotoxicology 2017, 11, 699–709. [DOI] [PubMed] [Google Scholar]
- (35).Proulx K; Wilkinson KJ Separation, detection and characterisation of engineered nanoparticles in natural waters using hydrodynamic chromatography and multi-method detection (light scattering, analytical ultracentrifugation and single particle ICP-MS). Environmental Chemistry. 2014, 11, 392–401. [Google Scholar]
- (36).Londono N; Donovan AR; Shi H; Geisler M; Liang Y. Effects of environmentally relevant concentrations of mixtures of TiO2, ZnO and Ag ENPs on a river bacterial community. Chemosphere 2019, 230, 567–577. [DOI] [PubMed] [Google Scholar]
- (37).Londono N; Donovan AR; Shi H; Geisler M; Liang Y Impact of TiO2 and ZnO nanoparticles on an aquatic microbial community: effect at environmentally relevant concentrations. Nanotoxicology 2017, 11, 1140–1156. [DOI] [PubMed] [Google Scholar]
- (38).Peters RJ; Rivera ZH; van Bemmel G; Marvin HJ; Weigel S; Bouwmeester H Development and validation of single particle ICP-MS for sizing and quantitative determination of nanosilver in chicken meat. Anal. Bioanal Chem 2014, 406, 3875–3885. [DOI] [PubMed] [Google Scholar]
- (39).Weigel S; Peters R; Loeschner K; Grombe R; Linsinger TPJ Results of an interlaboratory method performance study for the size determination and quantification of silver nanoparticles in chicken meat by single-particle inductively coupled plasma mass spectrometry (sp-ICP-MS). Anal. Bioanal. Chem 2017, 409, 4839–4348. [DOI] [PMC free article] [PubMed] [Google Scholar]
- (40).Dan YB; Shi HL; Stephan C; Liang XH Rapid analysis of titanium dioxide nanoparticles in sunscreens using single particle inductively coupled plasma-mass spectrometry. Microchem. J 2015, 122, 119–126. [Google Scholar]
- (41).Schwertfeger DM; Velicogna JR; Jesmer AH; Saatcioglu S; McShane H; Scroggins RP; Princz JI Extracting metallic nanoparticles from soils for quantitative analysis: method development using engineered silver nanoparticles and SP-ICP-MS. Anal. Chem 2017, 89, 2505–2513. [DOI] [PubMed] [Google Scholar]
- (42).Pace HE; Rogers NJ; Jarolimek C; Coleman VA; Higgins CP; Ranville JF Determining transport efficiency for the purpose of counting and sizing nanoparticles via single particle inductively coupled plasma mass spectrometry. Anal. Chem 2011, 83, 9361–9369. [DOI] [PMC free article] [PubMed] [Google Scholar]
- (43).Laborda F; Bolea E; Jiménez-Lamana J Single particle inductively coupled plasma mass spectrometry: a powerful tool for nanoanalysis. Anal. Chem 2014, 86, 2270–2278. [DOI] [PubMed] [Google Scholar]
- (44).Liu H; Gong F; Wei F; Wu H Artificial simulation of salivary and gastrointestinal digestion, and fermentation by human fecal microbiota, of polysaccharides from Dendrobium aphyllum. RSC Adv. 2018, 8, 13954–13963. [DOI] [PMC free article] [PubMed] [Google Scholar]
- (45).Liu J; Murphy KE; Winchester MR; Hackley VA Overcoming challenges in single particle inductively coupled plasma mass spectrometry measurement of silver nanoparticles. Anal. Bioanal. Chem 2017, 409, 6027–6039. [DOI] [PMC free article] [PubMed] [Google Scholar]
- (46).Clark RW; Bonicamp JM The Ksp-solubility conundrum. J. Chem. Educ 1998, 75 (9), 1182–1185. [Google Scholar]
- (47).Bekkby T; Bjørge A Variation in stomach temperature as indicator of meal size in harbour seals, Phoca vitulina. Mar. Mammal Sci 1995, 14 (3), 627–637. [Google Scholar]
- (48).Bateman DN Effects of meal temperature and volume on the emptying of liquid from the human stomach. J. Physiol 1982, 331, 461–467. [DOI] [PMC free article] [PubMed] [Google Scholar]
- (49).Mohan S; Princz J; Ormeci B; DeRosa MC Morphological Transformation of Silver Nanoparticles from Commercial Products: Modeling from Product Incorporation, Weathering through Use Scenarios, and Leaching into Wastewater. Nanomaterials 2019, 9, 1258–1272. [DOI] [PMC free article] [PubMed] [Google Scholar]
- (50).Liu X; Ray JR; Neil CW; Li Q; Jun Y-S Enhanced colloidal stability of CeO2 nanoparticles by ferrous ions: adsorption, redox reaction, and surface precipitation. Environ. Sci. Technol 2015, 49, 5476–5483. [DOI] [PubMed] [Google Scholar]
- (51).Ray JR; Wu XH; Neil CW; Jung HS; Li ZC; Jun YS Redox chemistry of CeO2 nanoparticles in aquatic systems containing Cr(VI)(aq) and Fe2+ ions. Environ. Sci.: Nano 2019, 6, 2269–2280. [Google Scholar]
- (52).Gorelik S; Kohen R; Ligumsky M; Kanner J Saliva plays a dual role in oxidation process in stomach medium. Arch. Biochem. Biophys 2007, 458 (2), 236–243. [DOI] [PubMed] [Google Scholar]
Associated Data
This section collects any data citations, data availability statements, or supplementary materials included in this article.