Abstract
Reverse phase protein arrays (RPPA) can assess protein expression and activation states in large numbers of samples (n>1000) and evidence suggests feasibility in the setting of multi-institution clinical trials. Despite evidence in solid tumors, little is known about protein stability in leukemia. Proteins collected from leukemia cells in blood and bone marrow biopsies must be sufficiently stable for analysis. Using 58 leukemia samples, we initially assessed protein/phospho-protein integrity for the following preanalytical variables: 1) shipping vs local processing, 2) temperature (4°C vs ambient temperature), 3) collection tube type (heparin vs Cell Save (CS) preservation tubes), 4) treatment effect (pre- vs post-chemotherapy) and 5) transit time. Next, we assessed 1515 samples from the Children’s Oncology Group Phase 3 AML clinical trial (AAML1031, NCT01371981) for the effects of transit time and tube type. Protein expression from shipped blood samples was stable if processed in ≤72 hours. While protein expression in pre-chemotherapy samples was stable in both heparin and CS tubes, post-chemotherapy samples were stable in only CS tubes. RPPA protein extremes is a successful quality control measure to identify and exclude poor quality samples. These data demonstrate that a majority of shipped proteins can be accurately assessed using RPPA.
Keywords: pediatric oncology, leukemia, proteomics, protein stability, RPPA, ALL, AML
INTRODUCTION
An important goal of functional proteomics is to accurately assess the “circuit map” of malignant cell protein networks. [1,2] Reverse phase protein arrays (RPPA) have been one method that can assess circuit maps in malignant cells. [3–6] In addition to the “circuit map” of whole proteins, RPPA can also assess a variety of post-translational modifications (PTM), including phosphorylation, protein cleavage and methylation. [7] Due to small sample requirements and multiplex protein detection capability, RPPA is well suited for the assessment of peripheral blood and bone marrow proteins collected from pediatric and adult patients enrolled in clinical trials. [8] In brief, small amounts of protein lysates are configured as a dot blot and printed on each slide followed by quantitative protein detection using validated antibodies and a detection reagent.
There is concern, however, that preanalytical handling variables, i.e. those changes occurring between sample collection and assay processing, can affect the integrity of protein concentrations. [9,10] Previous work has demonstrated that molecular assessments can be affected by leukemia sample quality. For example, a report from the Southwest Oncology Group biorepository noted that both transit time and leukemia cell viability alter RNA quality and the sensitivity of tests for FLT3 mutation status. [11] Although there is some information available about preanalytical variables in plasma preparation prior to two-dimensional difference gel electrophoresis, [12] and solid tumors undergoing laser-capture microdissection prior to RPPA, [5] there is little published information about preanalytical assessment of protein expression in blood and bone marrow samples.
There is limited information from other studies addressing how variability in preanalytical protein sample handling/processing can alter quality in molecular analyses. Ellervik et al. provided a comprehensive review of the preanalytical variables that could potentially affect sample outcome in a variety of DNA and RNA assays. [18] Mueller et al. also addressed the issue of biomarker preservation and potential biomarker instability in the setting of clinical trials. [3]
The issue of protein integrity has been addressed in solid tumors and locally collected leukemia specimens. Along with mass spectrometry, RPPA has been used to assess deregulated protein pathways and disease progression in liver, prostate, breast, colon, glioblastoma multiforme and acute leukemia. [15, 19–21] Previous work has shown that RPPA is well suited for assessing protein derived from snap frozen tissue and freshly prepared biopsy material, particularly under controlled conditions with rapid processing. [19]
Prior research has suggested that removing dead cells and sorting for leukemic blasts improved RNA quality and FLT3 internal tandem repeat sensitivity at high allelic ratios. In that work, multivariate mixed model analysis showed a 1.5-fold increase in FLT3 detection with these enhancements. Although time from collection to processing was not analyzed, specimens shipped with shorter transit times and peripheral blood specimens (vs bone marrow) tended to have higher viability and RNA quality. [11]
In this study, we sought to define the variability in preanalytical handling variables to determine if instability in protein expression would adversely affect protein assessment, particularly in multi-site leukemia clinical trials. Our results compare 1) shipping to local processing, 2) 4°C vs. room temperature, 3) collection tube type, 4) pre- vs. post-chemotherapy, and 5) transit time. These preanalytical variables had little effect on median protein concentrations and their distributions.
MATERIAL AND METHODS
Patients
For all patient samples informed consent was obtained from patients, their parent(s) or legal guardians, and assent, as appropriate, was obtained in accordance with the US National Cancer Institute and the institutional review board policies prior to sample collection. For initial analysis, 58 patients were enrolled; 56 pediatric patients and 2 adults. Forty-one of the 58 samples were collected at Baylor College of Medicine (BCM)/ Texas Children’s Cancer Center (n=39) or Ben Taub General Hospital (n=2). The remainder 17 samples were collected from patients enrolled in the Children’s Oncology Group (COG) phase 3 clinical trial named AAML1031 (clinicaltrials.gov NCT01371981). Demographics are provided for the 58 initial samples in Table 1. The average pediatric age of the 56 patients in the feasibility set was 10.7 years, excluded two adult acute myeloid leukemia (AML) patients ages 59 and 66 years.
Table 1.
Demographics in initial analysis (RPPA1-RPPA3) (n=58)
| Demographic | Number (%) |
|---|---|
| Gender | |
| Male | 25 (43%) |
| Female | 33 (57%) |
| Median Age | 10.7 years |
| Disease | |
| AML | 29 (50%) |
| B-ALL | 20 (34%) |
| T-ALL | 7 (12%) |
| APL | 1 (2%) |
| CML | 1 (2%) |
| Race | |
| Caucasian | 43 (74%) |
| African American | 7 (12%) |
| Asian | 2 (3%) |
| Mixed | 1 (2%) |
| Native American | 1 (2%) |
| Unknown | 4 (7%) |
| Ethnicity | |
| Hispanic | 29 (50%) |
| Non-Hispanic | 29 (50%) |
A validation set of 1515 samples (pre-, and post-chemotherapy samples) was collected from 501 patients who were enrolled in the COG AAML1031 clinical trial (clinicaltrials.gov; NCT01371981). Demographics of the 501 patients are shown in Table S1.
Sample collection
Peripheral blood (3–6 mL) (n=55) or bone marrow aspirates (3 mL) (n=3) were collected into heparin tubes, Cell Save (CS) tubes (Menarini-Silicon Biosystems, Huntington Valley, PA) or both. Infants (< 10 kg) had 2–3 mL samples collected in heparin tubes only (n=1). Samples were collected before the start of systemic chemotherapy, 6–10 hours (h) (6h for acute lymphoblastic leukemia (ALL), 10h for AML), and 24h after the start of chemotherapy. Samples were collected at different early time points (ALL vs AML) due to the kinetics of leukemia cell clearance in pediatric leukemia. In most cases ALL chemotherapy consisted of vincristine, prednisone or dexamethasone, asparaginase +/− doxorubicin or daunorubicin, AML patients were treated with cytarabine daunorubicin, and etoposide [ADE] +/− the proteasome inhibitor bortezomib.
Inclusion and exclusion criteria for collection of samples
Samples were collected in heparin tubes, CS preservation tubes, or complete sets in both tube types. Mixed sets (i.e. samples with different tubes used for collection at different time points) were excluded from analysis, with the exception of the pre-chemotherapy sample. Samples were included if they had an absolute blast count (ABC) of at least 1000 cells/uL sample. Those with a lower ABC were excluded from analysis. Included diagnoses were either AML or ALL; those with AML that were subsequently found to have other diseases were excluded, with the exception of n=1 acute promyelocytic leukemia patient and n=3 chronic myelogenous leukemia (CML); these children were diagnosed with AML and subsequently found to have CML by cytogenetic alterations. One infant with severe transient myeloproliferative disorder/ AML, who subsequently died in liver failure, was also included.
Sample processing
Whole cell protein lysates were made from sorted mononuclear cell fractions from either bone marrow aspirate or blood. Normalization controls were commercially available normal adult CD34+ bone marrow cells (AllCells). Peripheral blood mononuclear cells (PBMC) were isolated using Lymphoprep solution (Axis-Shield, Oslo, Norway). Isolated PBMC were washed and, if <85% mononuclear cells, underwent magnetic bead depletion using 1) CD3/CD19 for AML samples, 2) B Cell Isolation Kit II (Miltenyi Biotec, 130-091-151, Auburn, CA) for pre-B ALL, or 3) the MACSxpress® Pan T Cell Isolation Kit (Miltenyi Biotec) for T-cell ALL. Leukemia cells were separated from non-malignant cells following mononuclear cell isolation using an Automax (Miltenyi Biotech) according to the manufacturer’s directions. Blasts percentages ranged from 32–98% prior to depletion and increased to >85% following magnetic bead separation. Lysate preparation was outlined in detail previously. [13] Briefly, leukemia cells were resuspended to 2×10⁷ cells/mL and lysed in 1:1 Laemmli sample buffer (BioRad) with 1:100 fresh 2-mercaptoethanol (final concentration 2% SDS, 10% glycerol, 5% 2-mercaptoethaol, 0.52 M Tris). Cell lysates were heated at 100°C for 10–20 min (until viscosity had resolved) and immediately frozen at −80°C. RPPA lysates were analyzed after a single thaw. Lysates were maintained at −80°C during Tropical Storm Alison, Hurricane Ike and Hurricane Harvey with the use of backup generators.
Handling Conditions
Shipping:
Shipping: samples were collected at site 1 (BCM) and either held and processed at site 1 or shipped via overnight courier (FedEx) to site 2 (New York University, Langone Medical Center) and processed at site 2 (Figure 1). Samples were held at site 1 until contacted by site 2 to confirm package arrival and samples were processed at the same time at both sites. Processed protein lysates were subsequently frozen at −80°C on the day of receipt, then returned to site 1 on dry ice, for inclusion in the RPPA analysis.
Figure 1:

Schema of specimen handling in experiment 1. Patients had BM or blood sample collected before chemotherapy and divided as shown. Condition 1 samples were processed at site 1 immediately without hold or shipping. The remaining sample was divided and either held at site 1 (Condition 2, 3) or shipped to Site 2 (Condition 4, 5). Samples were held at 4°C (Condition 2, 4) or at ambient temperature (Condition 3, 5). RPPA lysates were prepared at either site 1 or at site 2 when shipped; RPPA was performed at site 1.
Temperature
Temperature from sample collection to sample processing, “ambient samples” were held at ambient temperature at site 1 or shipped to site 2 without ice packs. “4°C-samples” were refrigerated for 4–6h and either held at 4°C at site 1 or shipped to site 2 with 2–3 ice packs to maintain temperature at approximately 4°C. Samples were shipped in Thermosafe boxes to maintain temperature. During summer months all samples were shipped with at least one ice pack in the secondary container to mitigate high temperatures in courier trucks. After processing, protein lysates were subsequently frozen at −80°C and returned to site 1 on dry ice.
Tube type:
Tube type: samples were collected in either heparin tubes (NaHeparin or LiHeparin, 2.7 mL or 10 mL volume) or CS tubes (10 mL). No adjustments were made for preservative volume.
Transit time:
Transit time: time between patient sample collection and start of sample processing was recorded at both sites. Exact transit times were noted and varied from 12–96h. Weekend samples were mailed on Monday for Tuesday arrival. Samples without exact transit times (<5%) were approximated within 6h. Post-shipment time and sample temperature, as well as condition of ice packs and box post-shipping, were noted on arrival. Prior to preparation of cell lysates for protein analysis, viability on all cells was assessed by acridine orange/propidium iodide using a Nexelom automated cell counter. Samples included in the analysis had viability of >80%.
Experimental setup
Three initial experiments were performed to assess protein stability:
Experiment 1 addressed how protein expression was affected by 1) processing at the site of collection (local) vs processing after shipment across country, 2) the temperature at which the samples were maintained between collection and processing (ambient vs 4°C), and 3), variation in transit time (<24 hours (h), 24–48h, 48–72h, and >72h). Samples were processed immediately upon arrival to the laboratory at site 1, or according to conditions noted in Figure 1 and Table S2A. Briefly, condition 1 included samples processed immediately at site 2. Samples under condition 2 and 3 were held at site 1 and stored at 4°C (Condition 2) or at ambient temperature (Condition 3). Condition 4 and 5 included shipped samples, stored at 4°C (Condition 4) or at ambient temperature (Condition 5) and were then processed.
Experiment 1 included 7 patients with 6 PBMC and 2 BM samples; one patient had both BM and PBMC collected with different transit times. Three samples with “immediate” processing were delayed due to weekend collection; these samples were processed at 16h, 30h and 36h (Table S3). Removal of these samples did not statistically alter the median protein concentrations when combined with samples processed within 11h.
Experiment 2 was performed to 1) determine if protein expression was comparable in heparin vs CS preservation tubes, and 2) how chemotherapy affected protein expression. Based on our data indicating protein instability using heparin tubes, post-chemotherapy sample collection was limited to CS tubes. To assess the effect of preservation tube, PBMC samples from pediatric leukemia patients were collected prior to treatment and processed immediately at site 1 into different tubes (CS, n=23; heparin, n=15). Assessment of the effect of treatment on protein expression was evaluation using samples collected prior to chemotherapy (0h), 6–10h, and 24h after chemotherapy held at site 1 (CS, n=22) or shipped to site 2 (CS, n=18) prior to lysate preparation. All samples were held or shipped at 4°C. Conditions for each sample are listed in Table S2B. Samples were run on a second single array (RPPA2) which included 22 out of the 56 pediatric leukemia patients (12 pre-B ALL, 4 T-ALL, 5 AML, 1 CML). Processing times varied from 9–84h with a median time of 30h (Table S4).
Experiment 3 asked if it was feasible to collect samples from distant sites and perform RPPA analysis in a multi-site clinical trial. Samples were collected in CS tubes and were among the first 50 samples collected in the trial COG AAML1031. All samples were shipped to site 1. Conditions for each sample are noted in Table S2C. Samples were collected at 0h (pre-chemotherapy), 10h and 24h after the start of systemic chemotherapy. Transit time ranged from 1–104h (median of 36h) (Table S5). Fifty-one samples were collected from 17 patients. Samples were shipped at 4°C, processed at site 1, and analyzed on a third array (RPPA3). Samples for each patient were stored at 4°C until shipment and shipped in a single package following the collection of the 24h post-chemotherapy sample. One AAML1031 sample was collected and processed locally.
Analysis of the full sample set from the AAML1031 clinical trial
Peripheral blood samples from 501 patients (1515 samples) were collected in CS tubes or, if CS tubes were unavailable, heparin tubes. Based on initial quality control analysis (sample viscosity, apoptosis >80% by acridine orange/propidium iodide), 67 samples from 25 patients were omitted from analysis (4.2%).
As another means of identifying samples with suspicion of poor quality we examined the frequency of protein expression outlier values, hypothesizing that poor-quality samples would have more extreme protein levels. The sum of extremes for each sample and each antibody at all conditions was determined for each of 4 different time point bins: 0–24h, 24–48h, 48–72h and >72h. A matrix was built using a binary system whereby patients received “1” for the presence of highest or lowest 2.5% (i.e. extreme protein expression) for each antibody, or a “0” if that patient did not have extreme expression for that protein. The binary annotation was determined for all proteins across all samples. We hypothesized that stressed samples would have more extremes and that the sum of extremes would flag potentially poor-quality samples. The sum of extremes for all samples varied from 0 (no extremes across all antibodies) to 124 (42% extremes across all antibodies; poor quality sample). The median “sum of extremes” was 11; the expected median number of extremes (293 antibodies × 0.05) was 14.6. Since some antibodies had very narrow protein concentration distributions and an extreme might not indicate a poor-quality sample, further analysis of samples with the highest number of extreme protein expression was performed if the sample met the cut-off of +/− 3 standard deviations (SD) of the mean, the number of proteins with extreme expression.
RPPA construction and analysis
RPPA methodology and validation of the technique, including validation of antibodies for protein targets, have been previously described. [13–16] Briefly, for each patient sample 100uL of lysate material (approximately 1×10⁶ cell equivalents) was printed in 5 (1:2) serial dilutions onto slides along with normalization and expression controls. Control samples include both a negative (protein lysis buffer) and positive controls (mixture of 11 different AML cell lines that are known to express the proteins of interest). Single value log2 protein concentrations were generated from the 5 serial dilutions using the SuperCurve algorithm1.The SupeCurve algorithm is able to identify samples with a result out of range of all the other samples and excludes either a single datapoint (if the others are in range) or an entire sample if all are out of range. Loading control2and topographical normalization3 procedures were performed to account for protein concentration and background staining variations on each array.
Three different arrays (RPPA1–3, experiment 1–3) were performed testing different shipping conditions (Table S2) and a fourth array examined a large number of AAML1031 samples (n=1515) over a limited number of shipping conditions. Samples on RPPA1–3 were printed with four replicates per sample. RPPA1 evaluated 17 antibodies against ten different proteins known to be deregulated in AML. In general, we identified antibodies to proteins that we thought might be more susceptible to changes over time, different handling conditions and cell stress. The selected antibodies were chosen as they were antibodies that gave a range of expression, and for which there was a paired total and PTM (phosphorylation, cleavage form) antibody were available. To enhance our ability to see protein variability, our antibody set included seven antibodies targeting PTM, including 6 phosphorylation sites and one targeting cleaved caspase 3. RPPA2 was probed with 18 antibodies against the same total and PTM proteins as RPPA1 with the addition of NF-κB. RPPA3 was stained with 32 antibodies targeting 19 total proteins with 13 antibodies targeting specific phosphorylation sites. Our final RPPA was constructed with samples from the AAML1031clinical trial and was probed with 293 antibodies. Antibodies included 224 different antibodies to total protein along with 60 antibodies targeting specific phosphorylation sites, five targeting histone methylation sites and four targeting cleaved forms of caspases or Parp1. Table S6 provides a list of validated antibodies used for each feasibility array. All slides were analyzed using Microvigene® software (Vigene Tech, Carlisle, MA) to produce quantified data.
Statistics
Box plots were created using R Version 0.99.484 (2009–2015 RStudio, Inc.) and show median, 25th and 75th percentiles, along with outliers (circles). Significance between conditions was determined using Wilcoxon rank sum or Kruskal Wallis test with a false discovery rate (FDR) correction for multiple comparisons FDR-adjusted p-value < 0.05 were considered significant. Hierarchical clustering was performed using the Qlucore Omics Explorer (Qlucore AB, Lund, Sweden).
RESULTS
To determine how the preanalytical handling variables of shipping, temperature, collection tube type and transit time affect protein expression (Experiment 1), we compared relative protein expression in samples collected from 7 patients processed in different conditions that mimicked clinical trial sample shipping (Figure 1). Samples were divided and either processed immediately (Condition 1), held at site 1 at either 4°C (Condition 2) or ambient temperature (Condition 3), or shipped to site 2 at either 4°C (Condition 4) or ambient temperature (Condition 5). Samples handled under condition 2–5 were processed at the same time. Due to the shipping delays caused by weekends, the transit/hold times for the held/shipped samples varied from 24–72h (median 24h) (Table S3).
Effects of sample shipping and temperature on protein expression
To evaluate the effect on shipping on protein expression, we compared median protein concentrations and their distributions at site 1 (Condition 2 and 3) to the same samples shipped to site 2 (Condition 4 and 5). Within the 4°C samples, no statistical effect of shipment was found (Condition 2 vs 4, Supplemental Figure 1A, left). In the samples held at ambient temperature, only phospho-TP53.pSerine15 was found to be significantly upregulated (Condition 3 vs 5, Supplemental Figure 1A, right) (p=0.01). When we combined the 4°C and ambient samples, and compared the held to the shipped samples (Condition 2 and 3 vs Condition 4 and 5), again only phospho-TP53.pSerine15 had statistically lower expression after shipment (median log2 fold change 0.26 log2 to −0.40 log2) (p<0.001) (Figure 2). Other proteins had a median log2 protein change of <0.5, with the exception of CASP3 and AKT1, which were higher in shipped than in held, possibly a reflection of the stress of shipping of the two proteins.
Figure 2:
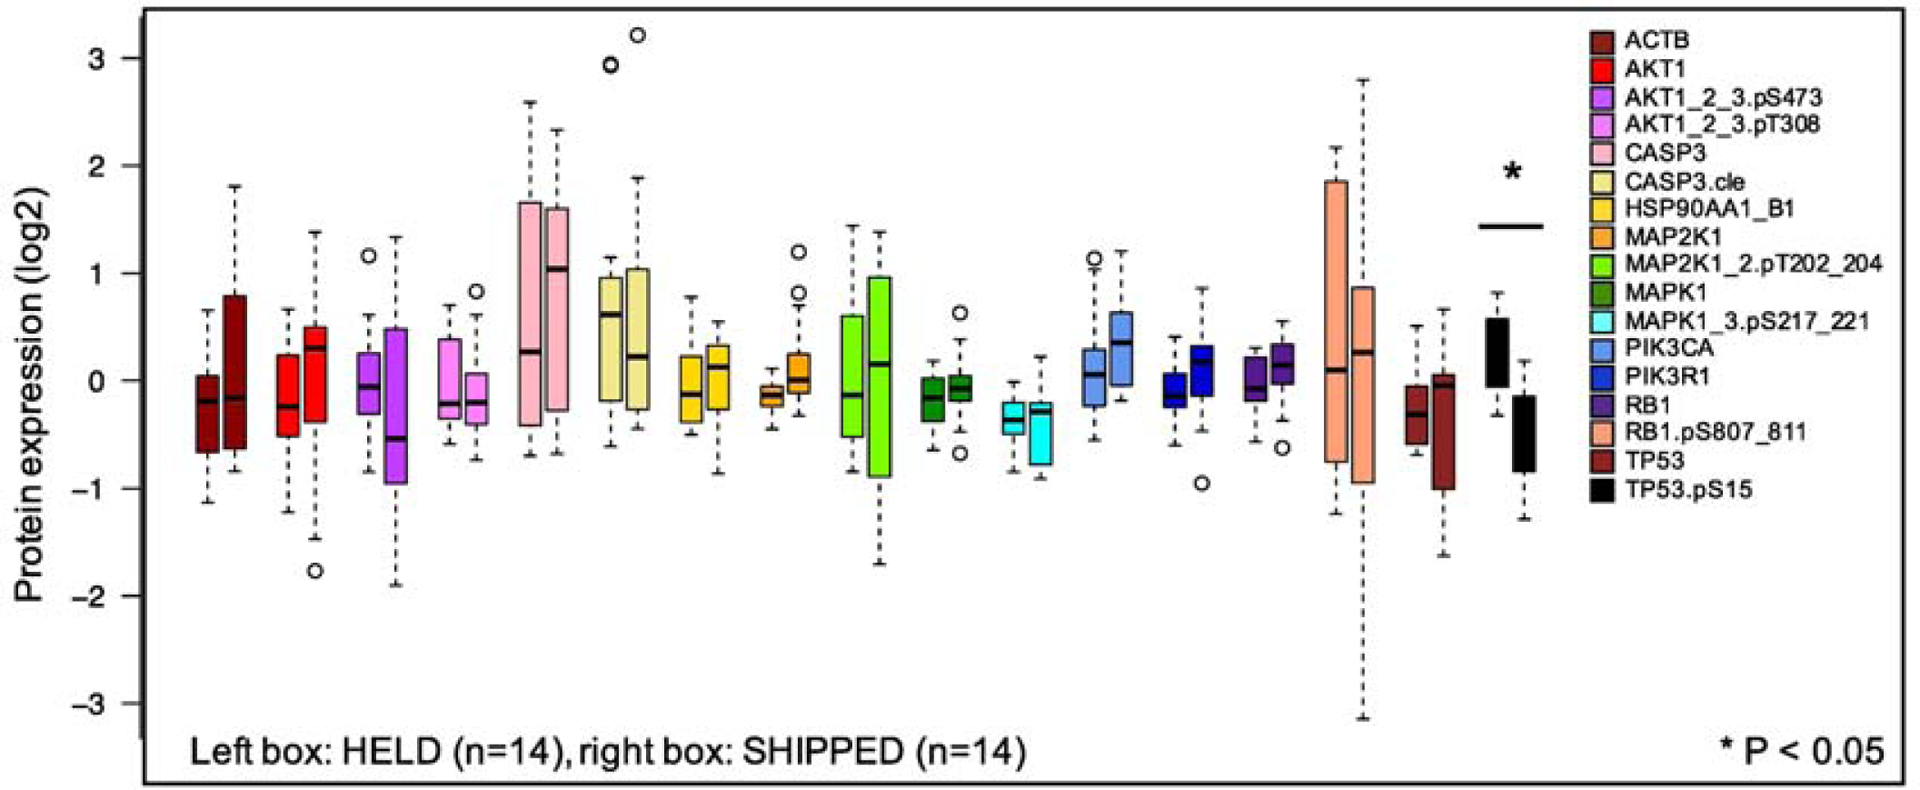
Effect of shipping on protein concentration distributions. Seven primary pediatric AML samples comparing HELD (Conditions 2 and 3) vs SHIPPED (Conditions 4 and 5). Protein concentrations were measured for 17 antibodies, including 6 phosphorylated proteins and one cleaved site (caspase 3). Left bar represents each protein that was HELD at site 1 (not shipped) and the right bar is the sample that was shipped to Site 2. Open circles define “outliers” that are > 1.5 times the interquartile range above the upper quartile or below the lower quartile. Statistically significant differences are noted by *(Wilcoxon rank sum test, FDR-adjusted p-value < 0.05).
Next, median protein concentrations for proteins at 4°C were compared with samples at ambient temperature. Neither the protein concentration distributions for the held samples (Condition 2 vs 3, Supplemental Figure 1B, left) nor the shipped samples (Condition 4 vs 5, Supplemental Figure 1B, right), at either 4°C or ambient temperature, were statistically different. Since there was no statistical effect for temperature at either site, we combined samples at 4°C (n=14) with those at ambient temperature (n=14). In the combined data set, there was no significant difference in protein concentration distributions between the samples at different temperatures (Figure 3). The largest change was in the median concentration of Rb1.pS807_811, which went from median log2 of 0.41 to a median log2 of −0.16 when comparing 4°C to ambient temperature. Other proteins show a median change in protein concentration of log2 <0.5.
Figure 3:
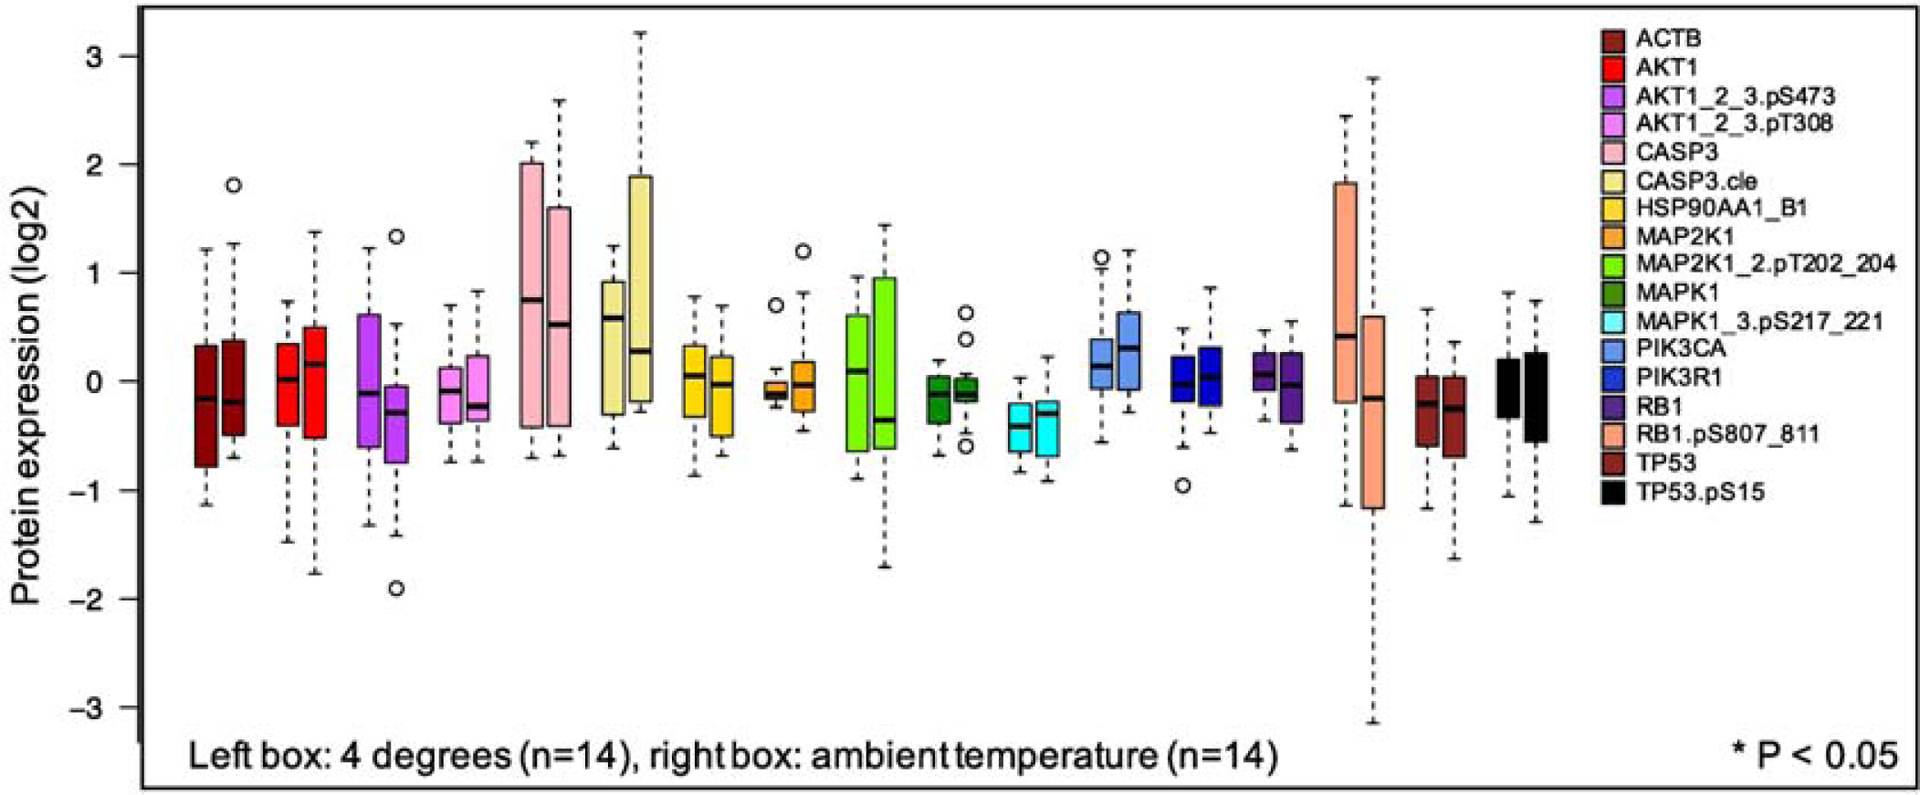
Effect of temperature on protein concentration distributions. Seven primary pediatric AML comparing 4°C (Conditions 2 and 4) to ambient temperature (Conditions 3 and 5). Protein concentrations were measured for 17 antibodies as in Figure 2. Left bar represents each protein at 4°C (HELD + SHIPPED); right bar is the protein concentration distribution for ambient temperature (HELD + SHIPPED). There were no statistically significant differences at the p <0.05 threshold (Wilcoxon rank sum test, FDR corrected).
Effects of transit time on protein concentration
Thirdly, we determined if transit time, i.e. time from sample collection to the start of sample processing, affected median protein concentrations. Based on the 7-patient AML data set from experiment 1, Figure 4 shows that protein concentration distributions for the 17 proteins showed little change over increasing transit times in shipped samples, with no statistically significant differences between immediate processing (Condition 1) and those with processing times of either 24–48h or 48–72h. Two proteins, phoshpo-PI3Kp.serine85 (p=0.04) and AKT (p=0.04), showed significant differences between protein concentrations after 24–48h vs 48–72h, with lower expression at 48–72h in both cases (median log2=0.05, log2 =0.23, log2=−0.26 for phospho-PI3Kp.serine85 and median log2= 0.25, dropping to log2= 0.57 for AKT). Phospho-Rb (pink bars) showed a large variation in protein concentration distribution at 24–48h, but had less variability at longer time periods. Processing time did not significantly affect phospho-TP53, the protein-PTM that was shown earlier to be affected by shipment.
Figure 4:
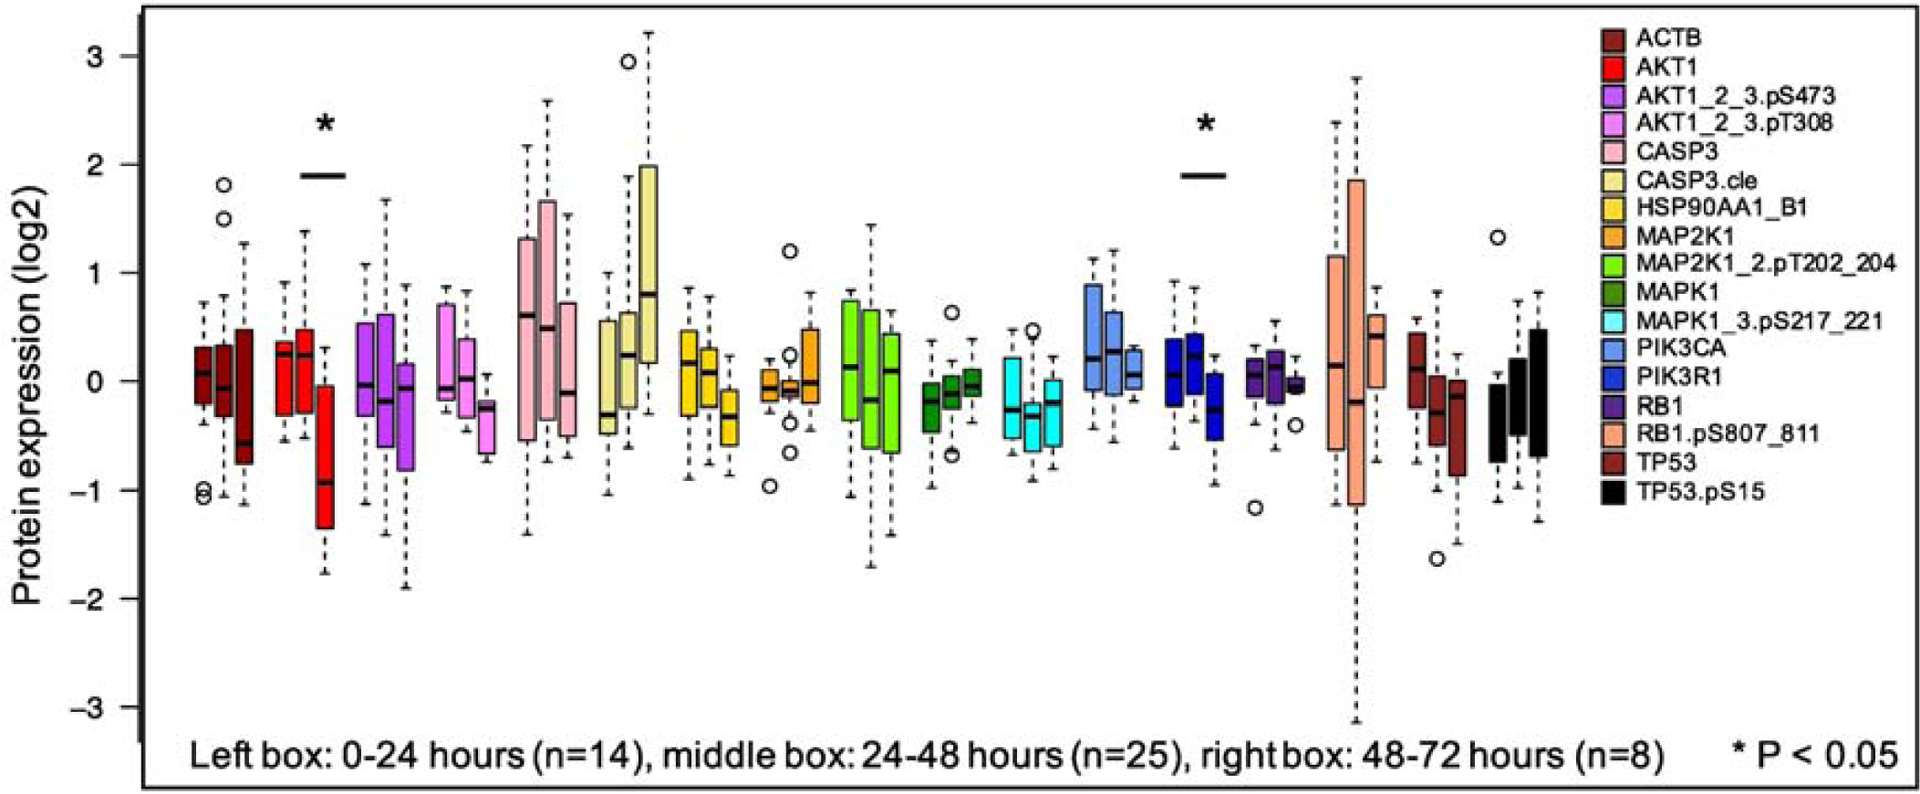
Effect of transit time on protein concentration distributions. Seven primary pediatric AML samples comparing those processed at 1–24h to those processed after 25–48h and 49–72h. Samples processed samples at 0–24h had no significant differences compared to samples processed after 24–72h (Wilcoxon rank sum test, p<0.05). AKT and PI3K85 were significantly different between 25–48h and 49–72h. There were no changes over time in other protein concentrations after FDR correction.
Effect of collection tube type on protein concentration
We next examined CS preservation tubes for their ability to preserve samples before and after chemotherapy. We hypothesized that CS tubes, which fix proteins at the time of sample collection (https://www.cellsearchctc.com), would better preserve protein expression after chemotherapy, preventing the continuing cytotoxic effects of chemotherapy drugs that could potentially change protein expression during shipment. In experiment 2, a larger set of pediatric leukemia samples (n=23) was collected prior to chemotherapy, 6–10h and 24h after the start of systemic chemotherapy (Figure 5). Samples were processed immediately (i.e. processed “immediately” after collected) (Conditions 1, 5, and 9 for CS; Conditions 4, 8, 12 for heparin), held at site 1 (i.e. processing was delayed until shipped counterparts were arrived and processed at site 2) (Conditions 2, 6 and 10) or shipped to site 2 (i.e. shipped and subsequently processed at site 2) (Conditions 3, 7 and 11). Both held and shipped samples were held/ shipped at 4°C. We compared pre-chemotherapy protein concentrations between heparin and CS tubes (Condition 1 vs 4) and there were no statistically significant differences in median protein concentrations between the tube types (Figure 6). The largest changes in median protein concentration were for AKT1_2_3.pT308, which decreased 0.53 log2 (0.12 to −0.41, p=0.06) and AKT1_2_3.pS473 (−0.02 to −0.52, p=0.37) between pre-chemotherapy CS and heparin samples. Other proteins had much smaller changes, averaging 0.22 between CS and heparin, suggesting that there are no significant differences in CS and heparin tube type sample collection in pre-chemotherapy samples.
Figure 5:
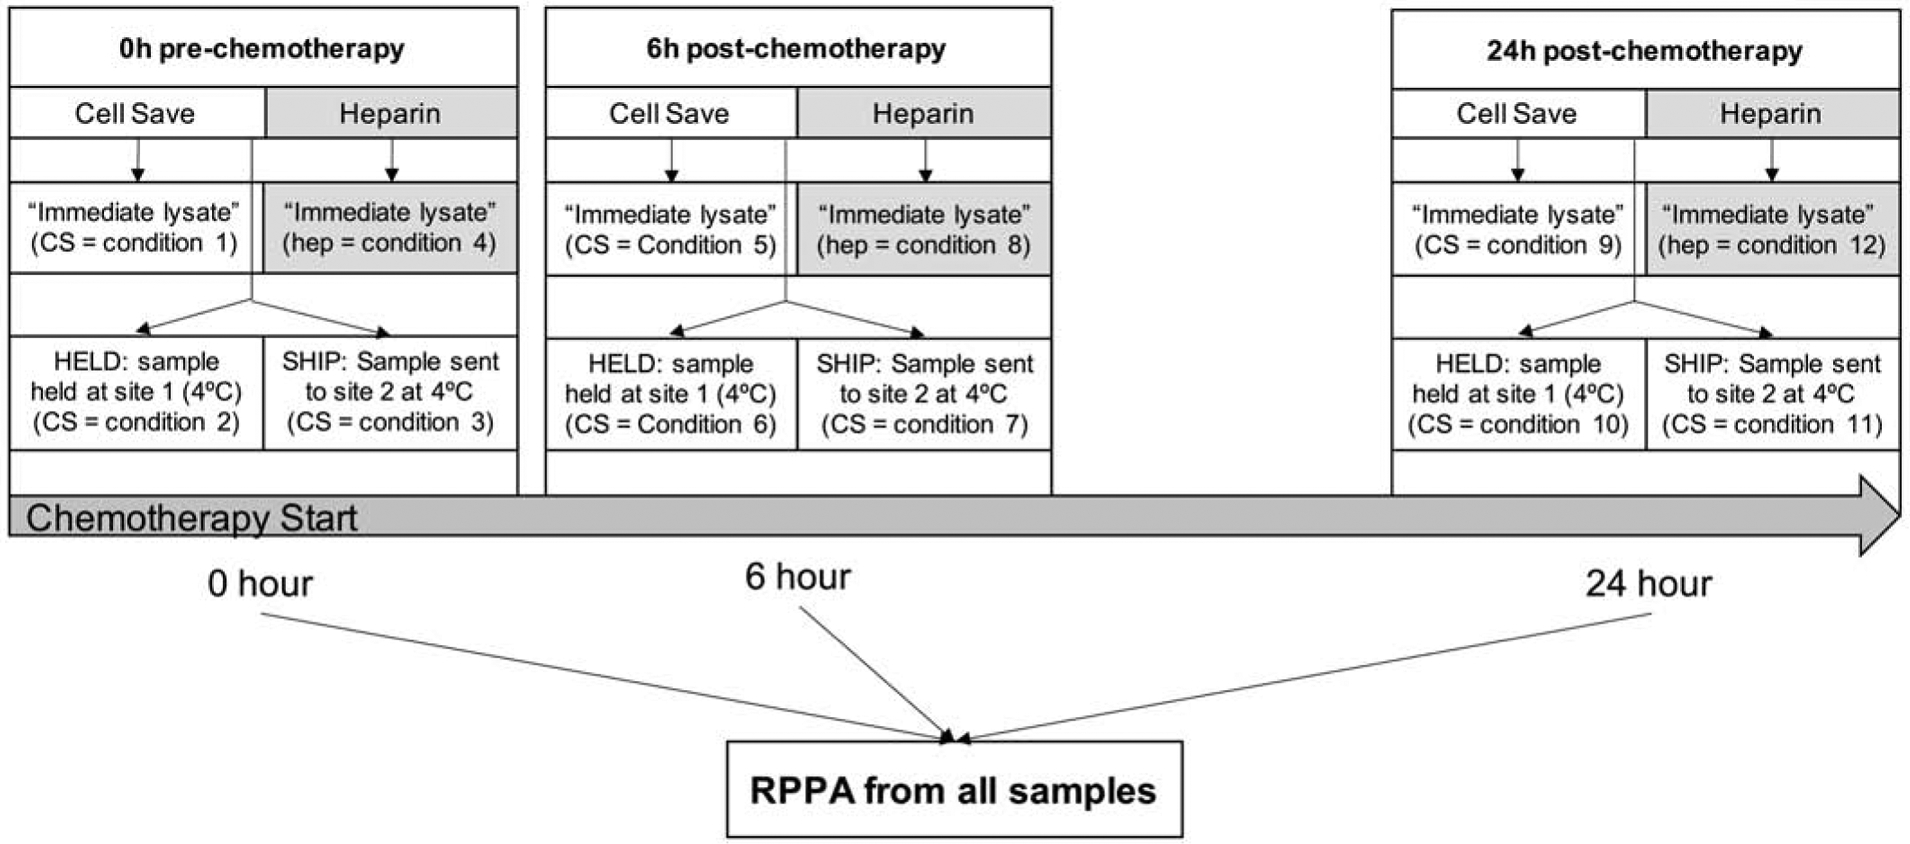
Schema of samples collected in experiment 2: Both heparin and CS tubes were collected prior to start of chemotherapy (0h). CS samples were collected at 6–10h and 24h after the start of chemotherapy. Immediate samples were processed shortly after collection at site 1. Held and shipped samples were processed at the same time at site 1 (HELD) and site 2 (SHIP). Samples were enriched by magnetic bead sorting, processed into protein lysates at the site of processing and frozen at 80°C.
Figure 6:
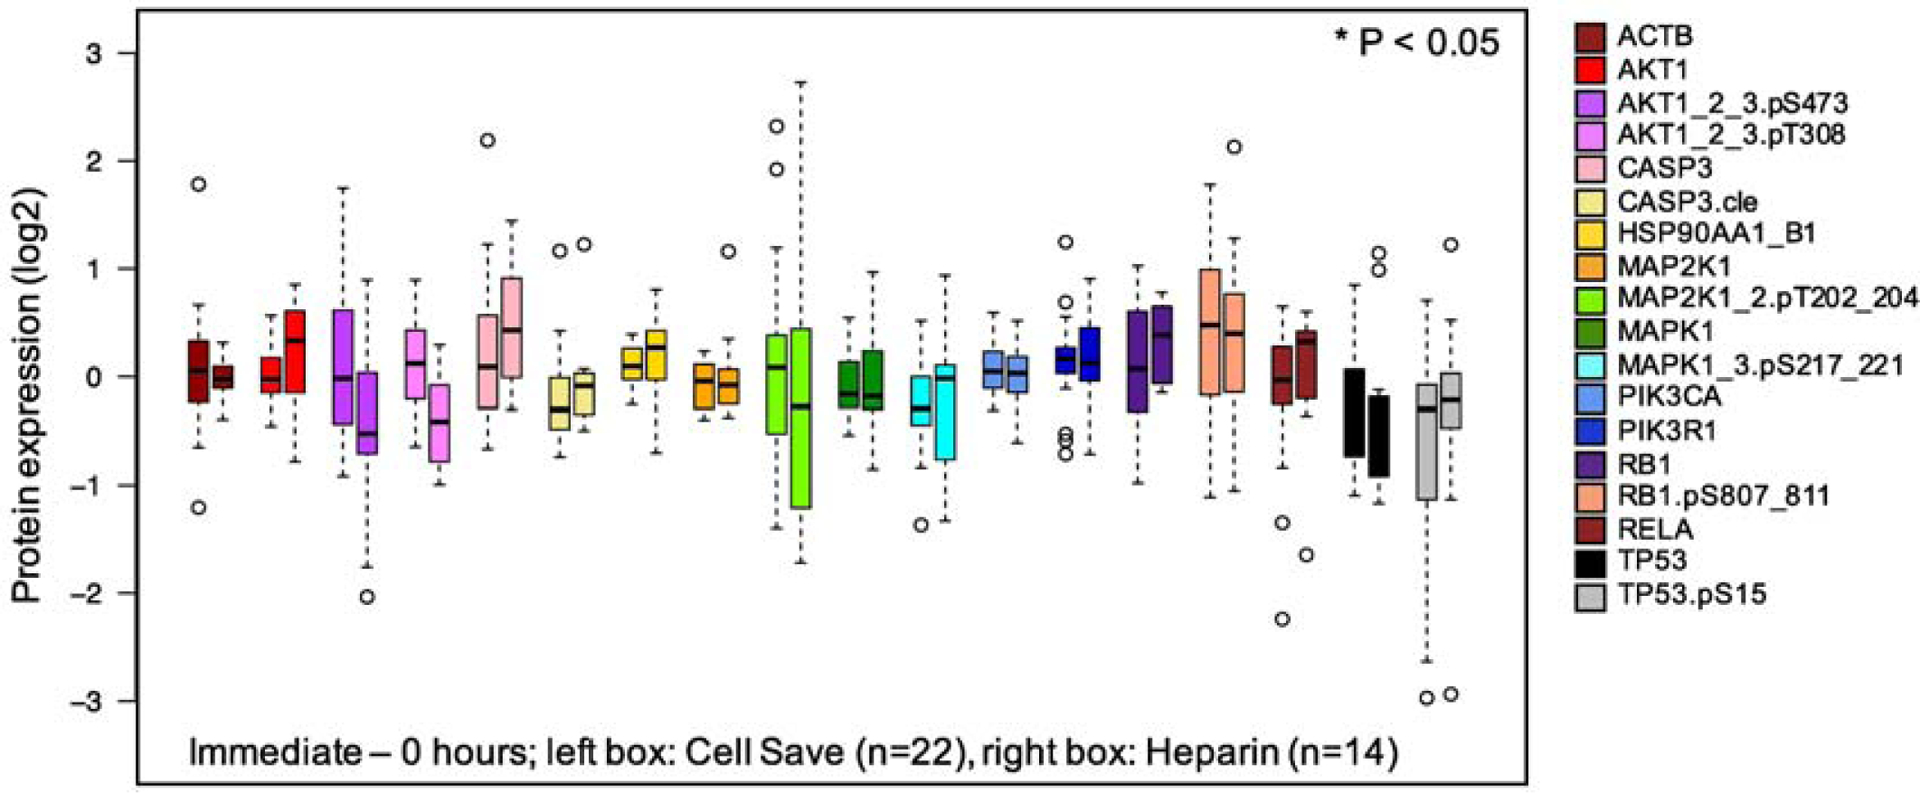
Effect of tube type on normalized protein concentrations in pre- and post-chemotherapy pediatric leukemia samples. Using 36 pediatric leukemia samples, proteins expression was compared between heparin tubes (left, n=14) and CS preservation tubes (right, n=22).
Supplemental data (Figure S2) demonstrates a large difference in protein concentrations between post-chemotherapy using CS vs heparin tubes at both 6–10h and 24h post-chemotherapy, with 10 of the 18 proteins showing statistically significant differences (p< 0.05) at 6–10h and 14 of the 18 proteins showing differences at 24h. However, when we compared differences in protein distributions in pre- and post-chemotherapy CS tubes between immediate processing and processing after 24 hours in samples that were either held (Figure 7A–C, left panel) or shipped (right panel), there was little difference in protein expression. When comparing immediate processing (Condition 1, left panel in Figure 7A and 7D) to held samples (Condition 2, right panel Figure 7A) or shipped samples (Condition 3, right panel Figure 7D) in experiment #2, we saw no significant changes in protein distributions, with the largest change occurring in held samples in RB1.pS (decrease by log2 0.67, p=0.29). Other samples had changes of < log2 0.5 regardless of transit time. For the 6–10h post-chemotherapy samples in CS tubes; two proteins had significant changes in protein concentration distributions after shipping (p-MEK (p=0.006) and HSP90 (p=0.006)) (Figure 7E). The rest of the 18 proteins (held or shipped) in CS tubes were not significantly affected. Similarly, for the samples collected 24h post-chemotherapy, two proteins showed increasing protein concentrations after shipping (p-MEK (p=0.0009) and p-ERK (p=0.005) (Figure 7F). This data suggests that, if CS tubes are used, there are minimal changes in protein expression following transit time, even in post-chemotherapy samples.
Figure 7:
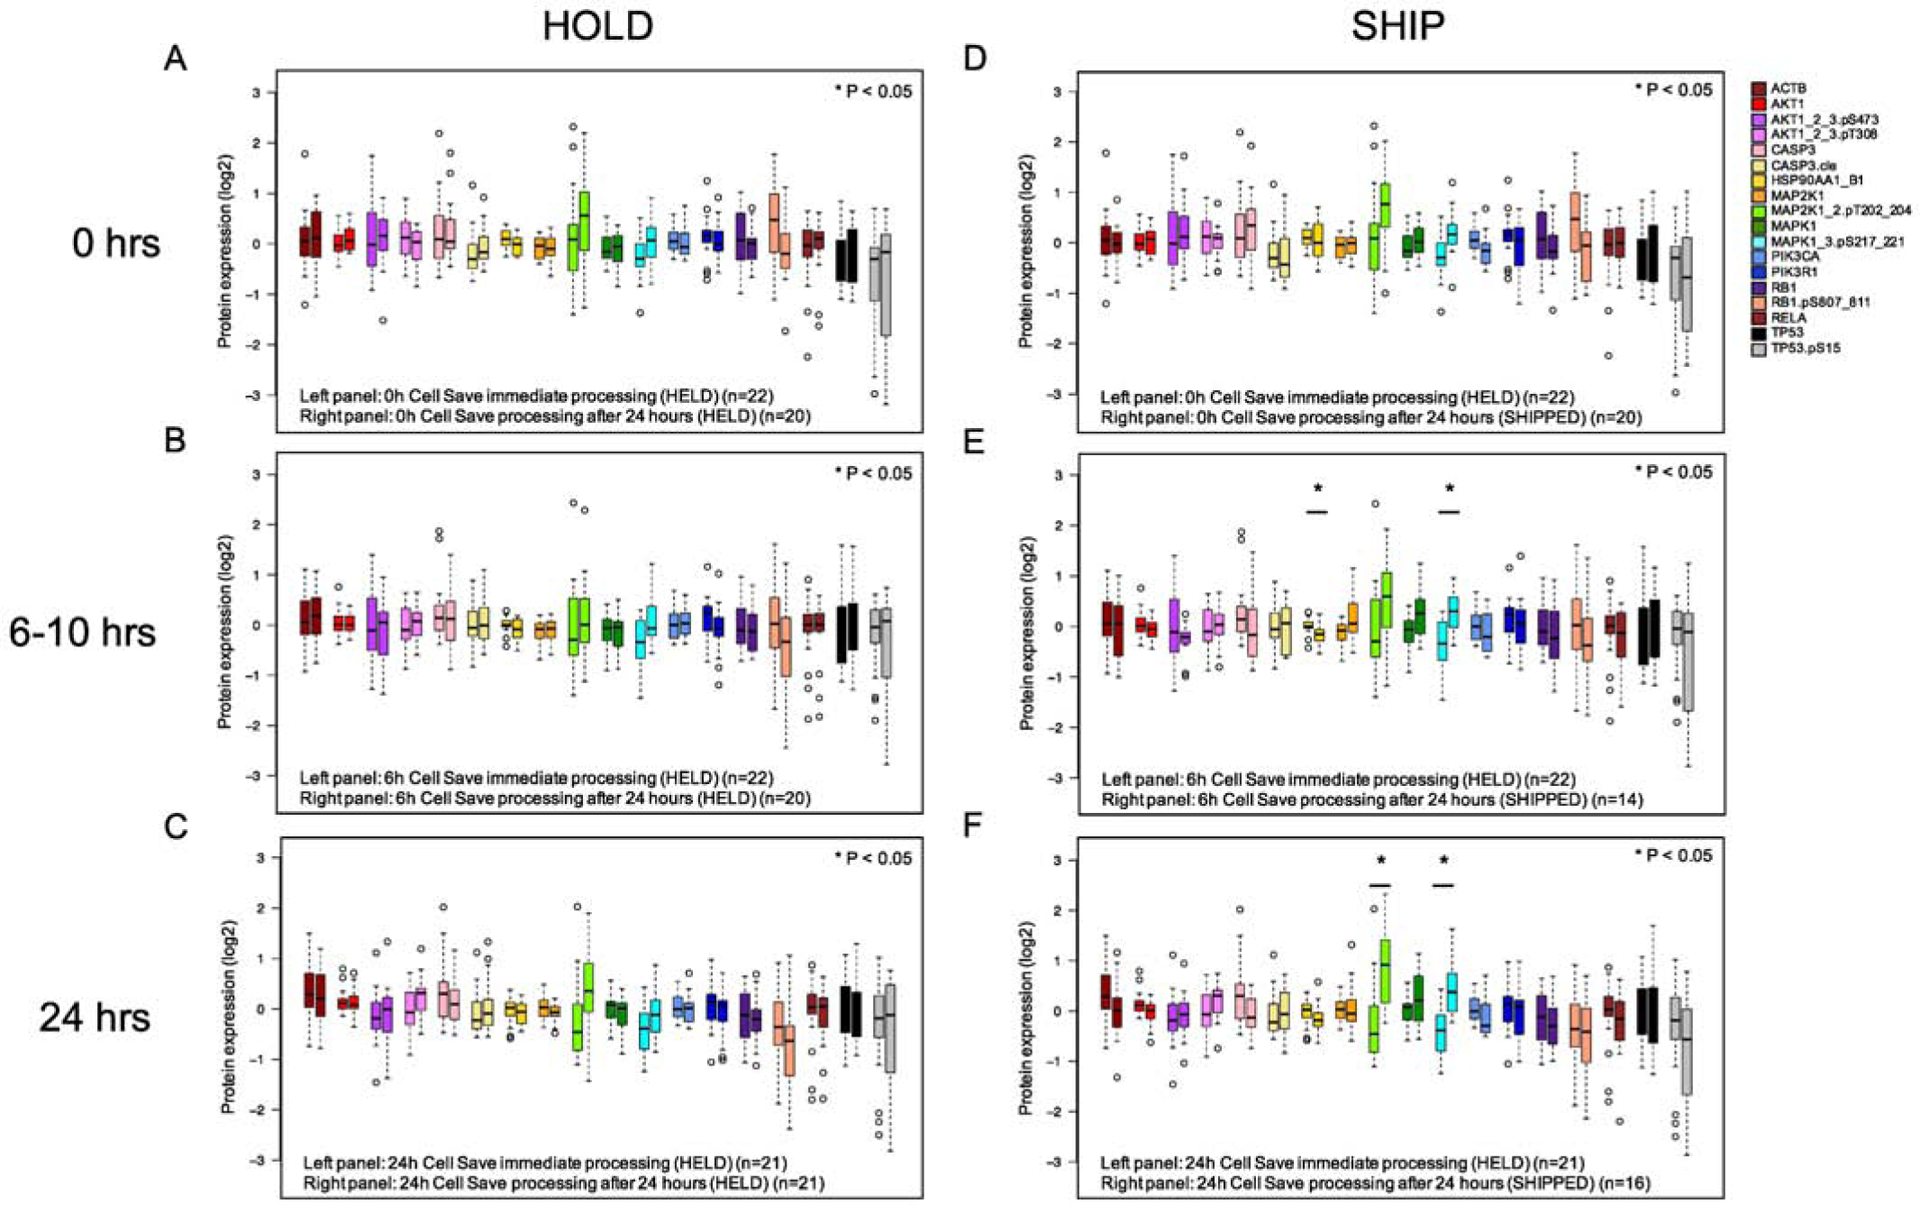
Effect of transit time on post-chemotherapy treatment protein concentrations. Blood samples from pediatric leukemia patients were collected in CS tubes and either processed immediately (left bar) or after ship/hold (right bar). A: Pre-chemotherapy samples processed immediately (n=22) vs after 24h (n=20) B: Samples were collected from patients 6h (ALL) or 10h (AML) after the start of systemic chemotherapy and processed immediately (n=22) and compared to either HELD (n=20) or SHIP (n=14). C: Samples were collected 24h after chemotherapy; immediate processing (n=21) was compared to HELD (n=21) or SHIP (n=16). Samples outside the 25–75% intervals are noted with open circles. Significant differences (p<0.05) as determined by Kruskal-Wallis are denoted by an asterisk.
Examining all CS samples with all antibodies at each time point (Figure 8) there is a good correlation between protein concentrations processed immediately and after transit time at each chemotherapy time point (R values ranged from 0.948 to 0.987 (p<0.001) This suggests that samples fixed in CS tubes are minimally affected by changes in protein concentrations due to transit time.
Figure 8:

Protein concentration differences in CS tubes between those processed immediately (n=22) and those processed after 6h and 24h post-chemotherapy (n=20). Distribution of samples as a scatter plot of immediate process (x-axis) vs delayed processing after shipment. Samples were collected from patients before chemotherapy (left), 6h (middle) and 24h (right) after start of systemic chemotherapy.
Comparison of combined preanalytical variables
We compared AML pre-chemotherapy samples (condition 1) using unsupervised clustering to determine if shipping, temperature, tube type or transit time adversely affected protein concentration distributions for each patient (Figure 9). Based on hierarchical clustering and principal component analysis (PCA), we determined that individual patients had very distinct protein expression patterns that were present in all samples from that patient (Figure 9A-bottom bars-and B). This suggests that individual differences in patient protein expression are greater than changes due to preanalytical variables.
Figure 9:
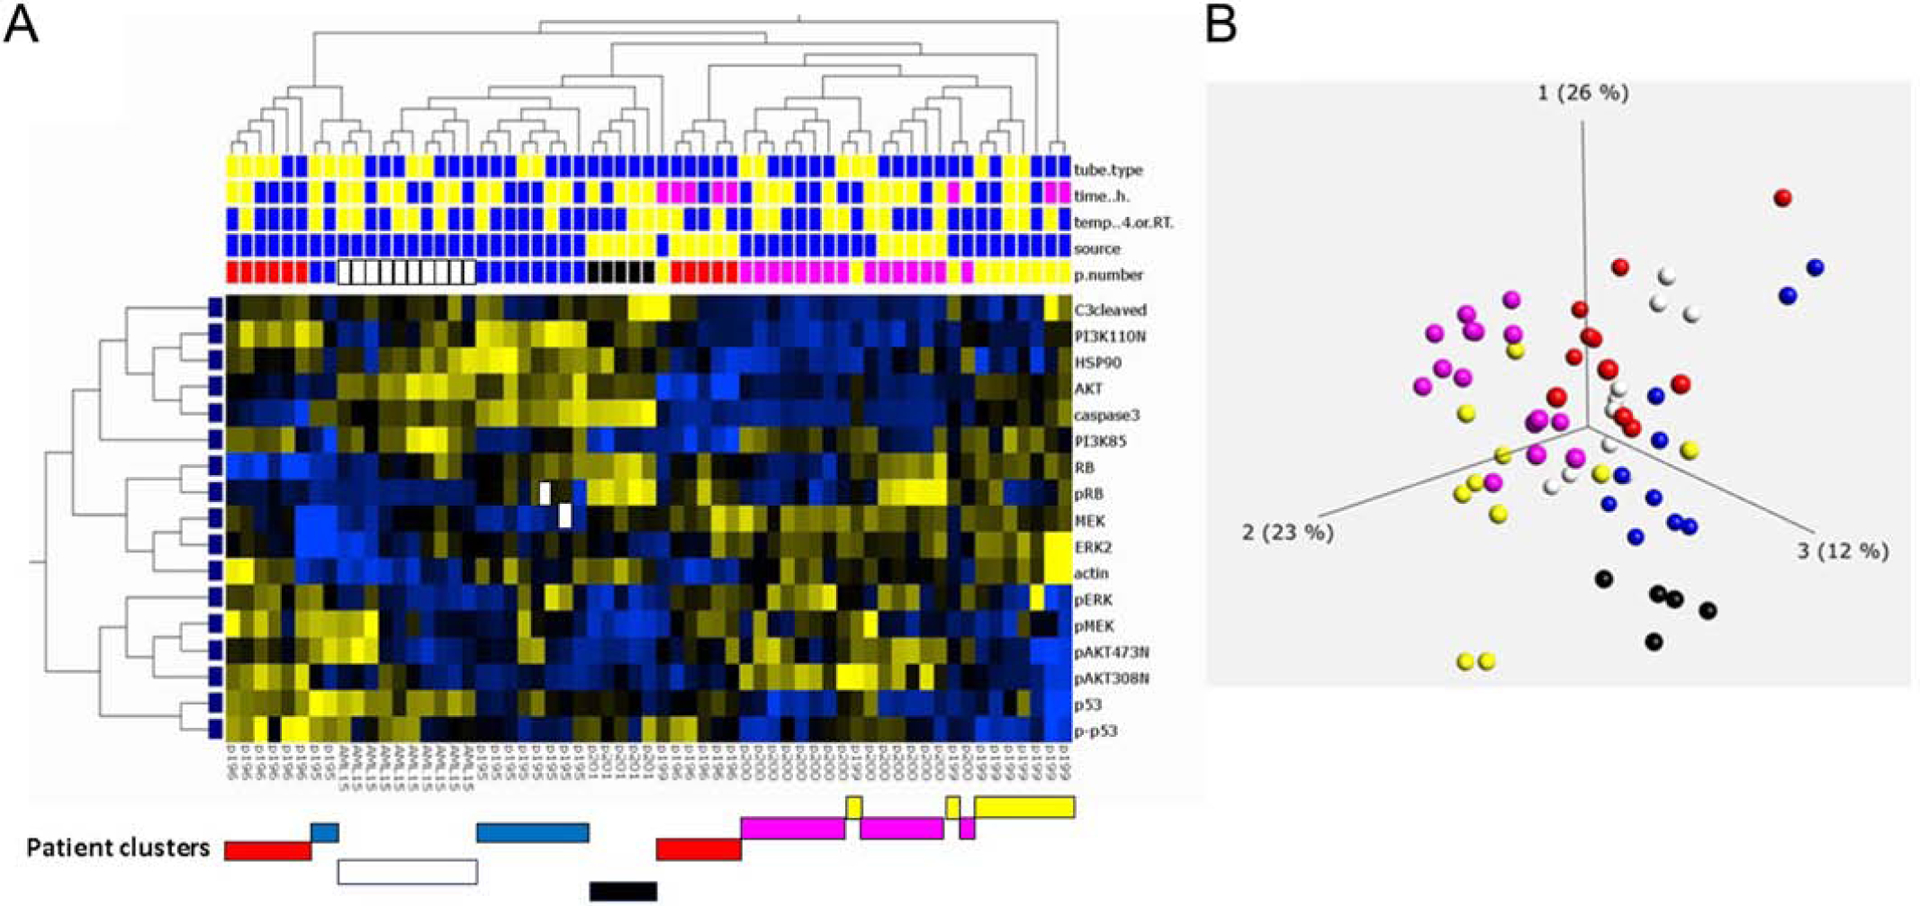
Unbiased hierarchical clustering of protein expression to assess differences between leukemia patient samples. Seven AML patients were compared using hierarchical clustering. A. Protein expression (17 proteins) was compared between patient samples and comparisons were made by tube type (top row: heparin: blue, CS: yellow), transit time (second row: blue: 0–24h, yellow: 24–48h, pink: 49–72h+), temperature (third row: blue: 4°C, yellow: ambient temperature), and tissue source (fourth row: blue-peripheral blood, yellow: bone marrow. Clustering of patient samples noted below A. Patient sample details are provided in Figure 1 and Table S2. Clustering by Qlucore analysis with p = 0.05. B. PCA analysis of same AML patient samples. Each color represents samples collected from a single patient under multiple shipping conditions as outlined in Figure 1. Patient samples cluster despite differences in processing.
Protein stability in clinical trial feasibility set
We next assessed protein concentrations in a feasibility set of shipped patient samples collected in a pediatric Phase 3 clinical trial. We reasoned that the variability in blood sample collection and processing were likely to be greater in a multi-site trial than in controlled experiments done between two laboratories. This analysis (experiment 3) examined 50 samples from 17 patients enrolled on the COG Phase 3 AAML1031 clinical trial which randomized patients to cytarabine/daunorubicin/etoposide (ADE) vs ADE with the proteasome inhibitor bortezomib (ADEB). Samples were collected on day 1 of induction at 0h, 10h and 24h from the start of systemic chemotherapy. All samples (8 treated with ADE and 9 treated with ADEB) were collected in CS tubes and shipped from collection sites in US and Canada to site 1 at 4°C. Transit times varied from 1–104h (Table S5). While there were large/ moderate changes in protein concentrations for some patients following chemotherapy (Figure 10A), other patients had relatively few changes in protein concentration despite the same chemotherapy (Figure 10B). PCA analysis of protein concentrations at three time points (Figure 10C) showed that, for 11 of the 17 patients, all three time points were clustered (examples shown with circle/ oval) and, for 6 of the 17 patients, two of three time points, usually the post-chemotherapy samples (square/rectangle), were also clustered. Many of the samples also clustered together (right side, Figure 10C) indicating roughly similar protein expression patterns as might be expected for leukemia samples.
Figure 10:
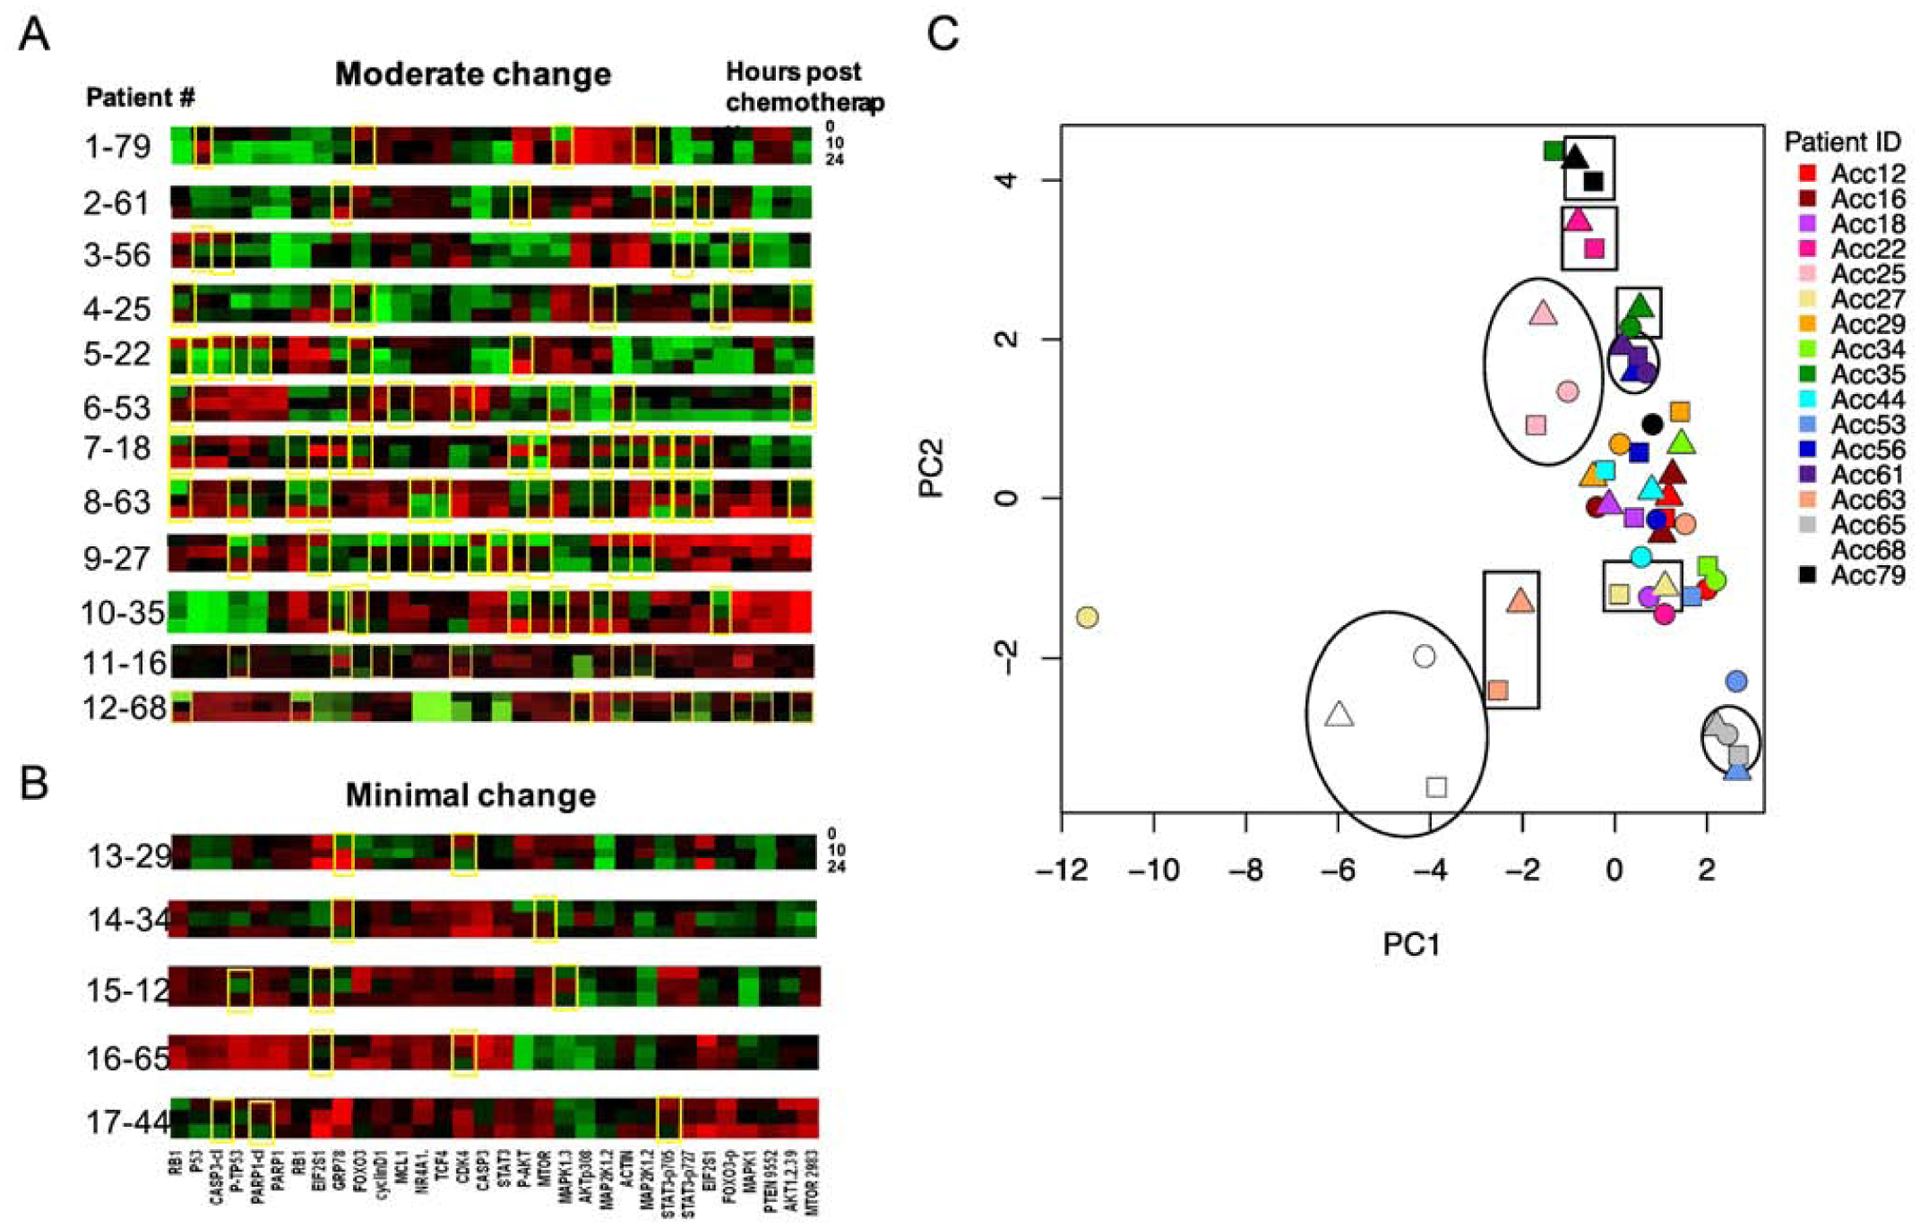
Protein expression profiles for 17 patients treated on the pediatric AML clinical trial AAML1031. A, B. Samples were collected from each patient prior to chemotherapy (0h, top line), 10h (middle line) and 24h (bottom line) following chemotherapy start. Protein expression profiles were compared at each time point. Patients with protein changes, either increased (red), or decreased (green) at 10 or 24h after treatment are noted by yellow boxes. A. Patients with frequent changes in protein expression over time (4 or more yellow boxes). B. Patients with little to no protein expression changes over time (three or fewer boxes). C. PCA analysis of protein expression by patient. Each patient was assigned a color and protein expression assessed pre-chemotherapy (circles), 10h post-chemotherapy (triangles) and 24h post-chemotherapy (squares). Representative samples with similar pre- and post-chemotherapy protein expression are noted by open circles/ovals; those with similar post-chemotherapy samples (10h and 24h) are noted by open squares/rectangles.
RPPA quality control assessment using samples obtained from a multi-center clinical trial
To test our findings on a large clinical trial data set, we performed analysis of 1515 RPPA pediatric AML samples from 501 patients enrolled on the COG AAML1031 clinical trial. All processed samples contained either >80% leukemic blasts (bulk), or underwent CD3/CD19 depletion to enrich the AML population to >80%. RPPA protein expression for 293 validated proteins were evaluated for tube type, chemotherapy treatment and transit time.
We hypothesized that if protein expression was being altered by preanalytical conditions, such as processing delays or temperature stress, this would lead to samples with a greater number of proteins with extreme expression. Identifying samples with multiple proteins having extreme expression (high or low) could be used as a mechanism to detect poor quality samples, and the “sum of extremes” for each sample could be used to assist with quality control.
We calculated the sums of extreme protein expression values for each sample, defined by having the highest or lowest 2.5% (38/1515) protein expression for each protein, across all samples and conditions. We then assessed each treatment/condition to determine how many samples were in the “extreme” range. If there was no effect of the treatment/ condition, then all conditions should have similar distributions of the sum of extremes. However, if a particular condition led to variable protein expression, we would expect to see more samples with greater extremes. Some proteins had a very tight distribution of protein concentrations and extremes in these cases might not have been related to processing artifacts. To further identify extreme protein expression, we also used a second cut-off of the sum of extremes being +/− 3SD from the mean sum of extremes. Using this cutoff, a total of 29 samples (1.9%) from 18 patients had more than 60 proteins (20%) with extreme protein expression, which were therefore excluded.
To assess whether the “sum of extremes” would be a useful surrogate marker for protein instability, we compared the sum of extremes between cell types (bulk (all mononuclear cells) vs sorted CD3/19 myeloblasts), tube type (CS vs heparin), processing time (0–48h vs >48h) and pre- and post-chemotherapy (0 vs 10h vs 24 hour) (Figure S3). The sum of extremes was similar across these variables. The small number of extremes (1.9%) and similarity in distribution (Figure 11) suggests that cell type, tube type, and chemotherapy treatment did not change protein expression to a significant degree.
Figure 11:
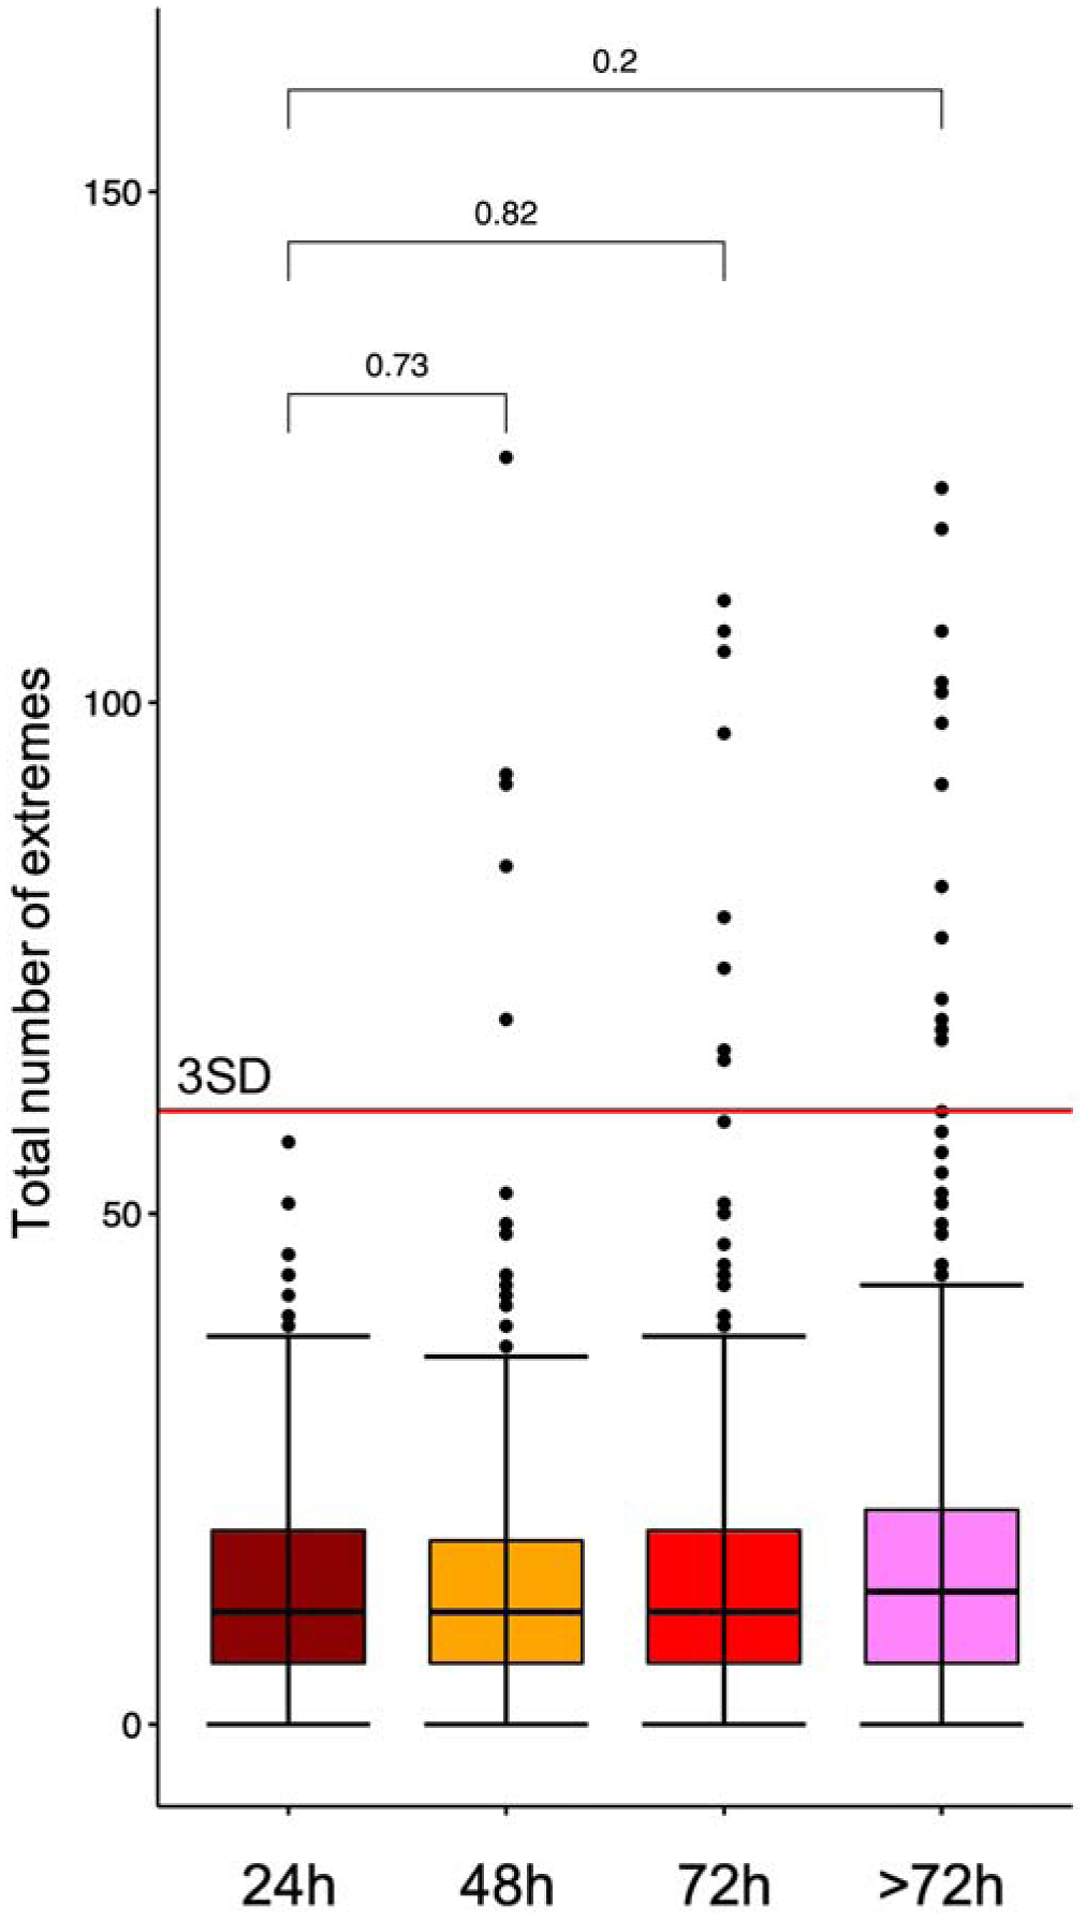
Plot of the total number of pediatric AML samples from the clinical trial AAML1031 with protein expression extremes present for each transit time. Far left: 0–24h (n=214), middle left: 25–48h (n=469), middle right: 49–72h (n=417) and far right: 72–120h (n=423). Each sample above the 75% is represented by one dot. Box-whisker plots show the median, 25%–75% boundaries, and three SD above the median protein concentration for all proteins. There were no statistically significant differences in mean number of sum of extremes between time points. Differences between transit time groups were determined by Wilcoxon signed-rank test.
We next compared the effect of transit time on the number of protein extremes to determine if there would be a cutoff time point to identify samples that consistently were adversely affected by increased transit time (Figure 11). The median sum of extremes and the 25–75% range are nearly identical between the 4 time bins (<24h, 24–48h, 48–72h, >72h), demonstrating that, for the majority of samples, transit time did not affect protein expression. However, it is clear that the number of samples with very high “sum of extremes” progressively increases with increasing transit time. No samples shipped within 24h had extremes >3SD from the mean (dotted line, Figure 11). The number of extreme samples increased slightly to 4 samples at 48h (1%), 8 samples at 72h (2%), and 13 samples at >72h (3.1%). Since most extreme samples came from the same patients, this suggested compromised collection or shipping conditions for all samples from that patient. Single values falling outside the 2.5% cutoff were not excluded, but samples with more than 20% of the proteins outside the acceptable range were excluded. There were a minimal, but increasing, number of patients with extreme protein concentrations as transit time increased. In our patient set, there were no patients with excess protein extremes at 0–24h, 2 patients at 24–48h, 4 patients at 48–72h and 5 patients at >72h. Although there was an increased number of protein extremes at >72h (Figure 11), the medians were not statistically different between 0–24h and >72h (p=0.2). This suggests that protein extremes are not exclusively identified by transit time and that protein analysis by RPPA is not significantly affected by sample transit times, particularly if prepared in <72h.
We hypothesized that, if protein expression was altered by preanalytical variables, there would be recurrent protein expression patterns identifying degraded protein states. We performed PCA analysis of the 1515 samples from the AAML1031 clinical trial. Twenty-one samples with sum of extremes > 60 clustered together displaying a unique protein expression pattern (Figure 12). Among clustered proteins that had extreme protein expression > 60, we found high AKT1, AKT1S1.pT246 and BRCA1. Although these proteins are associated with clinical risk in other cancers, here they may only indicate sample damage. The clustered samples did not correlate with clinical outcome, implying that an extreme protein expression pattern may reveal poor quality samples rather than clinically relevant differences.
Figure 12:
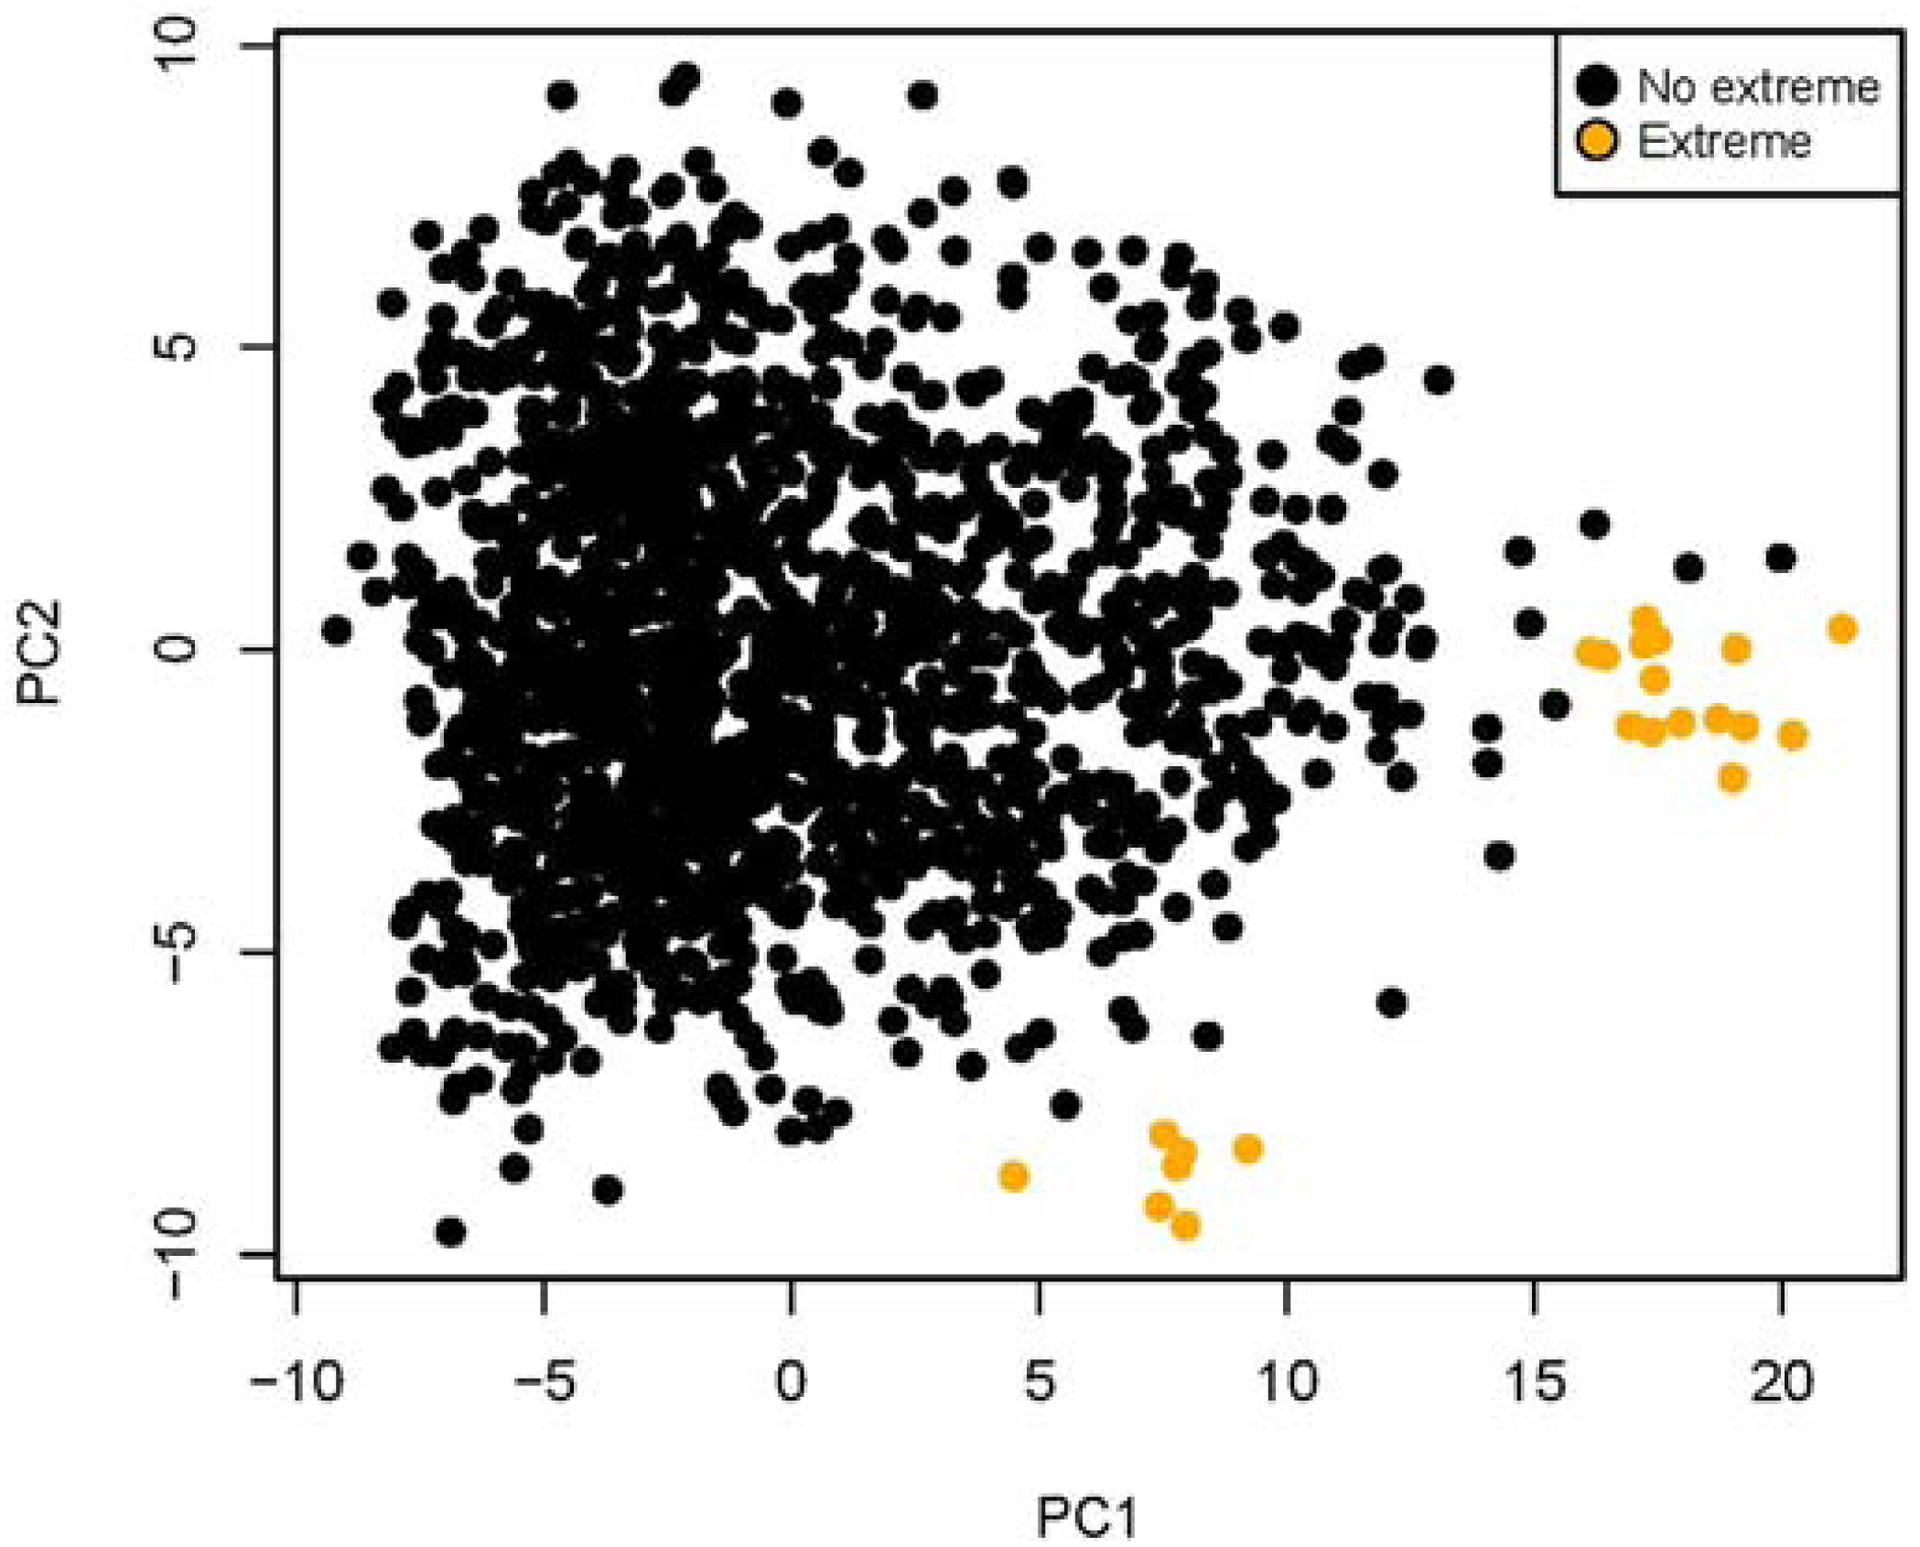
PCA analysis of protein expression in samples without protein extremes (black) vs those samples with the sum of protein extremes >60/295 (n=23/1515 samples; yellow). Samples with extremes clustered into two groups as shown.
DISCUSSION
RPPA is a highly sensitive and accurate technology that can assess hundreds of proteins and signaling nodes under the same experimental conditions using a high-throughput assessment method (>1000 samples/slide). [2,4,9] The technique is highly sensitive for low-abundance signaling proteins and has the potential to characterize deregulated interconnecting protein pathways with limited sample volumes. [4,8] Prior work has also shown that, in addition for use in biopsy specimens from solid tumors, RPPA can be used for multiplex analysis of signal transduction pathways in T lymphoblasts and T cell subsets. [17] We show that transit time (<72h), temperature (4°C or ambient temperature), tube type and shipping had minimal effects on median protein concentrations for most proteins from patient leukemia cells. These preanalytical variables likely did not affect protein concentrations, because the samples were mailed at a constant temperature (either 4°C or ambient temperature) during shipping. The constant temperature likely protected the samples from large variations that were seen in samples mailed without ice packs in FedEx trucks with no temperature control. In the few cases where there was change in protein concentration, the proteins affected were phospho-antibodies that may have been more susceptible to temperature and transit time.
We demonstrated that protein expression can be assessed post-chemotherapy if samples are collected in CS preservation tubes instead of the more standard heparin or EDTA tubes. Our data indicate that CS tubes are more stable in post-chemotherapy samples, but would have to be available at clinical sites for use prior to the start of chemotherapy. The stability of CS tubes is not unexpected since these tubes “fix” the sample and prevent further effect of drug therapy during shipping and processing. Post-chemotherapy samples are likely more sensitive to changes in temperature and shipping since many proteins have undergone oxidative damage following chemotherapy treatment with agents such as anthracyclines and epipodophylotoxins. We also demonstrate that protein expression does change in a small number of shipped samples and that these samples can be identified by extremes of protein expression. Based on this criterium, those samples can be identified and removed from further analysis. Combined with data from a COG Phase 3 clinical trial, we have generated support for the hypothesis that RPPA can be successfully employed to assess leukemia protein pathways in multi-institutional clinical trials.
Examination of a large number of samples from a Phase 3 pediatric clinical trial (n=1515 from 501 patients) largely confirmed our findings regarding the effects of shipping, transit time and temperature on protein concentration distributions. Since samples were obtained from pediatric patients, sample material was limited and a format requiring limited sample was used. Although there are RPPA platforms that require less material, such as the Zeptosens platform, [23] we chose to test a standard RPPA because it is easily available and not cost-prohibitive [9]. Using the alternative method of extreme protein expression assessment, we identified 25 samples from 28 patients (5%) with excessive sums of extremes, an indication of poor sample quality. When all 1515 samples from the clinical trial were divided into 4 transit time groups (<24h to >72h), and the sum of extremes of each sample was plotted per group no significant difference between sum of extremes between groups was observed (Figure 11). Although more samples processed after 72h had more cases with very high sums of extremes, the median protein concentration did not change, suggesting the great majority (98.4%) of samples maintained stable protein expression. Furthermore, many of the samples that had higher sums of extremes had similar protein expression patterns, suggesting that the stress of shipping induces recognizable changes of poor sample quality (Figure 12). This suggests that transit time alone should not be used as a quality control measure, but that the sum of extremes for protein expression can identify those samples that have been adversely affected by shipping. We propose that the samples with a high number of sums of extremes in protein expression should be considered unable to pass quality control and should be excluded from analysis.
The data here has implications for many leukemia clinical trials. Our data suggests that ALL and AML samples have similar stability, although the number of ALL samples in this study was limited (n=27) and further work would be needed to confirm this observation. We show that shipping temperature (4°C vs ambient temperature) had little effect on protein concentration distributions. However, based on our experience, we would recommend that samples be refrigerated prior to shipping and be shipped with at least one ice pack in a secondary shipping container. Shipping at 4°C will protect against the extreme temperature variability found in courier truck cargo bays, which has been documented to have temperature spikes of up to 127°F (53°C) for periods of up to 12h. [24] There is also previously published data demonstrating that refrigeration enhances the stability of the transcriptome. [10]
The results indicate that at least some PTM are stable during the shipping/transit process. However, the number of antibodies assessed was limited. A more thorough assessment involving a wider panel of antibodies and a broader selection of PTM (histone methylation/acetylation, cleavage forms) would be required for definitive conclusions to define the list of affected PTM.
In this study we assessed CS preservation tubes to prevent protein changes due to chemotherapy drugs during shipping/transit. CS tubes appeared to preserve protein expression both before and after chemotherapy administration (Figure 7). CS would therefore be preferred in a setting of plans to assess a time course of protein response in a clinical trial.
CONCLUSIONS
In conclusion, we have assessed preanalytical variables affection median protein concentrations for RPPA assessment. Specifically, we have determined that transit times ≤72h, temperature (4°C vs ambient temperature), tube type (heparin vs CS preservation tubes) and the shipping process have minimal effects on median protein concentrations. We have also determined that post-chemotherapy protein concentrations can be assessed in samples collected in CS preservation tubes. Importantly, based on our protein stability data for most proteins tested using shipped samples in a Phase 3 clinical trial, it is feasible to quantitate pre- and post-chemotherapy protein concentrations using RPPA in the setting of multi-site clinical trials that involve shipping of blood samples to a processing center.
Supplementary Material
File 1: Supplementary Tables S1–6 and Supplementary Figures 1 and 2.
Supplementary Table S1: Demographics for patients enrolled in the AAML1031 clinical trial
Supplementary Table S2: Treatment conditions for each RPPA array
Supplementary Table S3: Transit times and shipping conditions for samples in experiment 1
Supplementary Table S4: Diagnosis, transit times and shipping conditions for samples in experiment 2
Supplementary Table S5: Transit times for the feasibility set (clinical trial samples) in experiment group 3
Supplemental Table S6: Antibodies used for each RPPA array
Supplemental Figure 1: Median protein concentrations for HELD vs SHIPPED at either 4°C or ambient temperature.
Supplemental Figure 2: Effect of tube type on normalized protein concentrations in post-treatment pediatric leukemia samples. Proteins expression was compared between heparin tubes (left, n=14) and Cell Save preservation tubes (right, n=22). A. 6–10h after treatment. B. Twenty-four hours after the start of systemic chemotherapy treatment. Significant differences (p<0.05) as determined by Kruskal-Wallis are denoted by an asterisk.
Supplemental Figure 3: Density plots showing the sum of extremes between bulk vs CD3/19, CS vs heparin collection tubes, transit time differences or pre vs post chemotherapy.
SIGNIFICANCE.
RPPA can assess protein abundance and activation states in large numbers of samples using small amounts of material, making this method ideal for use in multi-institution clinical trials. However, there is little known about the effect of preanalytical handling variables on protein stability and the integrity of protein concentrations after sample collection and shipping. In this study, we used RPPA to assess preanalytical variables that could potentially affect protein concentrations. We found that the preanalytical variables of shipping, transit time, and temperature had minimal effects on RPPA protein concentration distributions in peripheral blood and bone marrow, demonstrating that these preanalytical variables could be successfully managed in a multi-site clinical trial setting.
Highlights.
Pre-analytical variables, including transit times ≤72h, temperature (4°C vs. ambient temperature), tube type (heparin vs. Cell Save preservation tubes) and the shipping process have minimal effects on protein concentrations determined by RPPA;
Post-treatment protein concentrations can be assessed in samples collected in Cell Save preservation tubes, but not in standard heparin tubes;
Protein samples in the setting of multi-site clinical trials that involve shipping of blood samples to a processing center, are feasible to quantitate pre- and post-treatment protein concentrations using RPPA.
ACKNOWLEDGMENTS
This work was funded by grant support from the National Institutes of Health, grants K12-CA90433, K23-CA113775, R01-CA193776, and R01-CA164024 (TMH). The work was also support by foundation awards from Hope on Wheels, Ladies Leukemia League, Millennium Pharmaceuticals (now Takeda) and the Texas Children’s Cancer Center (TMH). The AAML1031 study was funded by grants U10-CA98543, U10-CA98413, U10-CA180886, 1U24-CA196173 and U10-CA180899 from the National Institutes of Health, and by St. Baldrick’s Foundation.
Footnotes
Publisher's Disclaimer: This is a PDF file of an unedited manuscript that has been accepted for publication. As a service to our customers we are providing this early version of the manuscript. The manuscript will undergo copyediting, typesetting, and review of the resulting proof before it is published in its final form. Please note that during the production process errors may be discovered which could affect the content, and all legal disclaimers that apply to the journal pertain.
Reference List
- [1].Accordi B, Espina V, Giordan M, VanMeter A, Milani G, Galla L, Ruzzene M, Sciro M, Trentin L, De Maria R, te Kronnie G, Petricoin E, Liotta L, Basso G. Functional protein network activation mapping reveals new potential molecular drug targets for poor prognosis pediatric BCP-ALL. PLoS.One 2010;5:e13552. [DOI] [PMC free article] [PubMed] [Google Scholar]
- [2].Nishizuka SS, Mills GB. New era of integrated cancer biomarker discovery using reverse-phase protein arrays. Drug Metab Pharmacokinet 2016;31:35–45. [DOI] [PubMed] [Google Scholar]
- [3].Mueller C, Liotta LA, Espina V. Reverse phase protein microarrays advance to use in clinical trials. Mol Oncol 2010;4:461–481. [DOI] [PMC free article] [PubMed] [Google Scholar]
- [4].Boellner S, Becker KF. Reverse Phase Protein Arrays-Quantitative Assessment of Multiple Biomarkers in Biopsies for Clinical Use. Microarrays (Basel) 2015;4:98–114. [DOI] [PMC free article] [PubMed] [Google Scholar]
- [5].Charboneau L, Tory H, Chen T, Winters M, Petricoen EF 3rd, Liotta LA, Paweletz CP. Utility of reverse phase protein arrays: applications to signalling pathways and human body arrays. Brief Funct Genomic Proteomic 2002;1:305–315. [DOI] [PubMed] [Google Scholar]
- [6].Dawson MA, Prinjha RK, Dittmann A, Giotopoulos G, Bantscheff M, Chan WI, Robson SC, Chun CW, Hopf C, Savitski MM, Huthmacher C, Gudgin E, Lugo D, Beinke S, Chapman TD, Roberts EJ, Soden PE, Auger KR, Mirguet O, Doehner K, Delwel R, Burnett AK, Jeffrey P, Drewes G, Lee K, Huntly BJ, Kouzarides T. Inhibition of BET recruitment to chromatin as an effective treatment for MLL-fusion leukaemia. Nature 2011;478:529–533. [DOI] [PMC free article] [PubMed] [Google Scholar]
- [7].Zhang H, Pelech S. Using protein microarrays to study phosphorylation-mediated signal transduction. Semin Cell Dev Biol 2012;23:872–882. [DOI] [PubMed] [Google Scholar]
- [8].Gallagher RI, Espina V. Reverse phase protein arrays: mapping the path towards personalized medicine. Mol Diagn Ther 2014;18:619–630. [DOI] [PMC free article] [PubMed] [Google Scholar]
- [9].Reproducibility Byron A. and Crossplatform Validation of Reverse Phase Protein Array Data In: Yamada T, ed. Reverse Phase Protein Arrays, Advances in Experimental Medicine and Biology. Signapore: Springer; 2019:181–201. [DOI] [PubMed] [Google Scholar]
- [10].Dvinge H, Ries RE, Ilagan JO, Stirewalt DL, Meshinchi S, Bradley RK. Sample processing obscures cancer-specific alterations in leukemic transcriptomes. Proc Natl Acad Sci U.S.A 2014;111:16802–16807. [DOI] [PMC free article] [PubMed] [Google Scholar]
- [11].Pogosova-Agadjanyan EL, Moseley A, Othus M, Appelbaum FR, Chauncey TR, Chen IL, Erba HP, Godwin JE, Fang M, Kopecky KJ, List AF, Pogosov GL, Radich JP, Willman CL, Wood BL, Meshinchi S, Stirewalt DL. Impact of Specimen Heterogeneity on Biomarkers in Repository Samples from Patients with Acute Myeloid Leukemia: A SWOG Report. Biopreserv Biobank. 2018;16:42–52. [DOI] [PMC free article] [PubMed] [Google Scholar]
- [12].Insenser M, Martinez-Garcia M, Nieto RM, San-Millan JL, Escobar-Morreale HF. Impact of the storage temperature on human plasma proteomic analysis: implications for the use of human plasma collections in research. Proteomics Clin Appl. 2010;4:739–744. [DOI] [PubMed] [Google Scholar]
- [13].Tibes R, Qiu Y, Lu Y, Hennessy B, Andreeff M, Mills GB, Kornblau SM. Reverse phase protein array: validation of a novel proteomic technology and utility for analysis of primary leukemia specimens and hematopoietic stem cells. Mol Cancer Ther. 2006;5:2512–2521. [DOI] [PubMed] [Google Scholar]
- [14].Kornblau SM, Coombes KR. Use of reverse phase protein microarrays to study protein expression in leukemia: technical and methodological lessons learned In: Korf U, ed. Methods Mol Biol 785: Humana Press; 2011:141–142. [DOI] [PMC free article] [PubMed] [Google Scholar]
- [15].Hu J, He X, Baggerly KA, Coombes KR, Hennessy BT, Mills GB. Non-parametric quantification of protein lysate arrays. Bioinformatics 2007;23:1986–1994. [DOI] [PubMed] [Google Scholar]
- [16].Neeley ES, Kornblau SM, Coombes KR, Baggerly KA. Variable slope normalization of reverse phase protein arrays. Bioinformatics 2009;25:1384–1389. [DOI] [PMC free article] [PubMed] [Google Scholar]
- [17].Chan SM, Ermann J, Su L, Fathman CG, Utz PJ. Protein microarrays for multiplex analysis of signal transduction pathways. Nat Med 2004;10:1390–1396. [DOI] [PubMed] [Google Scholar]
- [18].Ellervik C, Vaught J. Preanalytical variables affecting the integrity of human biospecimens in biobanking. Clin Chem 2015;61:914–934. [DOI] [PubMed] [Google Scholar]
- [19].Negm OH, Muftah AA, Aleskandarany MA, Hamed MR, Ahmad DA, Nolan CC, Diez-Rodriguez M, Tighe PJ, Ellis IO, Rakha EA, Green AR. Clinical utility of reverse phase protein array for molecular classification of breast cancer. Breast Cancer Res Treat 2016;155:25–35. [DOI] [PubMed] [Google Scholar]
- [20].Cardnell RJ, Behrens C, Diao L, Fan Y, Tang X, Tong P, Minna JD, Mills GB, Heymach JV, Wistuba II, Wang J, Byers L. An Integrated Molecular Analysis of Lung Adenocarcinomas Identifies Potential Therapeutic Targets among TTF1-Negative Tumors, Including DNA Repair Proteins and Nrf2. Clin Cancer Res 2015;21:3480–3491. [DOI] [PMC free article] [PubMed] [Google Scholar]
- [21].Paweletz CP, Harboneau L, Bichsel VE, Simone NL, Chen T, Gillespie JW, Emmert-Buck MR, Roth MJ, Petricoin EF III, Liotta LA. Reverse phase protein microarrays which capture disease progression show activation of pro-survival pathways at the cancer invasion front. Oncogene 2001;20:1981–1989. [DOI] [PubMed] [Google Scholar]
- [22].Gündisch S, Hauck S, Sarioglu H, Schott C, Viertler C, Kap M, Schuster T, Reischauer B, Rosenberg R, Verhoef C, Mischinger HJ, Riegman P, Zatloukal K, Becker KF. Variability of protein and phosphoprotein levels in clinical tissue specimens during the preanalytical phase. J Proteome Res 2012;11:5748–5762. [DOI] [PubMed] [Google Scholar]
- [23].Kresbach GM, Pawlak M. High Precision RPPA: Concept, Features, and Application Performance of the Integrated Zeptosens Platform. Adv Exp Med Biol 2019;1188:31–59. [DOI] [PubMed] [Google Scholar]
- [24].Schallenberger M, Lovick H, Locke J, Meyer T, Juda G. The effect of temperature exposure during shipment on a commercially available demineralized bone matrix putty. Cell Tissue Bank 2016;17:677–687. [DOI] [PMC free article] [PubMed] [Google Scholar]
Associated Data
This section collects any data citations, data availability statements, or supplementary materials included in this article.
Supplementary Materials
File 1: Supplementary Tables S1–6 and Supplementary Figures 1 and 2.
Supplementary Table S1: Demographics for patients enrolled in the AAML1031 clinical trial
Supplementary Table S2: Treatment conditions for each RPPA array
Supplementary Table S3: Transit times and shipping conditions for samples in experiment 1
Supplementary Table S4: Diagnosis, transit times and shipping conditions for samples in experiment 2
Supplementary Table S5: Transit times for the feasibility set (clinical trial samples) in experiment group 3
Supplemental Table S6: Antibodies used for each RPPA array
Supplemental Figure 1: Median protein concentrations for HELD vs SHIPPED at either 4°C or ambient temperature.
Supplemental Figure 2: Effect of tube type on normalized protein concentrations in post-treatment pediatric leukemia samples. Proteins expression was compared between heparin tubes (left, n=14) and Cell Save preservation tubes (right, n=22). A. 6–10h after treatment. B. Twenty-four hours after the start of systemic chemotherapy treatment. Significant differences (p<0.05) as determined by Kruskal-Wallis are denoted by an asterisk.
Supplemental Figure 3: Density plots showing the sum of extremes between bulk vs CD3/19, CS vs heparin collection tubes, transit time differences or pre vs post chemotherapy.


