Figure 4.
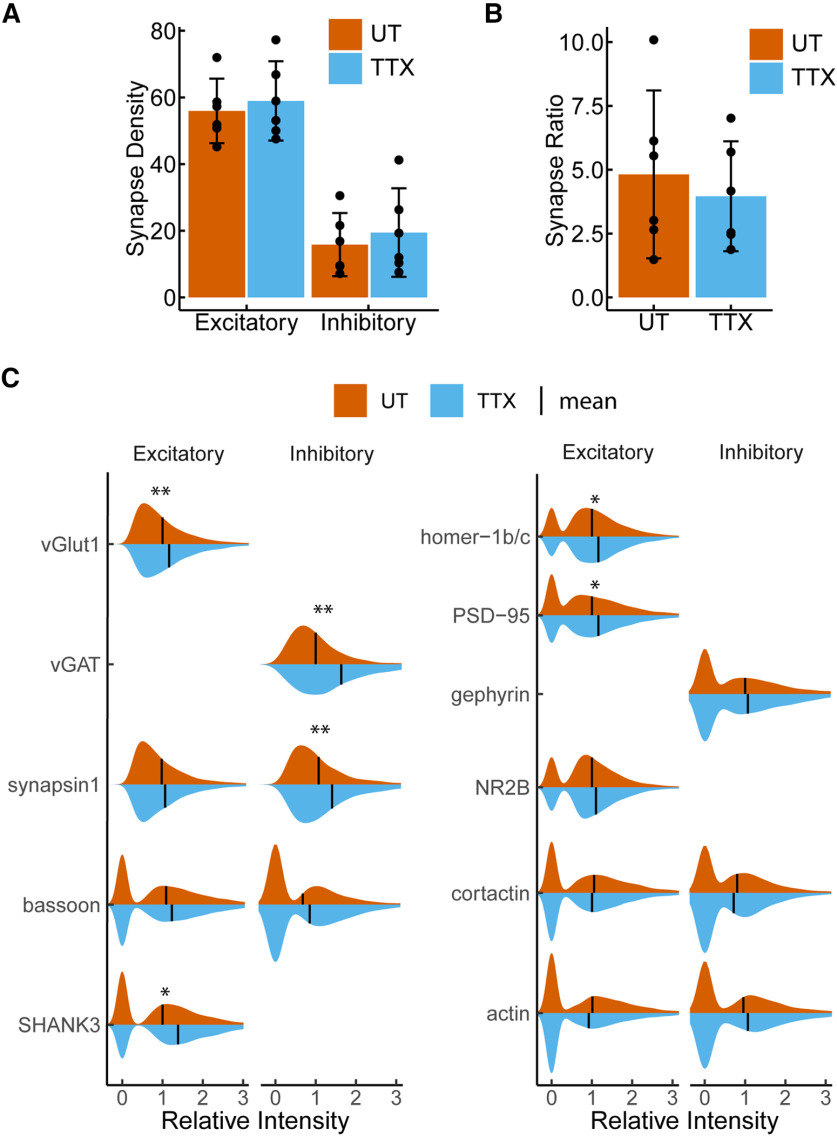
Excitatory and inhibitory synaptic density does not change in response to 48-h TTX treatment. A, Quantification of excitatory and inhibitory synaptic density from untreated (red) and TTX-treated (blue) cells. Bar height represents the mean number of synapses per 100-μm length of dendrite. B, Quantification of the excitatory:inhibitory synaptic ratio in untreated (red) and TTX-treated (blue) neurons. Bar height represents mean excitatory:inhibitory ratio. Error bars indicate 95% confidence intervals. Closed circles indicate results from individual replicates n = 6. C, Violin plots of relative synaptic intensity for synaptic targets at excitatory synapses (left) and inhibitory synapses (right) from untreated (red) and TTX-treated cells (blue). Black line indicates the mean intensity; p values are computed using Student’s t test on the mean Integrated Intensity with n = 6 (UT) and n = 5 (TTX) replicates. All values are normalized to untreated mean integrated intensity; **p < 0.01, *p < 0.05.

