Abstract
Objectives:
The objective of this study is to increase the spatial and temporal resolution of dynamic 3D MR imaging of lung volumes and diaphragm motion. To achieve this goal, we evaluate the utility of the proposed blind compressed sensing (BCS) algorithm to recover data from highly undersampled measurements.
Materials and Methods:
We evaluated the performance of the BCS scheme to recover dynamic datasets from retrospectively and prospectively undersampled measurements. We also compared its performance against view-sharing, nuclear norm minimization, and l1 Fourier sparsity regularization schemes. Quantitative experiments were performed on a healthy subject using a fully sampled 2D dataset with uniform radial sampling, which was retrospectively undersampled with 16 radial spokes per frame to correspond to an undersampling factor of 8. The images obtained from the four reconstruction schemes were compared to the fully sampled data using mean square error (MSE) and normalized high frequency (HFEN) error metrics. The schemes were also compared using prospective 3D data acquired on a Siemens 3T TIM TRIO MRI scanner on 8 healthy subjects during free breathing. Two expert cardiothoracic radiologists (R1 and R2) qualitatively evaluated the reconstructed 3D datasets using a five-point scale (0–4) on the basis of spatial resolution, temporal resolution and presence of aliasing artifacts.
Results:
The BCS scheme gives better reconstructions (MSE =0.0232 and HFEN =0.133) than other schemes in the 2D retrospective undersampling experiments, producing minimally distorted reconstructions up to an acceleration factor of 8 (16 radial spokes per frame). The prospective 3D experiments show that the BCS scheme provides visually improved reconstructions than other schemes. The BCS scheme provides improved qualitative scores over nuclear norm and l1 Fourier sparsity regularization schemes in the temporal blurring and spatial blurring categories. The qualitative scores for aliasing artifacts in the images reconstructed by nuclear norm scheme and BCS scheme are comparable.
The comparisons of the tidal volume changes also show that the BCS scheme has less temporal blurring as compared to the nuclear norm minimization scheme and the l1 Fourier sparsity regularization scheme. The minute ventilation estimated by BCS for tidal breathing in supine position (4L/min) and the measured supine inspiratory capacity (1.5L) is in good correlation with the literature. The improved performance of BCS can be explained by its ability to efficiently adapt to the data, thus providing a richer representation of the signal.
Conclusion:
The feasibility of the BCS scheme was demonstrated for dynamic 3D free breathing MRI of lung volumes and diaphragm motion. A temporal resolution of ~500ms, spatial resolution of 2.7 × 2.7 × 10mm3 with whole lung coverage (16 slices) was achieved using the BCS scheme.
Keywords: Dynamic 3D free breathing MRI, BCS, lung volume, diaphragm motion
INTRODUCTION
Dynamic imaging of respiratory mechanics plays an important role in the diagnosis of abnormalities to the active and passive components involved in respiratory pumping, including diaphragm paresis or paralysis, abnormal chest wall mechanics, and muscle weakness, which are a result of neuromuscular, pulmonary, or obesity related disorders1,2. Clinically, these impaired respiratory mechanics are evaluated indirectly by respiratory inductive plethysmography, spirometry or magnetometer3. While these schemes can be collected with very high temporal resolution, they lack spatial information and hence can only detect global changes which occur only during the advanced stages of the disease4. Early detection and localization of the disease is very crucial for treatment planning.
Magnetic resonance imaging is gaining popularity over the above techniques because it provides a non-invasive and direct visualization of dynamic changes in diaphragm and chest wall5–8 positions, without exposure to ionizing radiation. The evaluation of dynamic changes in lung volumes and diaphragm movement requires high spatial and temporal resolution, plus high volume coverage to cover the entire thorax. Achieving entire volume coverage is especially challenging in obese subjects who are at a high risk for impaired diaphragm movement. The respiratory rate during tidal breathing is 12–16 cycles per min (~5 sec per cycle), while the normal respiratory excursion of the diaphragmatic dome is about 1.5 cm9. The speed of the diaphragm is about 0.3 cm/sec. Thus considering a pixel size of 3 × 3 mm, the diaphragm position changes at a rate of 1 pixel/sec. To avoid motion-blurring, imaging time should be much shorter than 1 sec. While 2D imaging techniques can offer high temporal resolution, it is challenging to merge the information from multiple 2D slices for 3D visualization of the diaphragmatic dome and volume measurements because of the irregular nature of respiratory motion in most subjects.
Research has shown that three dimensional dynamic MRI (3D-DMRI) is a more suitable option to analyze respiratory mechanics7,10,11 and is reported to have higher correlation with spirometry measurements than 2D-DMRI12. However, current 3D-DMRI implementations offer limited temporal/spatial resolution and volume coverage. While improved resolution and coverage may be achieved by acquiring 3D volumes at multiple breath-holds, this approach does not provide good estimates of respiratory dynamics or account for the hysteresis effect that the lung exhibits during normal breathing1,7,9. Furthermore, subjects with chronic obstructive pulmonary disease (COPD) have difficulty holding their breath making motion analysis difficult. Fast imaging techniques were introduced for 3D DMRI12–14 but current schemes still compromise on either spatial resolution or the temporal resolution. For example, echo-planar imaging (EPI) based sequences provide a temporal resolution of 330ms/frame, but can only achieve low spatial resolution14 and partial lung coverage. Similarly, 3D fast low-angle shot (FLASH) sequences with Cartesian undersampling, view-sharing, and parallel imaging was used to obtain whole lung coverage12, at the expense of a poor temporal resolution of 1 second; these schemes can only be used to image the dynamics during slow and controlled breathing conditions, which limits the flexibility of experimental paradigms. More recently, higher spatiotemporal resolution was reported using a 128 channel coil array15 with a Cartesian 3D-FLASH sequence and auto-calibrated parallel acquisition (GRAPPA)16. However, these custom-made 128 channel coils are not widely available which restricts the widespread utility of this scheme.
The main focus of this work is to evaluate the feasibility of blind compressed sensing (BCS) scheme, coupled with 3D stack of stars based golden angle radial trajectories, to enable the dynamic imaging of lung volumes and the diaphragm, with full coverage of the thorax, at the spatial and temporal resolution needed to image tidal breathing. We compare the BCS scheme against other state of the art compressed sensing schemes that model the voxel profiles such as nuclear minimization based low rank reconstruction, l1 Fourier sparsity based regularization19–22 and the commonly used view-sharing reconstruction. We have two expert radiologists quantitatively score the reconstructions from all the schemes on a four-point scale to assess the diagnostic image quality.
MATERIALS AND METHODS
Image Acquisition
The institutional review board at the local institution approved all the in-vivo acquisitions. All the volunteers were fully informed of the nature of the procedure and written consent was obtained. The subjects were scanned on the Siemens 3T Trio scanner (Siemens AG, Healthcare sector, Erlangen, Germany) with a 32-channel body array coil.
Retrospectively undersampled 2D acquisition: A fully sampled 2D dynamic dataset was collected on a normal subject using a gradient recalled echo (GRE) sequence with uniform radial sampling pattern. The sequence parameters were FOV: 350 × 350mm2, slice thickness: 10mm, TR/TE: 2.67/1.17ms, and matrix size: 128 × 128. The spatial resolution was 2.7 × 2.7 × 10mm3. 180 frames were acquired with 256 radial spokes per frame, which resulted in a temporal resolution of 683ms.
Prospective 3D acquisition: 8 healthy volunteers (5 males and 3 females; median age: 28) without any evidence of pulmonary disease were included in this study. The 3D dynamic data was collected using a FLASH sequence with a 3D radial stack of stars trajectory. The 3D acquisition uses a golden angle radial trajectory in the axial plane (kx, ky) combined with a conventional phase encoding step in the kz direction. The radial spokes were separated by the golden angle (111.25°) to achieve incoherent sampling. The sequence parameters for 6 of the 8 datasets are: FOV= 350×350mm2, TR/TE= 2.37ms/0.92ms, partial Fourier factor: 6/8, base matrix size: 128×128, and spatial resolution: 2.7×2.7×10mm3. A total of 3500 radial spokes were acquired per slice and a total of 16 slices were acquired to obtain whole lung coverage. The data was binned by considering 16 radial spokes per frame resulting in a temporal resolution of 492.96 ms/frame. The coil sensitivity profiles were estimated using an Eigen decomposition method23. The 7th dataset was acquired with a larger FOV: 400×400mm2 that resulted in slightly lower spatial resolution of 3.1×3.1×10mm3. All the other scan parameters were the same as previous acquisitions. Two datasets were collected from the 8th subject, one while free breathing and one while breathing from functional residual capacity (FRC) to total lung capacity (TLC). The scan parameters for these two datasets were FOV= 350×350mm2, TR/TE= 2.37ms/0.92ms, base matrix size: 128×128, spatial resolution: 2.7×2.7×10mm3. A total of 18 slices were acquired with 3500 radial spokes per slice. 16 radial spokes were binned for each frame, which gave a temporal resolution of 683 ms for these two datasets. The scan time for each of these datasets was less than 2 min.
Image Reconstruction
In this work, we pre-interpolated the radial data points on a Cartesian grid points that were within 0.5 unit of the measured sample using linear interpolation. A similar pre-interpolation step is used in constrained reconstruction algorithms for other body part applications18,19,24. The pre-interpolation was done for all the schemes. This enabled us to use fast Fourier transforms (FFTs) and inverse FFTs in the forward and backward models of the algorithm. There was no noticeable change in the quality of reconstructions obtained from pre-interpolated data as compared to the ones obtained from non-Cartesian data with non-uniform data with non-uniform FFTs (NUFFTs) and INUFFTs.
Signal representation
The goal of the reconstruction schemes is to recover the dynamic dataset Γ from its undersampled measurements. Here, Γ is an M × N Casorati matrix, where M is number of voxels in a single time frame and N is number of time frames. In other words, the columns of Γ represent the signal at every voxel. The measurements are modeled as follows:
| (1) |
where bi is the undersampled measurement and ni is the noise for the ith time frame. , where Si is the undersampling mask, F is Fourier operator and C are the coil sensitivities. The least squares reconstruction problem can be posed as:
| (2) |
The compressed sensing schemes considered in this paper enforce different priors on the temporal profiles of the data to make the problem well posed. We discuss each of the schemes in detail below.
- Low-rank recovery using nuclear norm minimization20–22: This scheme assumes that the temporal profiles of pixels lie in a low dimensional space. Fig. 1.a reveals the low rank structure of the data where the singular values rapidly decay to zero. The problem is formulated as a convex optimization problem given below:
where λ is the regularization parameter. The nuclear norm, which is a convex relaxation of the matrix rank, is defined as , where σi are the singular values of Γ. The nuclear norm minimization scheme can be viewed as a direct alternative to classical two step low rank25 schemes, which pre-learn the temporal basis functions from navigator data and use these functions to estimate the basis images.(3) - l1 Fourier sparsity regularization: This scheme exploits the sparsity of the data in the Fourier transform domain along the temporal dimension (x-f space) (see Fig. 1.b). The convex optimization problem is formulated as:
where is the Fourier transform in the temporal direction. The l1 norm in the second term enforces sparsity on the Fourier coefficients along the temporal dimension. This approach is a widely used scheme and has similarities to k-t SPARSE26,27 and k-t FOCUSS28,29 schemes, while the specific algorithms used to solve them are different from our implementation. The recovery implicitly assumes that the intensity profiles of the voxels are sparse linear combinations of Fourier exponentials.(4) -
Blind compressed sensing (BCS)17,18 : The temporal profile for each pixel is modeled as a sparse linear combination of a atoms from a learned dictionary. Since the dictionary that is learned from the undersampled measurements is subject specific, not necessarily orthogonal and may be over-complete, it provides a richer representation of the data. The sparsity enforced on the dictionary coefficients suggests that very few temporal basis functions are sufficient to model the temporal profiles at any pixel. This results in lower degrees of freedom and hence minimizes artifacts at high acceleration factors. The data Γ is modeled as a product of the sparse coefficient matrix U and dictionary V. The signal recovery from undersampled measurements is posed as a constrained optimization algorithm as shown below:
(5) The second term is the sparsity promoting l1 norm on the coefficient matrix U. The optimization problem is constrained by imposing unit Frobenius norm on the over-complete dictionary V, which makes the recovery problem well posed and avoids scale ambiguity issues. Our experiments18 show that the joint estimation of the basis functions and its coefficients from a golden angle radial trajectory is well-posed, thanks to the oversampling of center of k-space offered by radial trajectories.
View-sharing: In this scheme, each frame of the dataset is reconstructed by combining information from a few adjacent frames. For this study we combined 200 radial spokes to reconstruct each frame with a step size of 16 to match the temporal resolution with other reconstruction schemes.
Figure 1:
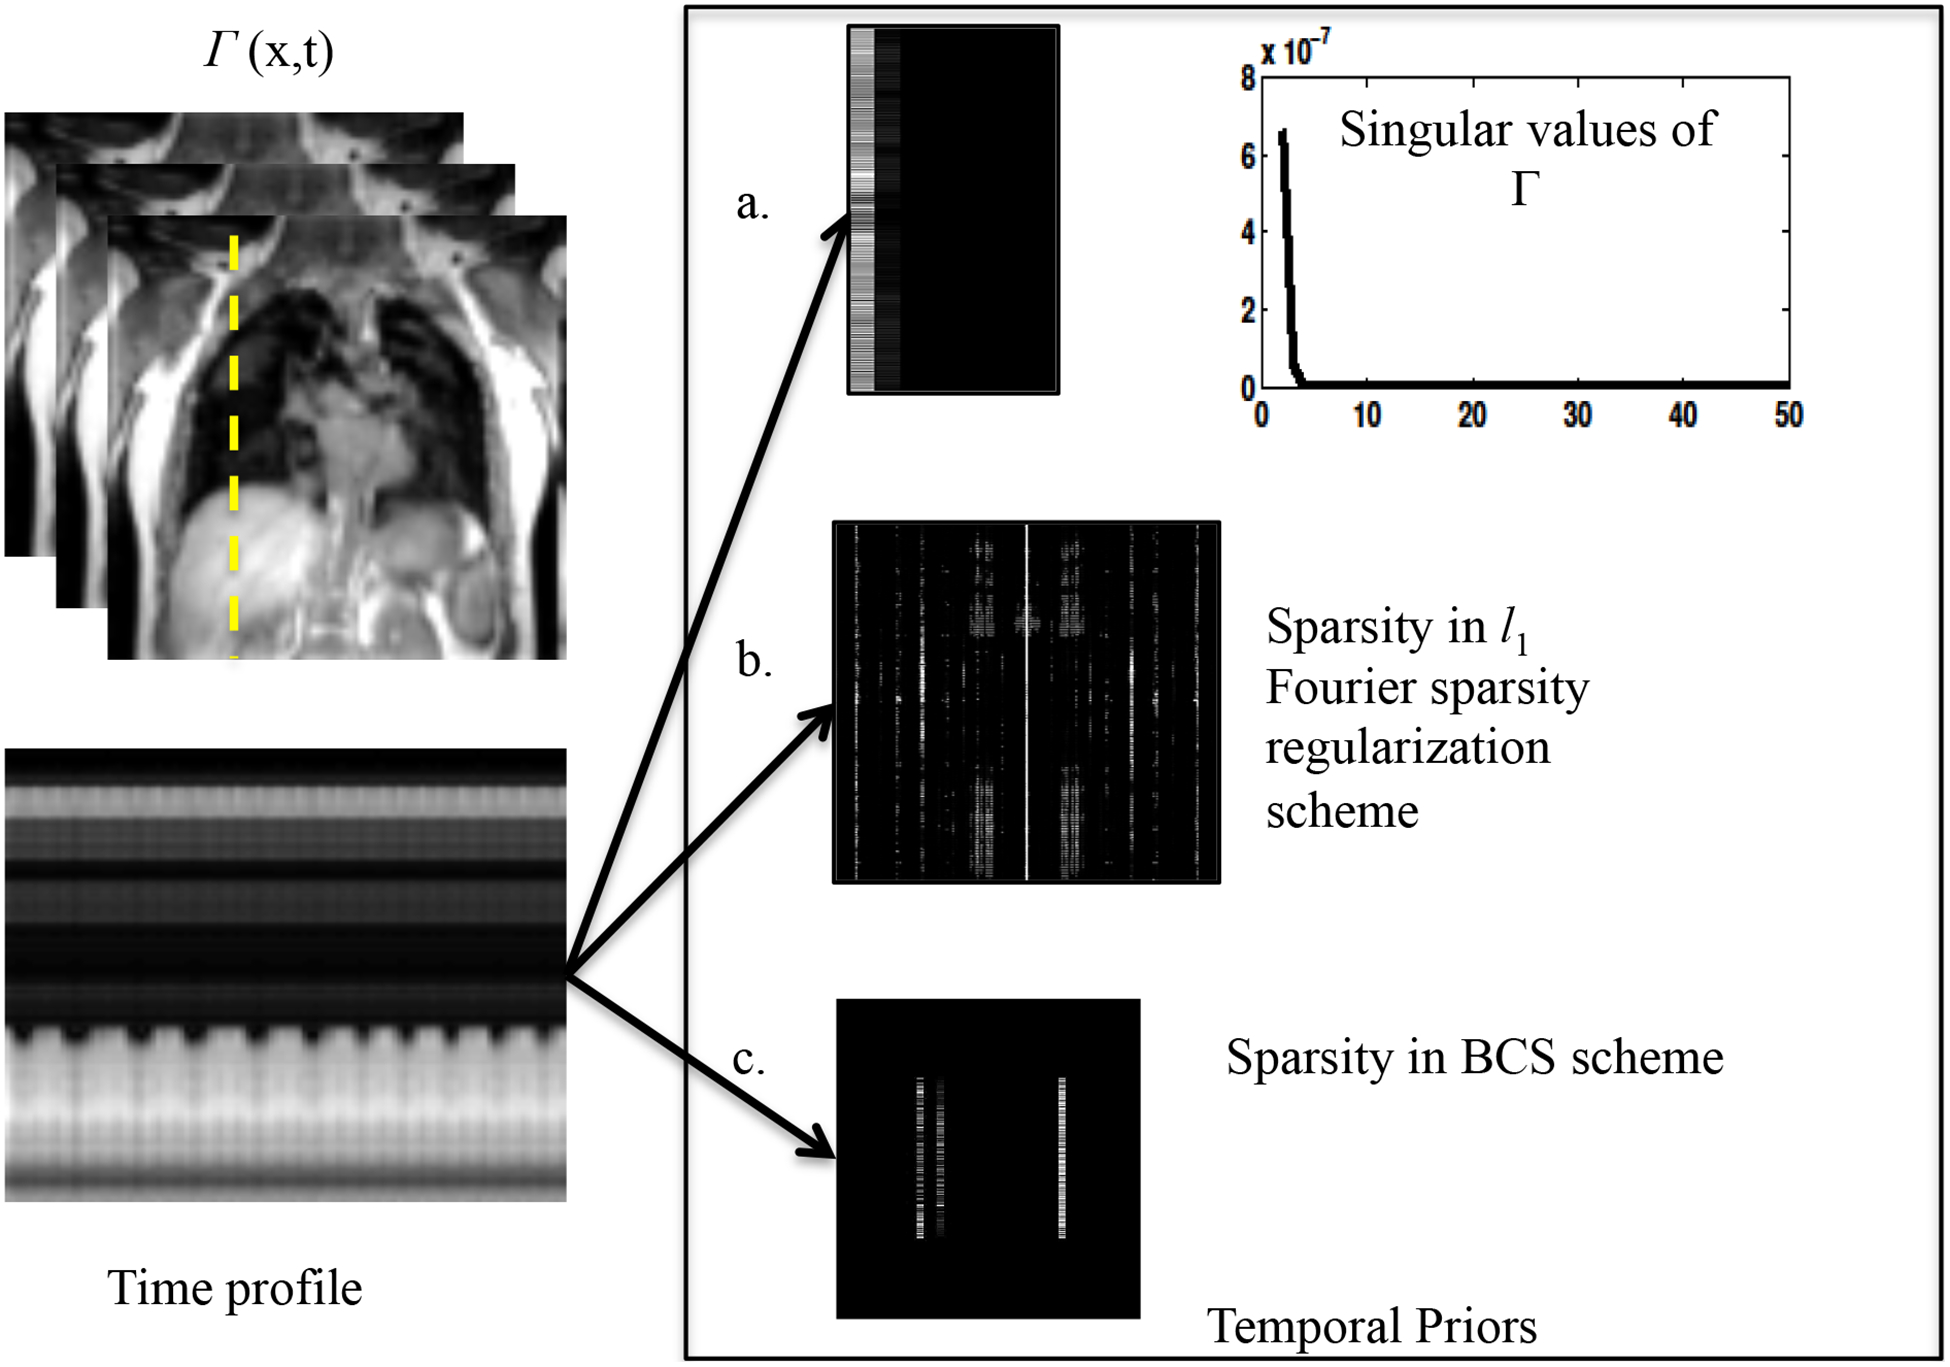
Illustration of the data representation in different transform domains: The nuclear norm minimization scheme, the l1 Fourier sparsity regularization scheme, and the BCS scheme relies on constrained modeling of the intensity profiles of the voxels, specified by Γ = UV. The nuclear norm minimization scheme capitalizes on the efficient representation of the voxel profiles using few basis functions. The coefficients in U, along with the singular values are shown in a. The singular values of the data (Γ) decay rapidly to zero indicating that the data can be represented efficiently using few basis functions. The pseudo-periodicity of the data is exploited by l1 Fourier sparsity regularization scheme, using the sparse representation of the intensity profiles in the temporal Fourier transform (x-f space) as seen in 1.b. Figure 1.c shows the sparse coefficients obtained from the BCS scheme. BCS, similar to nuclear norm minimization scheme, learns the dictionary of the basis functions from the data itself, thus adapting to the dynamic content of the time series. The adaptation of the dictionary to the signal provides sparser representations, which in turn translates to improved reconstructions.
Implementation of constrained algorithms
All the above constrained algorithms are implemented using alternating minimization algorithms; these schemes alternate between (a) a backward mapping from k-space to image space to enforce data consistency, and (b) a projection step, which is a shrinkage or projection operator. These algorithms are guaranteed to converge to the global minimum of the cost function, provided it is convex (nuclear norm and Fourier sparsity regularization, specified by (1) and (2), respectively). Due to non-linear nature of the above algorithms, coupled with a non-uniform k-space sampling, it is complex to analyze the spatial and temporal smoothing behavior of the algorithms. However, the projection step provides useful insights on how each of these schemes removes the aliasing patterns that results from the undersampling. We perform a brief analysis of the constrained algorithms to obtain more insights of the tradeoffs involved in accelerating using these schemes in the appendix A.
The discussion in appendix A shows constrained schemes that model the temporal profiles reduce aliasing artifacts by non-local view-sharing. Specifically, they recover each pixel in the dataset as a weighted linear combination of other pixels in the dataset, possibly distant from it in time. Note that this approach is drastically different from classical view-sharing schemes that combine the data from nearby frames to recover each frame; we term such classical view-sharing schemes as local to differentiate them from the non-local ones discussed above. Non-local averaging combines information from images in similar respiratory phases that are distant in time thus minimizing the temporal blurring introduced by local view-sharing schemes, while achieving good suppression of noise-like aliasing artifacts. The analysis shows that the BCS and l1 Fourier sparsity regularization schemes perform spatially varying non-local view-sharing, while the nuclear norm minimization scheme performs space invariant non-local view-sharing. The adaptation of the view-sharing strategy with the spatial location enables BCS and l1 Fourier sparsity regularization to achieve improved denoising performance.
Experiment details
The fully sampled dataset (acquired with 256 radial spokes) was retrospectively undersampled using 16 radial spokes per frame, corresponding to an acceleration factor of 8. This retrospectively undersampled dataset was reconstructed with the above mentioned nuclear norm minimization scheme, l1 Fourier sparsity regularization scheme, BCS, and standard view-sharing scheme. The reconstructed data was compared to the fully sampled acquisition. To study the performance of the BCS scheme as a function of acceleration, the 2D dataset undersampled using 20, 16, 12 and 10 radial spokes corresponding to acceleration factors of 6.4, 8, 10.2 and 12.8, respectively, was reconstructed using the BCS scheme. The slice-by-slice reconstruction was performed for all the 3D DMRI datasets using the above-mentioned schemes. All the reconstructions were performed in MATLAB on a desktop computer (Intel Xeon E5–1620 with 8 core CPUs, 3.6GHz processor and 32 GB RAM) with a 5.6 GB NVDIA graphical processing unit (GPU).
Image Quality Analysis
To compare reconstructions, we used the following metrics:
-
Mean square error (MSE):
In the 2D experiments, the fully sampled ground truth data was used as reference to calculate the reconstruction errors. The optimal regularization parameter λ was chosen such that the error between reconstructions and the fully sampled data specified by
was minimized. However, the MSE metric could not be used for the 3D experiments, as the fully sampled ground truth was not available. Hence to optimize for λ, we used the L-curve strategy30.(6) -
Normalized high frequency error metric (HFEN):
The HFEN metric31 gives a measure of spatial blurring of the image and the quality of fine features and edges. The HFEN metric is defined as:
where N is the number of pixels in the image and LoG is the Laplacian of the Gaussian filter that captures edges. The filter specifications are: kernel size 15×15 pixels, with a standard deviation of 1.5 pixels31. The regularization parameters for all the schemes were optimized using the HFEN and MSE values in case of 2D experiments.(7) -
Qualitative evaluation: clinical scoring
Each of the 3D dynamic reconstructions was evaluated for spatial resolution, temporal resolution and artifacts by two expert cardiothoracic radiologists using a four-point scale (4-Outstanding Diagnostic Quality, 3- Good Diagnostic Quality, 2- Average Diagnostic Quality, 1- Limited Diagnostic Quality and 0- un-interpretable). The image data sets were viewed using OsiriX.
Image post-processing to demonstrate the utility of 3-D DMRI
To demonstrate the potential applications of this work, the lung was segmented using a region-growing algorithm implemented in MATLAB after reconstructing the 3D dynamic data using the BCS scheme, the nuclear norm minimization scheme and the l1 Fourier sparsity regularization scheme. This analysis was done for the dataset collected with the tidal breathing maneuver on subject 8. The analysis was repeated for the same subject with deep breathing maneuver using the BCS reconstructed data. The lung volume was calculated in terms of the number of pixels within the lung region. The velocity maps of the diaphragm were obtained using optical flow method32, which was implemented using a multi-scale approach.
RESULTS
Dynamic 2D experiments: The performance of all the schemes was first evaluated by retrospectively undersampling a 2D fully sampled dataset. Fig. 2 shows a spatial frame from the dynamic 2D dataset (top row), the corresponding error images (middle row), and the time profile at a cross-section shown by the yellow line in spatial frame (last row). The columns correspond to the fully sampled dataset (first column) and the different reconstructions from retrospectively undersampled data. All the comparisons were done at an undersampling factor of 8 (using 16 radial spokes per frame). We observe that the reconstructions from the nuclear norm minimization and l1 Fourier sparsity regularization schemes suffer from spatio-temporal blurring, especially along the diaphragm borders, as indicated by the arrows in the error images. The local view-sharing scheme combines information from adjacent frames (13 adjacent frames were combined for reconstruction of each frame), which results in significant blurring of the respiratory motion as seen from the time profiles. The BCS scheme has the lowest MSE errors (0.0232) and HFEN values (0.133), which indicates superior reconstruction and less spatiotemporal blurring as compared to the other schemes.
Figure 2:
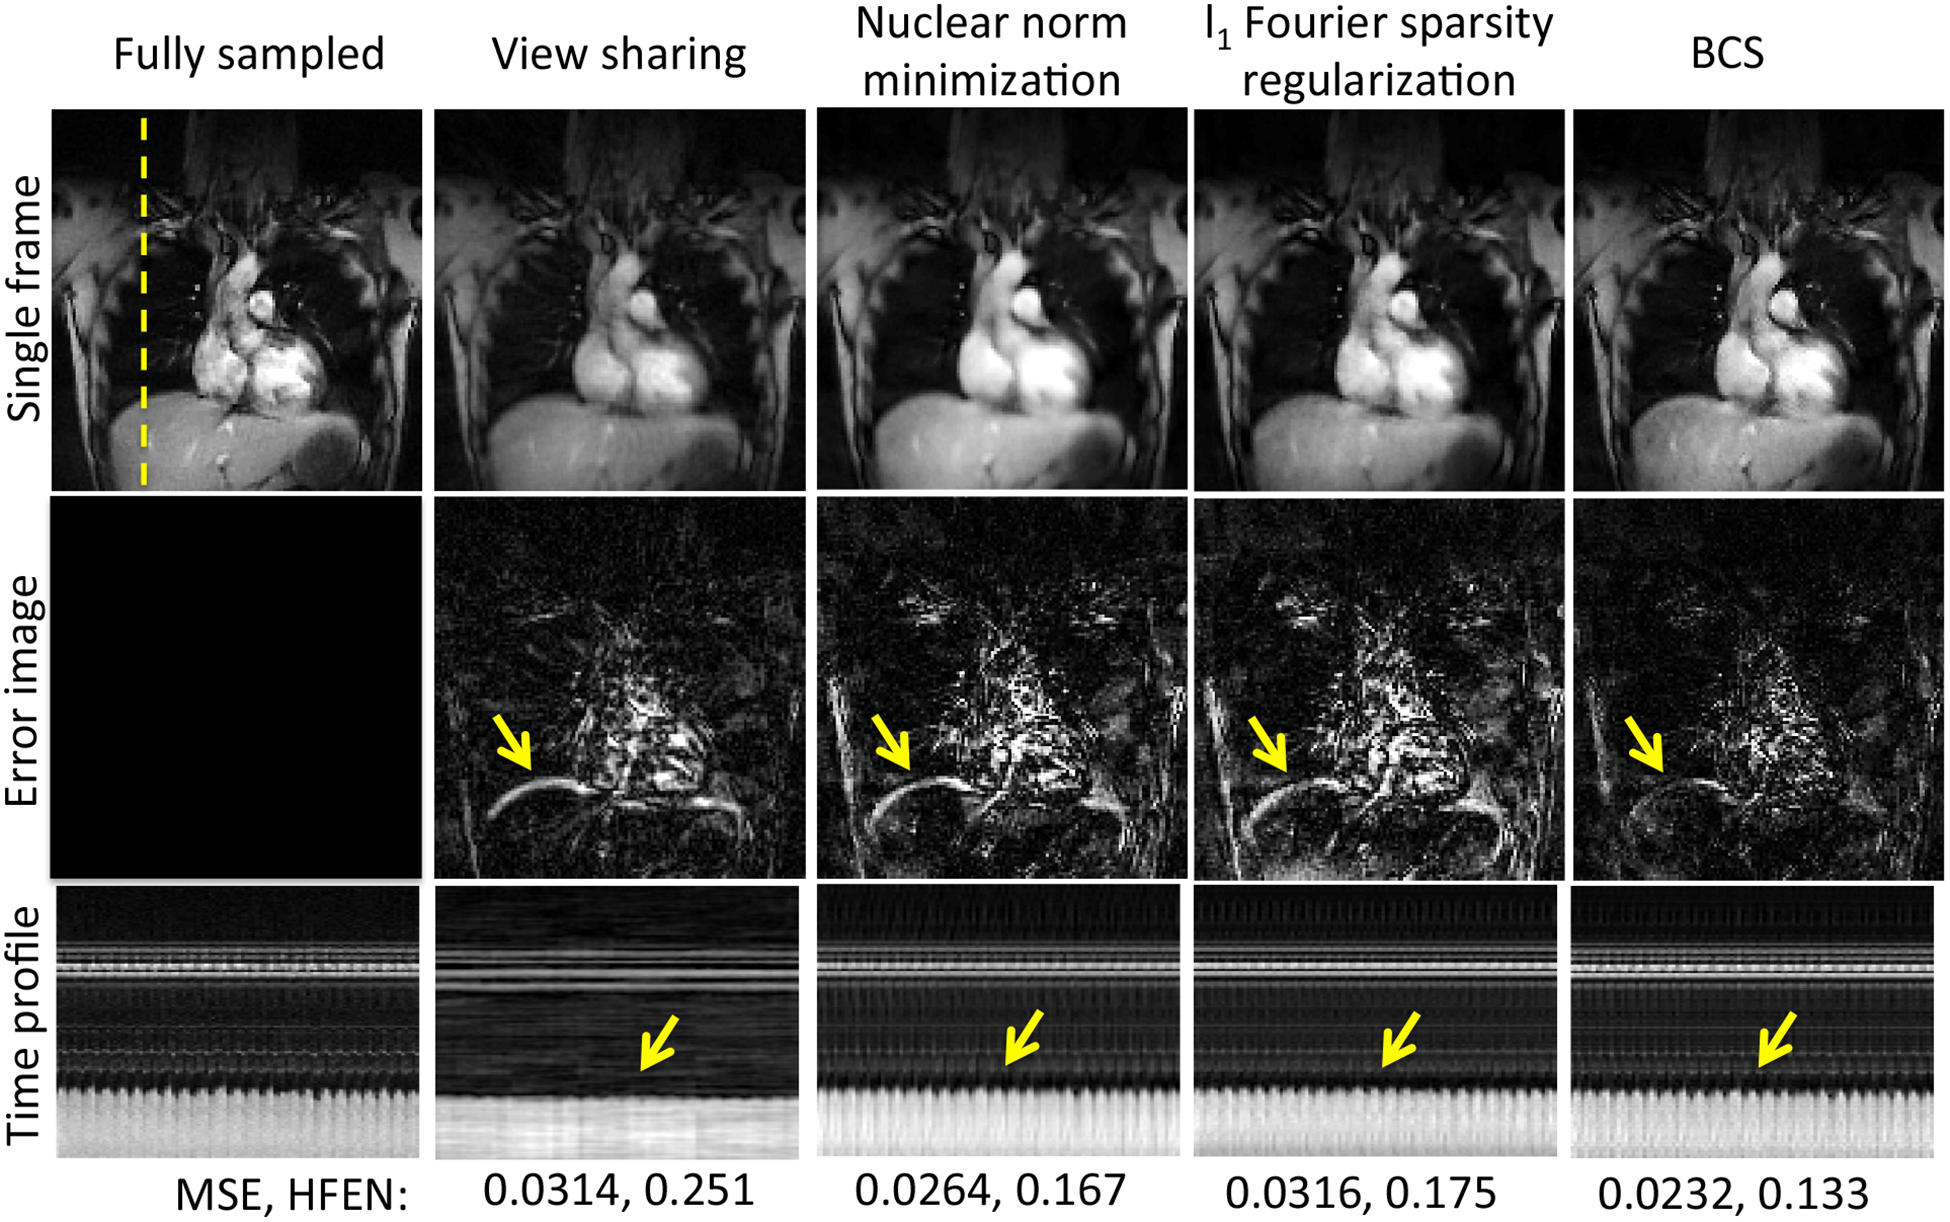
Comparison of different schemes on 2D fully sampled dataset: The figure shows comparison of reconstructions obtained from view-sharing, nuclear norm minimization scheme, l1 Fourier sparsity regularization scheme, and BCS schemes with the fully sampled data. The top row shows a single frame for each of the schemes. The middle row shows the error images with respect to the fully sampled data and the last row shows the time profiles all the schemes at a cross section shown by the yellow dotted line. From the mean square errors (MSE) and the HFEN metric, we observe that BCS gives superior performance than other schemes. All the schemes except BCS suffer from spatio-temporal blurring as shown by the yellow arrows in the error images and time profiles.
Fig. 3 shows the comparisons of the reconstructions from 20, 16, 12 and 10 radial spokes per frame with the fully sampled data. We observe that BCS gives reliable reconstructions with 20 and 16 radial spokes per frame. A reconstruction from 12 or 10 radial spokes results in temporal blurring as shown by the arrows. In the 3D experiments, we fixed the number of radial spokes per frame to 16 for all the schemes.
Figure 3:
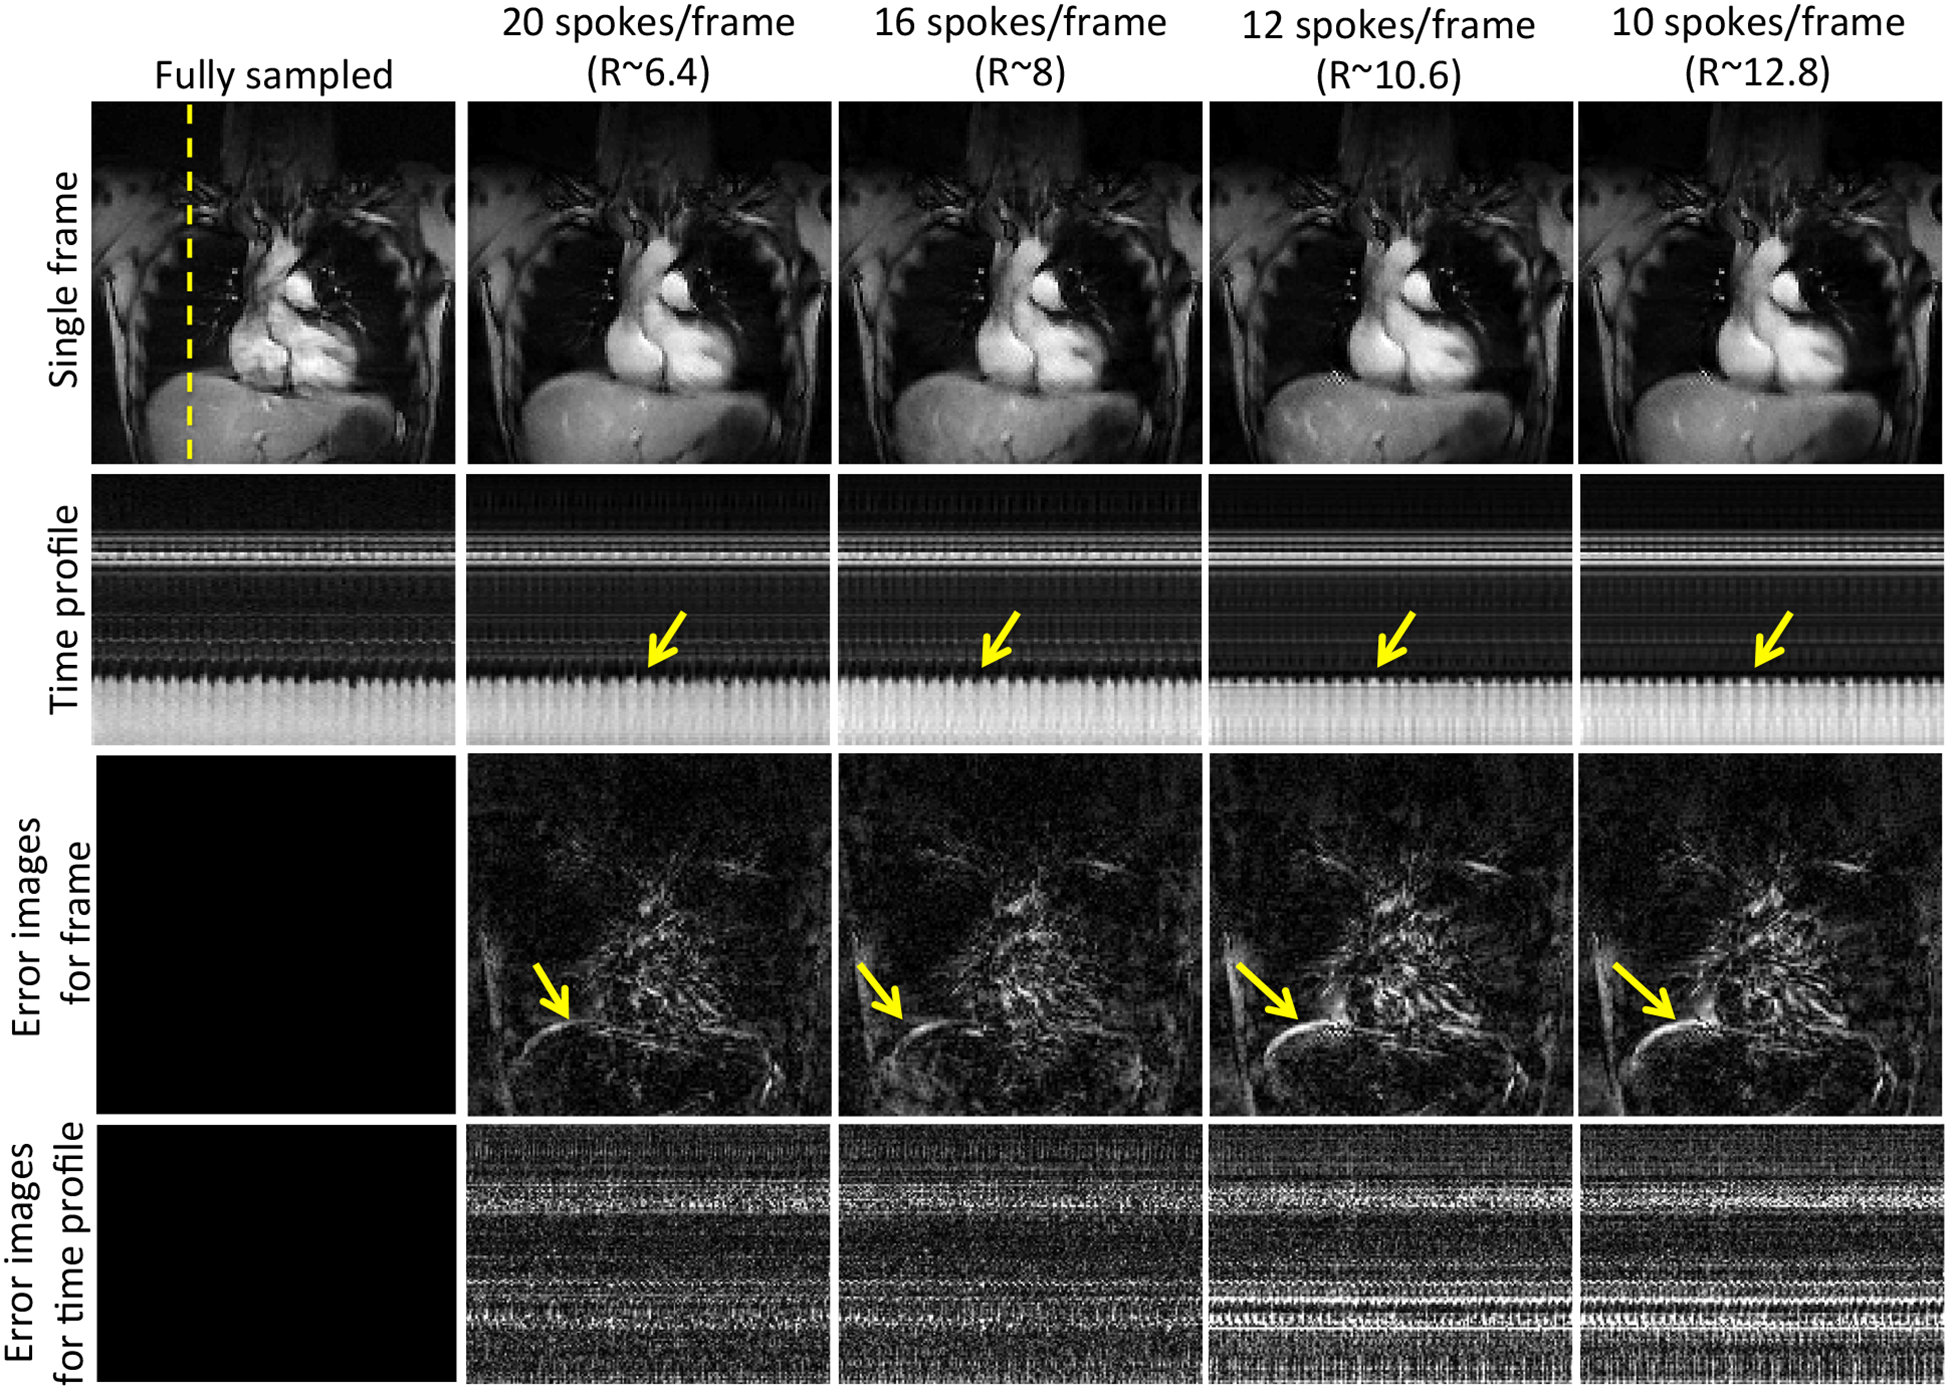
Performance of the BCS scheme at different acceleration factors: The figure shows the single frame (row 1), the time profiles (row 2) and the corresponding error images (row 3–4) of reconstructions obtained by retrospectively undersampling the dataset with 20, 16, 12, and 10 radial spokes per frames resulting in acceleration factors (R) of 6.4, 8, 10.2, and 12.8 respectively. Reliable reconstructions are achieved up to R=8. Beyond R=8 we begin to observe temporal blurring as shown by the arrows in the error images. Note: All the images are in same scale.
Dynamic 3D experiments: Fig. 4 shows the comparisons of the four schemes for two subjects. The figures show a single frame and a time profile along the cross section for 4 of the 16 slices. We observe that the local view-sharing scheme suffers from temporal blurring and aliasing artifacts. The nuclear norm minimization scheme provides better reconstructions than view-sharing, but it exhibits more spatio-temporal blurring than the BCS reconstructions as shown by the arrows. Reconstructions from both the l1 Fourier sparsity regularization scheme and the BCS scheme show comparable image quality in the spatial domain as seen from the spatial frames in both the figures. However, the l1 Fourier sparsity regularization scheme results in higher temporal blurring than BCS. In slices where the tissue motion is very subtle (slice 6 in Fig. 4), BCS preserves the motion whereas all other schemes result in blurring of temporal details. One of the radiologists carefully analyzed the performance of all the schemes as a function of slice position while clinical scoring as shown in Fig. 5 and found that, the performance of the BCS scheme was relatively insensitive to the slice position compared to other schemes. Specifically, the reconstructions of the anterior and posterior slices of the lung (2nd and the 3rd column of Fig. 5), obtained by the other schemes, showed higher degradation in image quality than the more central slices (1st column of Fig. 5) especially in terms of spatial and temporal blurring (pointed by arrows).
Figure 4:
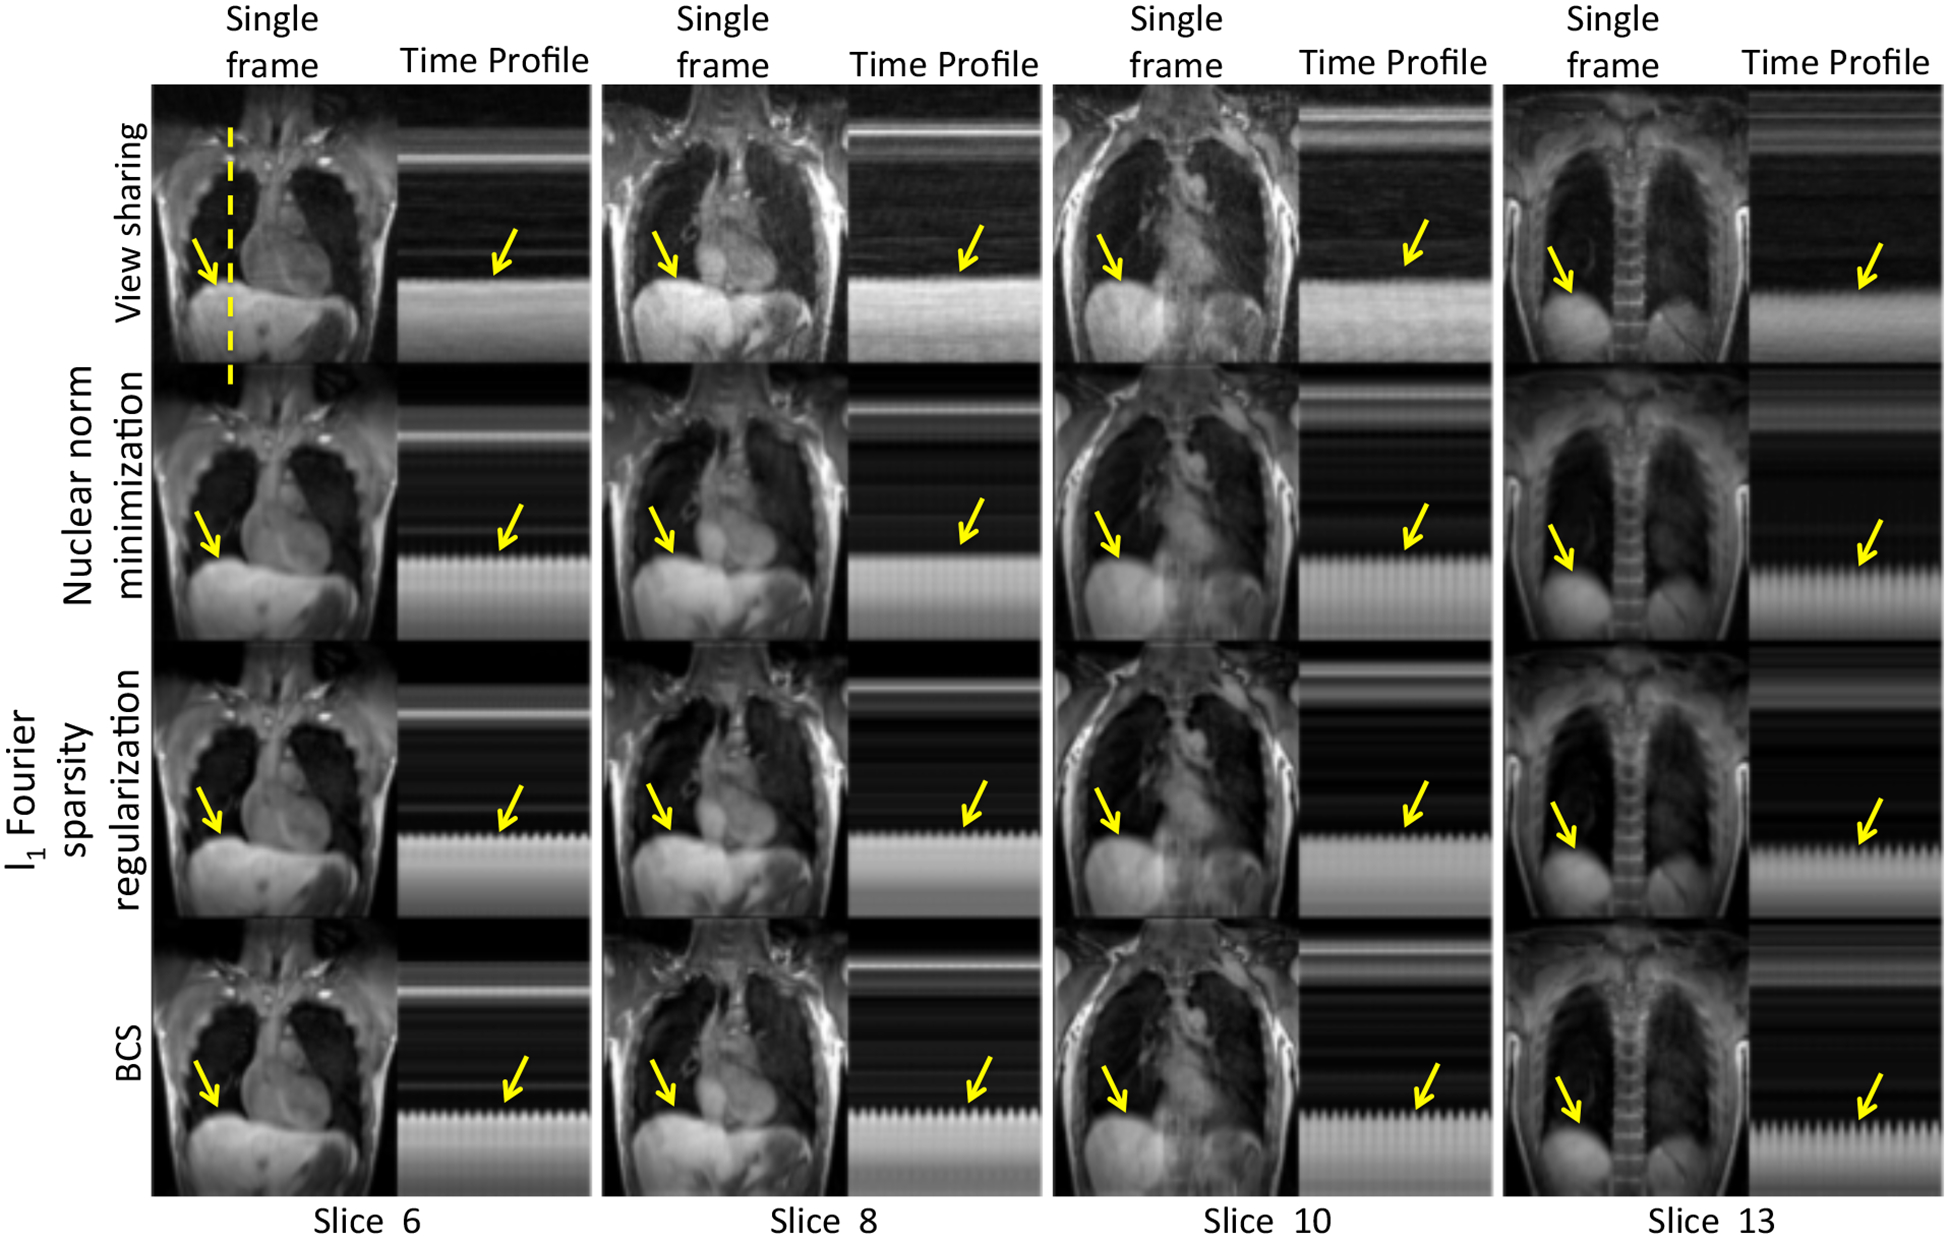
Comparison of different schemes on dynamic 3D free breathing: The figure shows comparison between view-sharing, nuclear norm minimization scheme, l1 Fourier sparsity regularization scheme and BCS scheme (Rows 1–4) for 4 of the 16 slices on subject 2. We observe that the BCS gives better reconstructions than other schemes. It is seen that BCS shows superior spatio-temporal fidelity in comparison to the other schemes (see yellow arrows).
Figure 5:
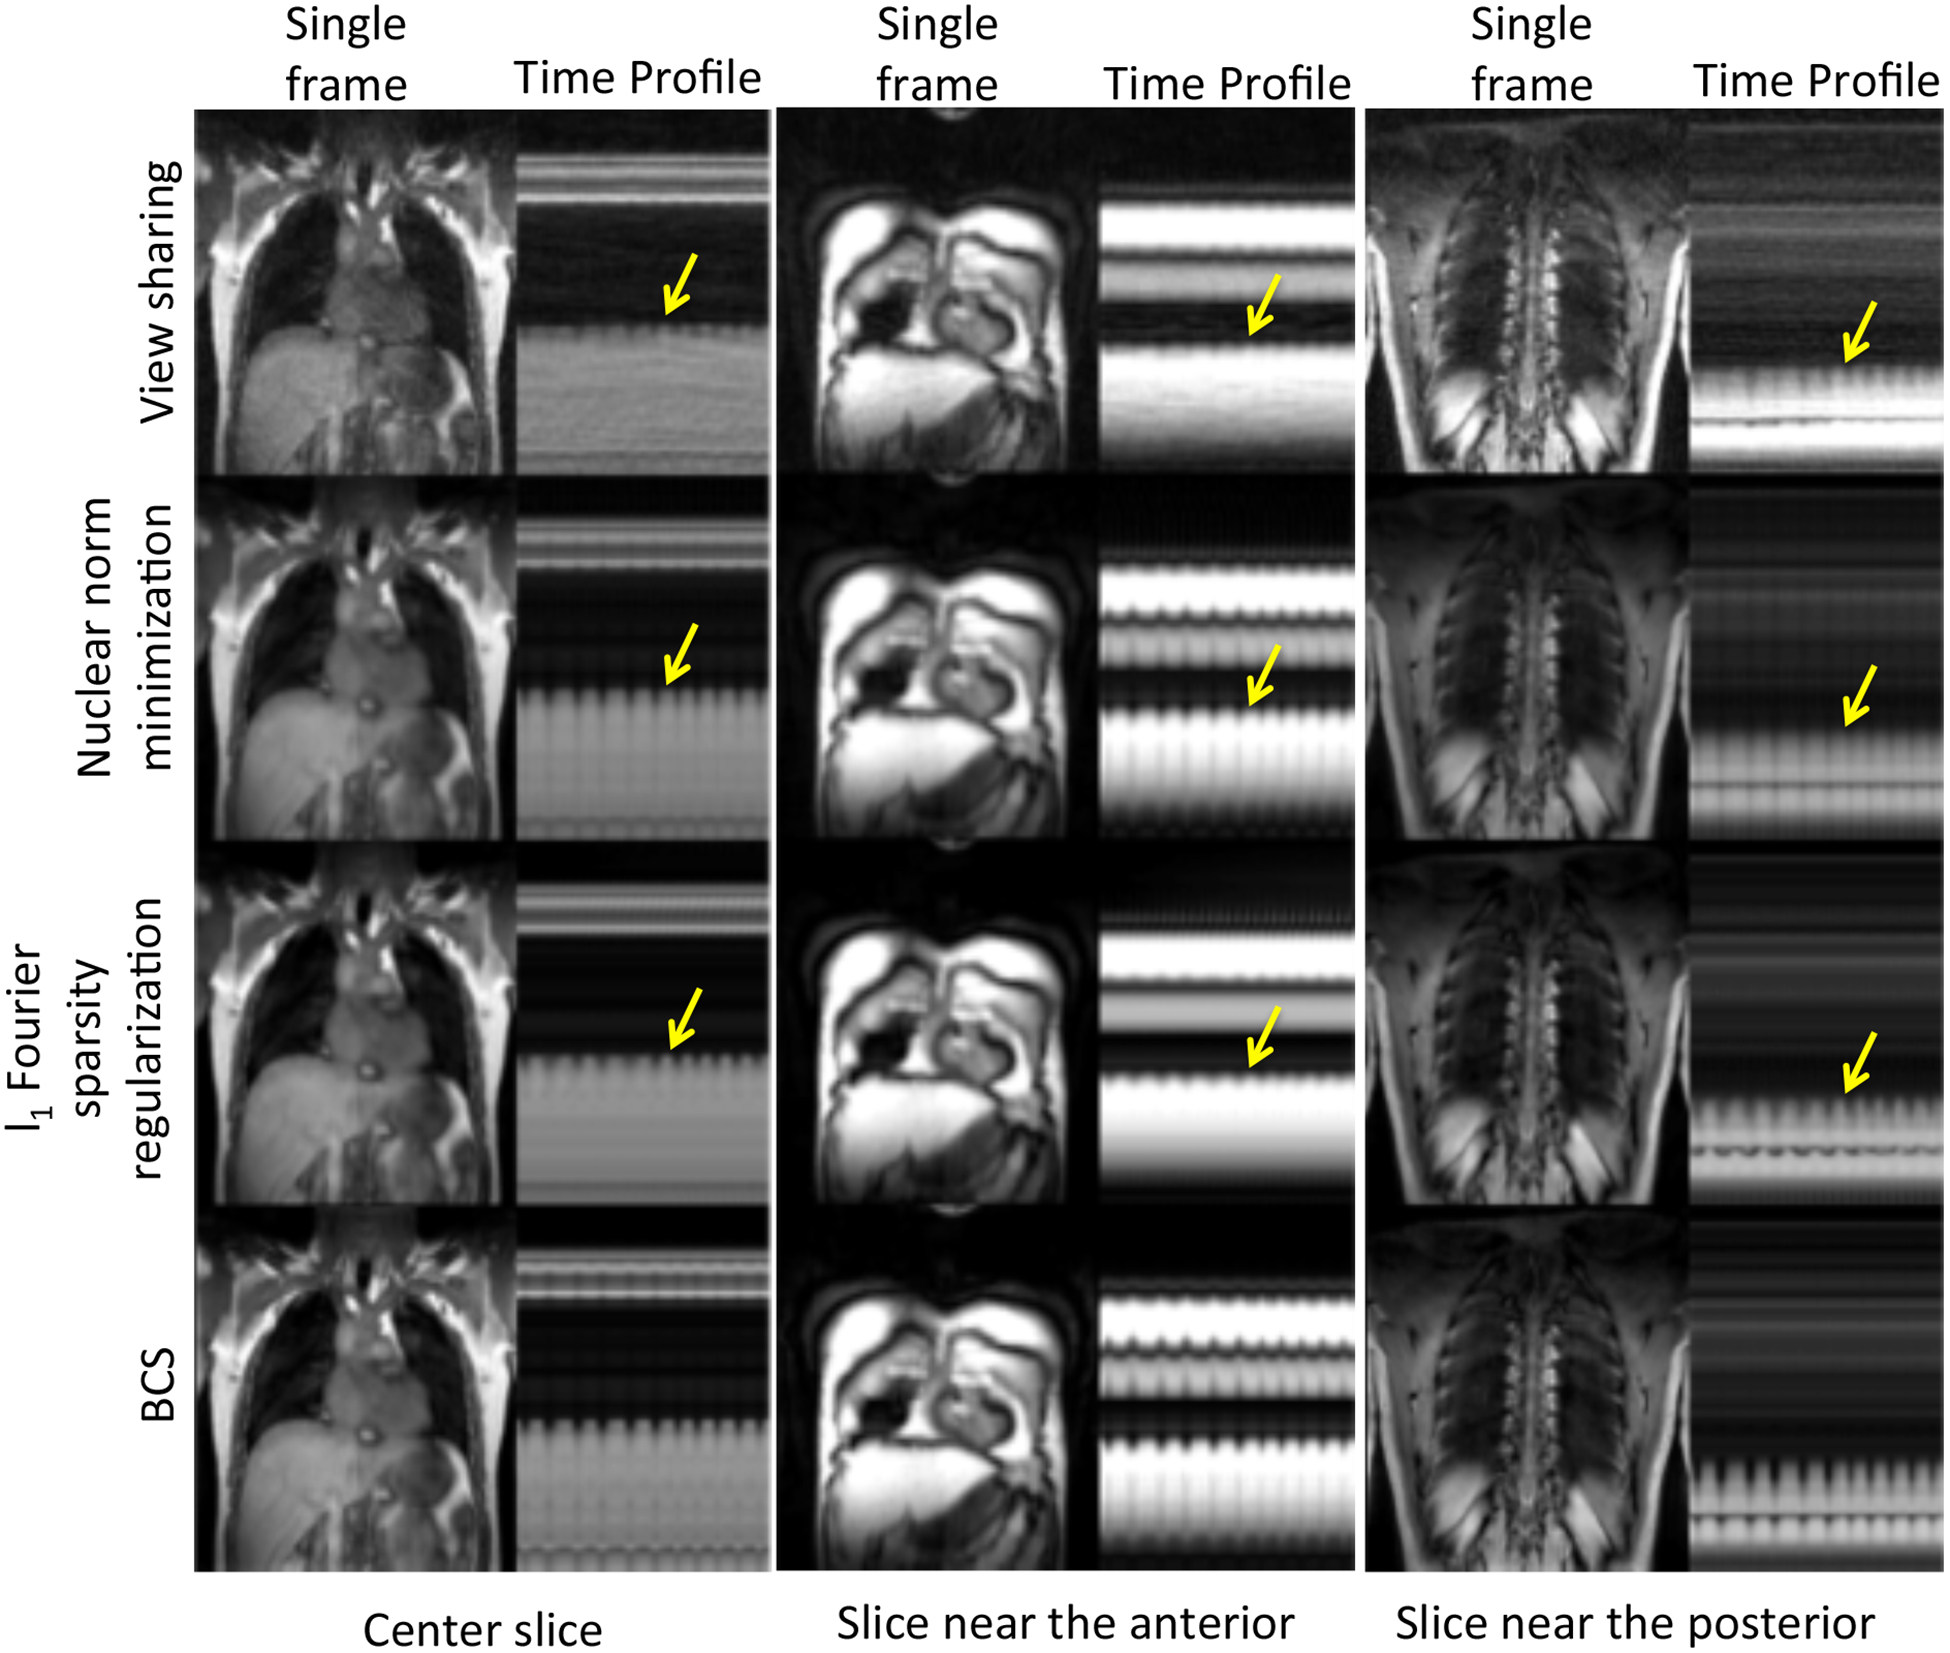
Performance of all the schemes as a function of slice position: The figure shows comparison between view-sharing, nuclear norm minimization scheme, l1 Fourier sparsity regularization scheme and BCS scheme (Rows 1–4) for slices positioned at the center (1st column), anterior (2nd column), and posterior (3rd column) of the lung. We observe that all schemes except the BCS scheme suffer from higher temporal blurring in the slices at anterior and posterior regions of the lung than those in the center region. BCS scheme is relatively insensitive to the slice position as compared to other schemes.
Table 1 shows the visual scores of all the four schemes by both the radiologists (denoted as R1 and R2) based on three different factors: 1.a - Aliasing artifacts, 1.b - Temporal blurring and 1.c - Spatial blurring. The scores from both the radiologists suggest that the BCS scheme performs better than other schemes in the temporal blurring (Table 1.b) and spatial blurring (Table 1.c) categories. The improved performance of BCS can be attributed to the spatially varying non-local averaging feature and its ability to adapt to the cardiac and respiratory patterns of the specific subject. The qualitative scores for aliasing artifacts are roughly the same for nuclear norm minimization scheme (3.75±0.7, 2.62±1.19) and BCS scheme (and 3.62±0.51, 2.62±0.91); the two figures within parentheses denote the mean scores from R1 and R2, respectively, and the number following ± is the standard deviation. We observe that the inter-observer variability is high for this category compared to the others. The scores for the view-sharing scheme are much lower than other three schemes for all the three categories from both radiologists. In summary, the BCS scheme, the nuclear norm minimization scheme and the l1 Fourier sparsity regularization scheme perform comparably in terms of minimizing the aliasing artifacts. However, BCS scheme out-performs all other schemes in terms of minimizing spatiotemporal blurring as compared to the other schemes.
Table 1.
Clinical Scores of 8 3D DMRI datasets for all four schemes by both the radiologist: The clinical scores from the radiologists (R1 and R2) based on three different factors of aliasing artifacts, temporal blurring and spatial blurring are reported in Table 1.a–1.c respectively. We observe that all schemes except view-sharing are comparable in terms of minimizing aliasing artifacts for each radiologist as seen in 1.a. However, there is inter- observer disagreement (different scores by R1 and R2) in the scores. BCS scheme has higher scores than all the other schemes in temporal and spatial blurring categories (Table 1.b–c), which indicates that BCS has minimal spatio-temporal blurring as compared to other schemes. There is good agreement between the scores by both radiologists for temporal and spatial blurring categories.
| Table 1.a Clinical Scores: Aliasing Artifacts | |||||||||
|---|---|---|---|---|---|---|---|---|---|
| ╲ | BCS | Nuclear norm minimization | l1 Fourier sparsity regularization | View sharing | |||||
| R1 | R2 | R1 | R2 | R1 | R2 | R1 | R2 | ||
| Subject 1 | 4 | 1 | 4 | 1 | 3 | 1 | 1 | 1 | |
| Subject 2 | 3 | 3 | 4 | 3 | 2 | 3 | 1 | 1 | |
| Subject 3 | 4 | 4 | 4 | 4 | 4 | 4 | 1 | 2 | |
| Subject 4 | 4 | 3 | 2 | 3 | 3 | 3 | 1 | 2 | |
| Subject 5 | 4 | 3 | 4 | 3 | 2 | 3 | 1 | 2 | |
| Subject 6 | 4 | 2 | 4 | 2 | 4 | 2 | 1 | 1 | |
| Subject 7 | 3 | 3 | 4 | 4 | 3 | 2 | 1 | 1 | |
| Subject 8 | 3 | 2 | 4 | 1 | 3 | 1 | 1 | 0 | |
| Average scores | 3.62±0.51 | 2.62±0.91 | 3.75±0.7 | 2.62±1.19 | 3±0.76 | 2.37±1.06 | 1±0 | 1.25±0.7 | |
| Table 1.b Clinical Scores: Temporal blurring | |||||||||
| ╲ | BCS | Nuclear norm minimization | l1 Fourier sparsity regularization | View sharing | |||||
| R1 | R2 | R1 | R2 | R1 | R2 | R1 | R2 | ||
| Subject 1 | 4 | 4 | 2 | 3 | 3 | 3 | 0 | 0 | |
| Subject 2 | 4 | 4 | 3 | 4 | 3 | 4 | 2 | 1 | |
| Subject 3 | 4 | 4 | 1 | 3 | 2 | 3 | 1 | 1 | |
| Subject 4 | 4 | 4 | 2 | 3 | 3 | 3 | 1 | 1 | |
| Subject 5 | 4 | 4 | 3 | 4 | 2 | 4 | 0 | 1 | |
| Subject 6 | 4 | 3 | 2 | 2 | 2 | 2 | 1 | 1 | |
| Subject 7 | 4 | 4 | 1 | 2 | 2 | 2 | 0 | 1 | |
| Subject 8 | 4 | 4 | 3 | 3 | 2 | 3 | 0 | 0 | |
| Average scores | 4 ±0 | 3.87 ±0.35 | 2.21±0.83 | 3±0.75 | 2.37±0.51 | 2.5±1.3 | 0.62±0.74 | 0.75±0.46 | |
| Table 1.c Clinical Scores: Spatial blurring | |||||||||
| ╲ | BCS | Nuclear norm minimization | l1 Fourier sparsity regularization | View sharing | |||||
| R1 | R2 | R1 | R2 | R1 | R2 | R1 | R2 | ||
| Subject 1 | 4 | 4 | 2 | 3 | 3 | 3 | 1 | 4 | |
| Subject 2 | 3 | 4 | 2 | 4 | 3 | 2 | 1 | 3 | |
| Subject 3 | 4 | 4 | 2 | 4 | 3 | 3 | 1 | 4 | |
| Subject 4 | 4 | 4 | 2 | 4 | 3 | 3 | 1 | 4 | |
| Subject 5 | 4 | 4 | 3 | 4 | 3 | 2 | 1 | 4 | |
| Subject 6 | 4 | 4 | 3 | 4 | 3 | 2 | 1 | 4 | |
| Subject 7 | 4 | 4 | 2 | 4 | 3 | 3 | 1 | 3 | |
| Subject 8 | 4 | 4 | 2 | 4 | 3 | 3 | 1 | 3 | |
| Average scores | 3.87±0.35 | 4±0 | 2.25±0.46 | 3.87±0.35 | 3±0 | 2.63±0.52 | 1±0 | 3.62±0.51 | |
Fig. 6 shows the lung volume as a function of time and the lung segmentation contours for the BCS, nuclear norm minimization and l1 Fourier sparsity regularization schemes on one subject with tidal breathing maneuver. The change in lung volume for BCS (approximately 200 mL) was significantly different from that for the nuclear norm minimization scheme (around 150 mL) and l1 Fourier sparsity regularization scheme (<100 mL). The contours depict the boundary of the lung obtained from the segmentation of the reconstructions. The two time points (a and b) in the figure correspond to maximum inspiratory volume. From the contours, we observe that at maximum inspiration the boundary of the lung for nuclear norm minimization and l1 Fourier sparsity regularization scheme is higher than that for the BCS scheme, which means the volume of the lung is less than that for the BCS scheme. This is attributed to higher temporal blurring in the other two schemes as compared to the BCS scheme. The time point c corresponds to maximum expiration. From the last row in the figure we observe that the segmentations from all the three schemes are the same. The tidal volume analysis could not be performed on the view-sharing scheme since the reconstructions in this case suffered from aliasing artifacts, which resulted in poor segmentation of the lungs.
Figure 6:
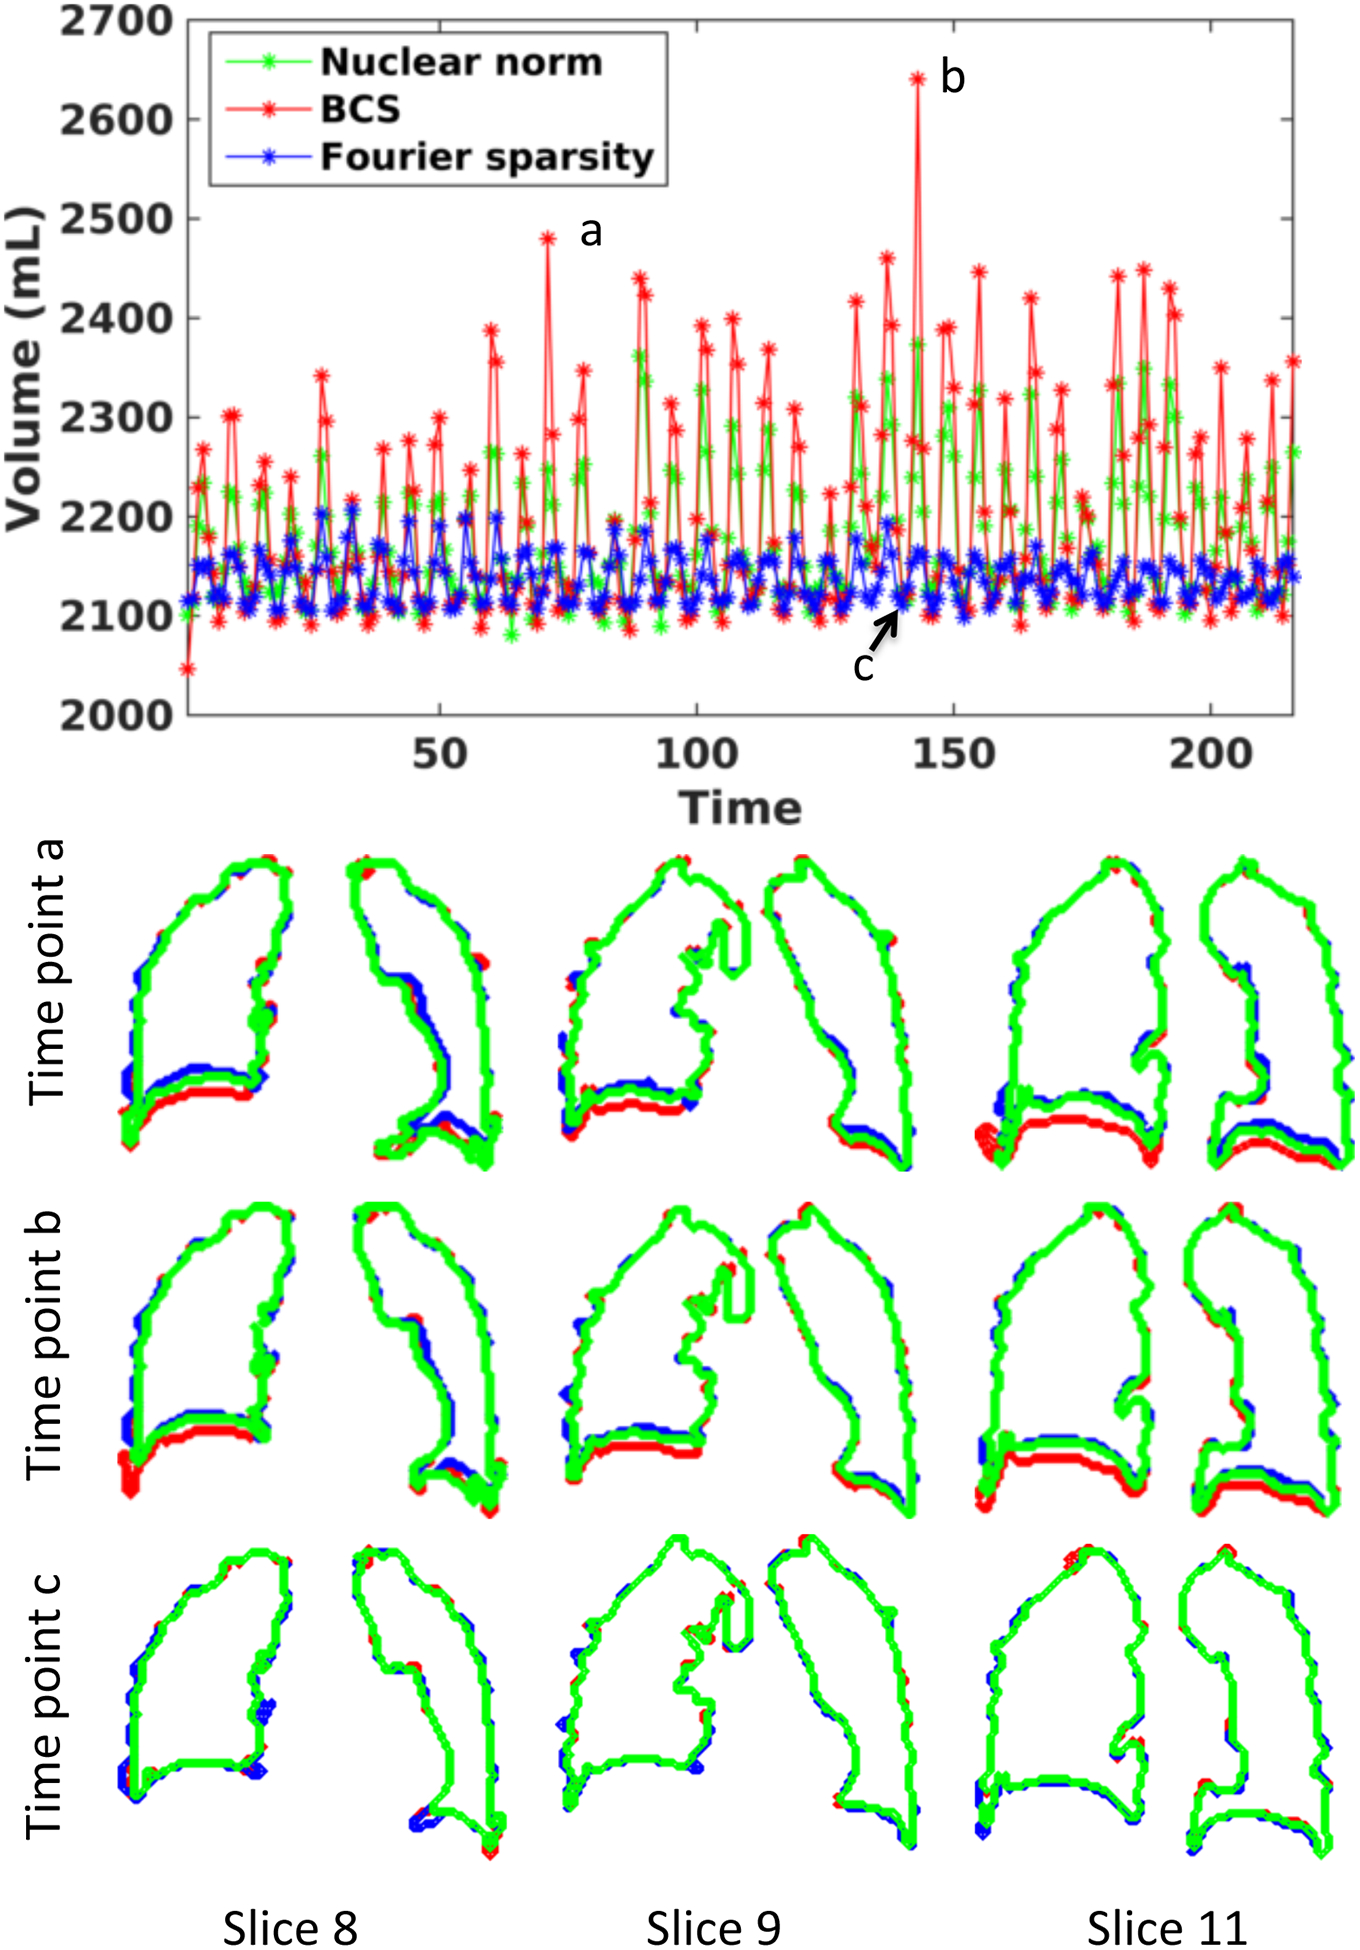
Comparison of BCS, Nuclear norm minimization and l1 Fourier sparsity regularization schemes for changes in lung volume as a function of time for Subject 8: The plot shows the volume of lung (in mL) as a function of time obtained from reconstructions using BCS (in red), nuclear norm minimization (in green) and l1 Fourier sparsity regularization (in blue). The second, third and fourth rows show the lung segmentation contours for the three schemes at three time points a. and b. and c. respectively. The contours are shown for three of the 18 slices. From the plot as well as from the segmentations, we can see that the nuclear norm minimization and l1 Fourier sparsity regularization scheme suffer from considerable temporal blurring. Note: that the segmentations at time point c (peak expiration) are almost the same. This is expected because the position of the diaphragm changes more during inspiration than expiration.
Fig. 7 shows the change in volume as a function of time and the segmented lung volumes for one subject with tidal breathing and deep breathing maneuvers. The lung was segmented from the reconstructions obtained using the BCS scheme. The change in lung volume was approximately 200mL. The normal minute ventilation was calculated as tidal volume × number of breathing cycles in a minute which was found to be 4L/min. In case of deep breathing maneuver we measured the supine inspiratory capacity, which was found to be 1.5L. This correlates well with the literature for normal subjects in the supine position.
Figure 7:
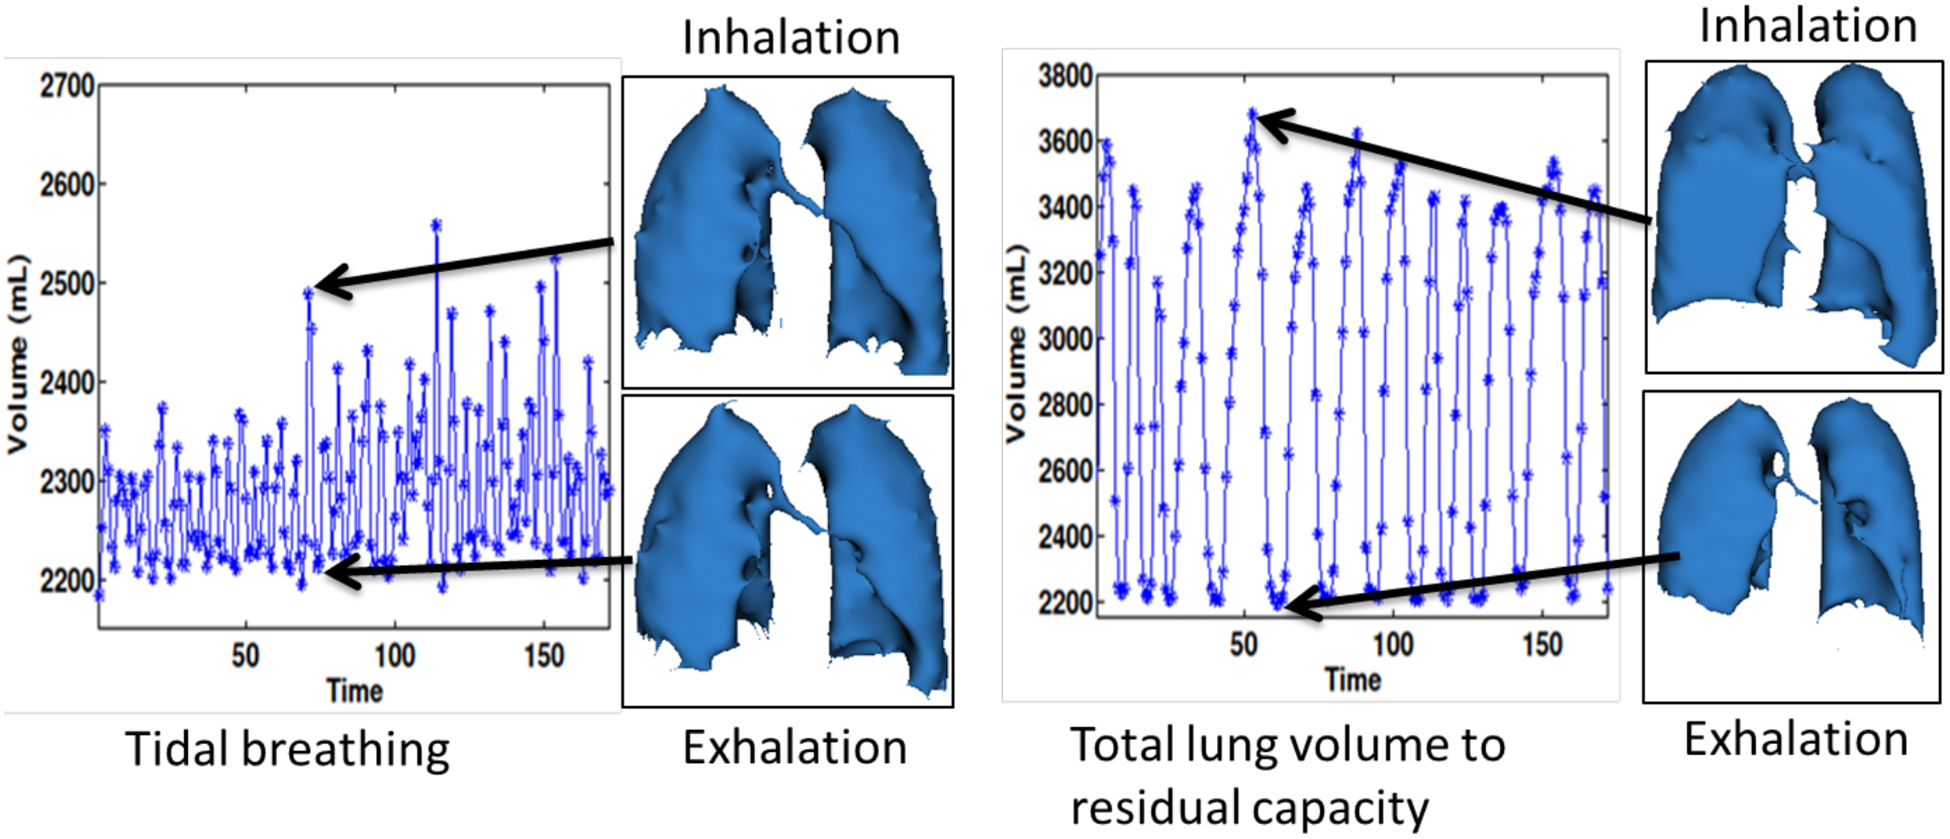
Changes in lung volume as function of time: The figure shows the changes in lung volumes as a function of time in case of tidal breathing maneuver (shown on the left) and deep breathing maneuver from total lung capacity (TLC) to functional residual capacity (FRC) (shown on the right). The segmented lung volumes during peak inhalation and peak exhalation are also shown for both breathing maneuvers. The tidal volume was measured to be approximately 200mL and the normal minute ventilation was around 4L/min. The supine inspiratory capacity was measured to be 1.5L. Note that these numbers are for supine position
The motion of the diaphragm as tracked using an optical flow method is shown in Fig. 8. Two sets of two frames each, one set with a large change in diaphragm position (red segment and blue segment) and one with little change in diaphragm position (green segment and orange segment) were chosen during inspiration and expiration. The velocity vector maps and the color-coded velocity maps are shown in each of the cases. Fig. 8.a–b shows the velocity maps during inspiration and Fig. 8.c–d shows the velocity maps during expiration. From the color-coded velocity maps we observe that a higher displacement in the diaphragm position (higher diaphragm velocity) correlates well with the observed change in lung volume between the corresponding frames during both inspiration and expiration.
Figure 8:
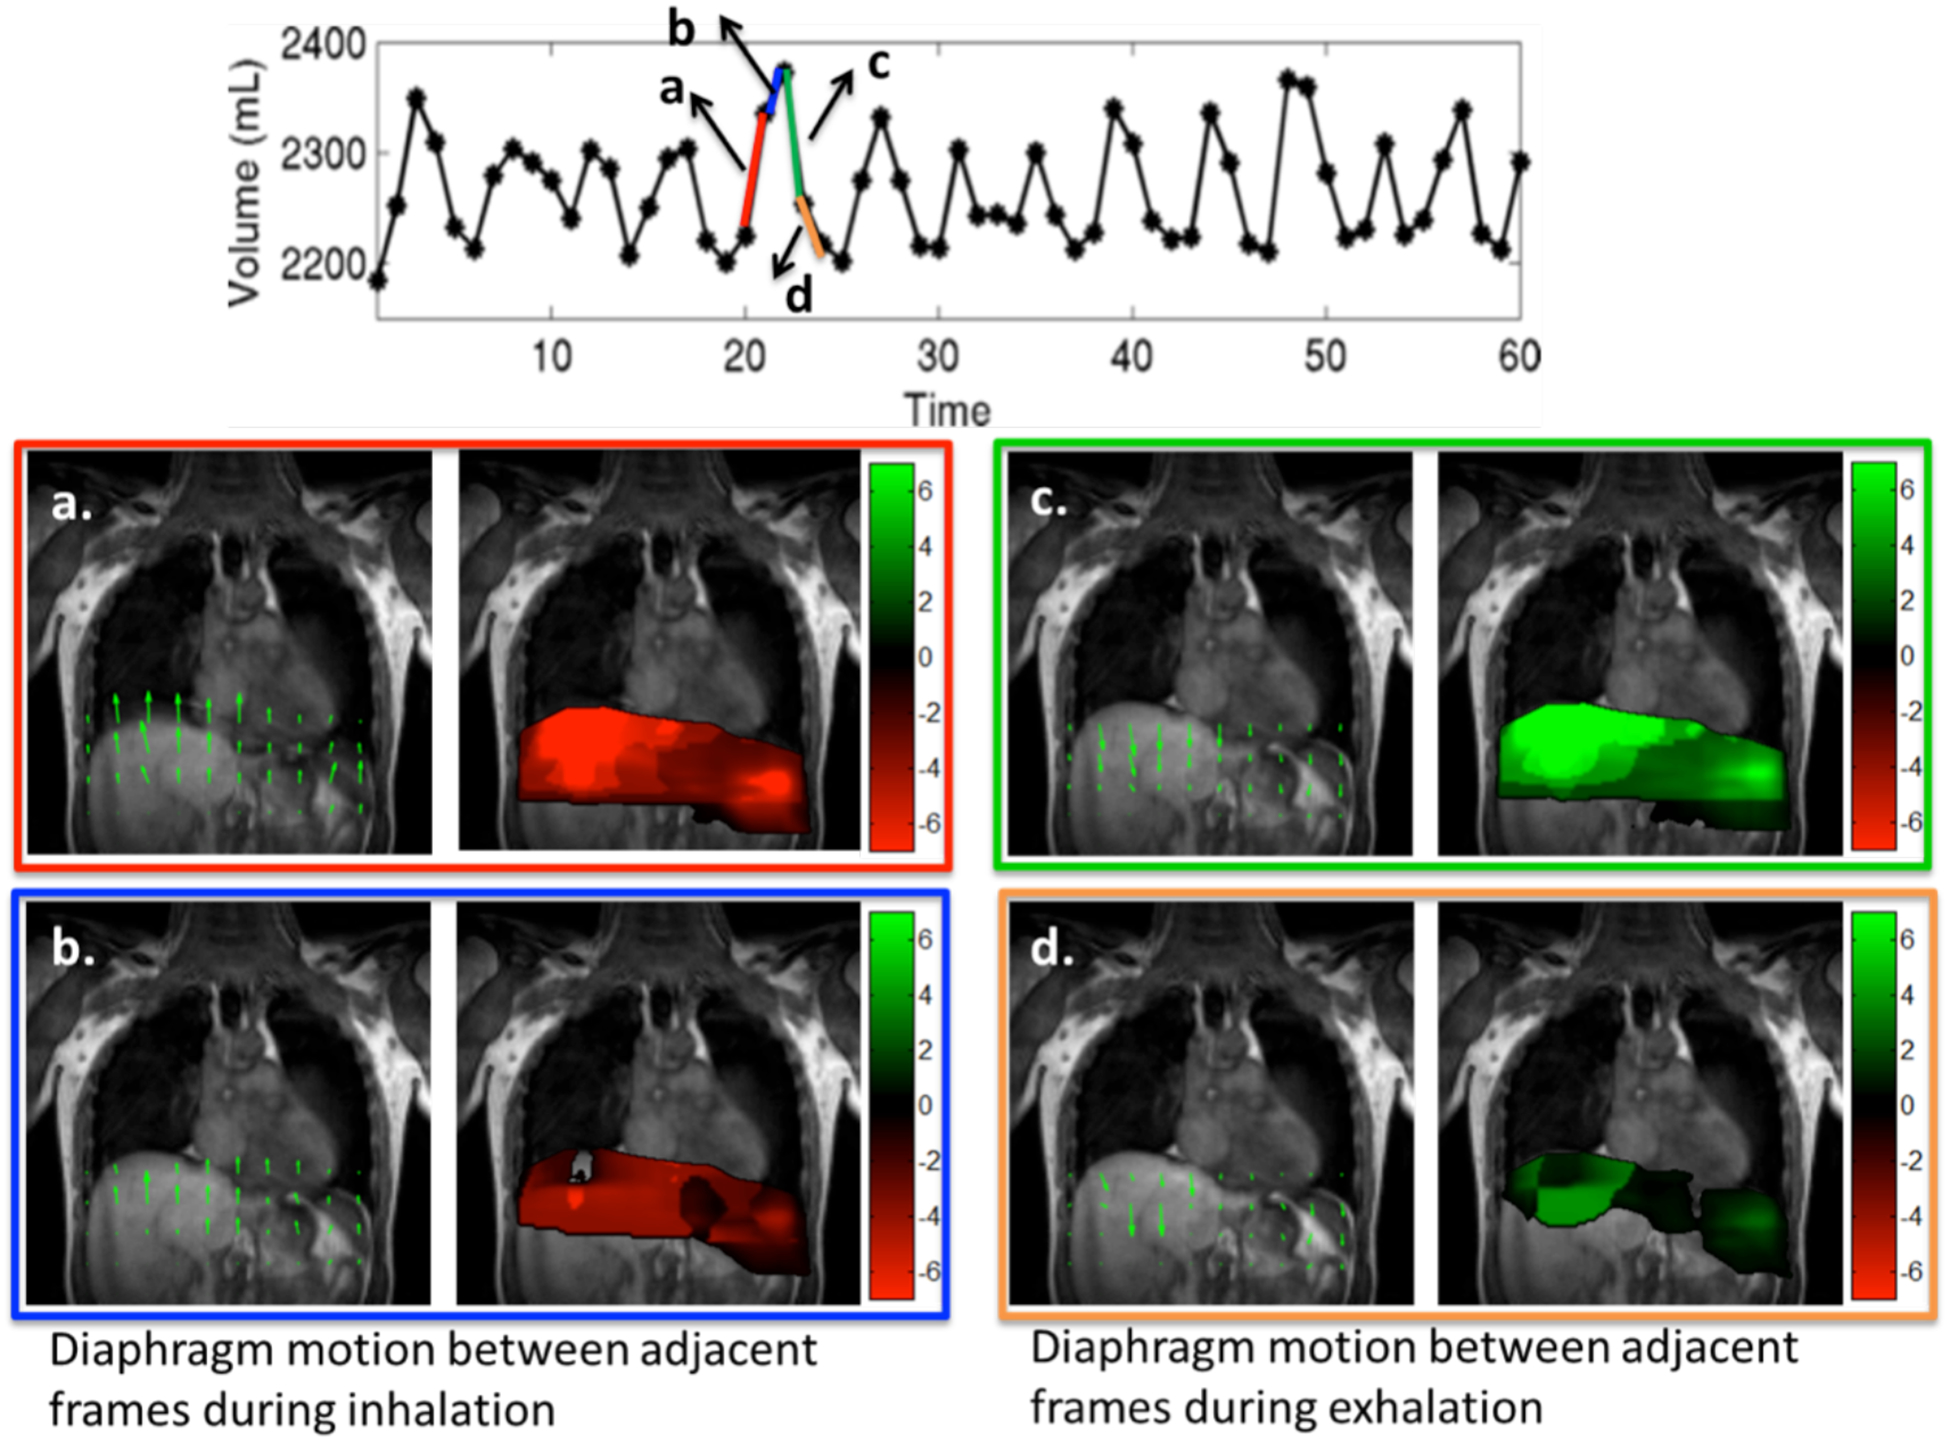
Tracking diaphragm motion using velocity maps: The motion of the diaphragm was tracked at two time points between inspiration shown in (a–b) and two time points between expiration shown in (c–d). The velocity from inspiration to expiration is considered positive (in green) and velocity from expiration to inspiration is considered negative (in red). The velocity field maps and the color-coded velocity maps are shown for all four cases. The change in lung volume shown by blue segment is much lesser than the change in lung volume shown by red segment. This translates to higher diaphragm motion in frames in red segment as compared to the blue segment as seen from the color coded velocity maps in a and b. Similar results were observed during both inspiration and expiration.
DISCUSSION
The application of compressed sensing together with parallel imaging to accelerate 3D dynamic imaging of lung volumes and diaphragm motion has not been studied extensively in the past. We evaluated the performance of four different schemes (view-sharing, nuclear norm minimization scheme, l1 Fourier sparsity regularization scheme and BCS scheme) in accelerating 2D and 3D dynamic free breathing MRI of the thorax in 8 normal subjects. In both our 2D and 3D experiments, we observe that the BCS scheme yields superior reconstructions compared to other schemes qualitatively and quantitatively. The BCS scheme, along with golden angle sampling patterns, offered a temporal resolution of ~500ms and a spatial resolution of 2.7 × 2.7 × 10mm3 with whole lung coverage, while maintaining image quality. To the best of our knowledge, this is the first work, which demonstrates temporal resolution of less than 1 sec, along with whole coverage of the thorax, which enables 3D free breathing dynamic imaging of lung volumes and diaphragm motion.
We observe that the classical view-sharing scheme suffers from severe temporal blurring as it combines information from adjacent frames. Since the data acquired is free breathing, the respiratory motion between adjacent frames is very high. Hence, the view-sharing approach results in extensive blurring. In contrast, the constrained schemes can be thought of as non-local view-sharing schemes; their ability to combine information from frames/pixels that are highly similar enables them to reduce blurring. We observe that the ability of the BCS and the l1 Fourier sparsity regularization scheme to spatially adapt the non-local averaging depending on the dynamics enables them to provide better reconstructions than the nuclear norm minimization scheme. In dynamic datasets with regions corresponding to strikingly different dynamics (e.g. cardiac and respiratory motion), the ability to spatially adapt the non-local averaging can give improved results. The l1 Fourier sparsity regularization scheme is sensitive to irregular voxel profiles resulting from non-linear interactions between cardiac and respiratory motion. This is because irregular voxel profiles result in a higher number of non-zero Fourier coefficients, thus disrupting the sparsity assumption. The regularity of the breathing patterns will vary from subject to subject leading to inconsistent performance of the l1 Fourier sparsity regularization scheme. These schemes may not be reliable in the dynamic assessment of lung volumes during free breathing in patients suffering from emphysema or other causes of dyspnea. The patient specific dictionaries in the BCS scheme may be a better choice in patients that are short of breath; these learned basis functions will result in a sparser data representation and hence provide reliable recovery from fewer measurements. Additionally, incoherent sampling by golden angle ordering aids in obtaining a sparser representation, leading to superior reconstructions. Other interleaved sampling patterns may also lead to similar accelerations however a thorough validation of this claim is beyond the scope of the manuscript. We observe that there are currently several different flavors of compressed sensing implementations, which may be applied to this specific problem. We restrict our comparisons in this work to few of the state of the art dynamic imaging schemes since rigorous comparison with all of them is beyond the scope; alternate implementations of these algorithms may produce higher quality reconstructions with less temporal/spatial blurring and aliasing artifacts than reported in this work. We have used the radial FLASH sequence to demonstrate the feasibility of the BCS scheme. However, this scheme can be combined with more efficient trajectories with longer readouts (e.g. multi-shot EPI, multi-shot spiral) to further improve spatial and temporal resolution and echo-time, which is the focus of our current work. The acceleration provided by BCS can enable us to keep the readout duration small enough to minimize B0 induced distortions and losses.
The average scores from both the radiologists indicate good agreement for spatial and temporal blurring criteria. There is relatively higher inter-observer variability in scores for the aliasing artifact criterion, but the mean scores from both the radiologists suggest that the BCS scheme performs better. The post-scoring discussion revealed that one of the radiologists gave more importance to the blurring and artifacts that affected the diaphragm motion or diaphragm delineation. By contrast, the other radiologist rated the datasets based on the blurring and artifacts in the whole image rather than placing more emphasis on the diaphragm. This explains the bias in the scores pertaining to spatial blurring. The number of subjects is insufficient to perform statistical analysis for inter-observer agreement.
Our preliminary results using the BCS scheme for dynamic imaging of lung volumes and diaphragm motion obtained from a single dataset appear promising. The normal minute ventilation in a resting adult in the upright position is about 5L/min to 8L/min33. However the normal minute ventilation in the supine position is less than in the upright position34,35 and all of our MRI images were obtained in the supine position. The measured minute ventilation of 4L/min is within the normal range for a supine subject. The measurement of minute ventilation is useful in a number of disease mechanisms that produce arterial hypercapnia33. The lung volumes were segmented using a simple region growing approach with minimal user interference. There are more sophisticated lung segmentation algorithms including the fuzzy-connectedness algorithm that could be performed to further improve our lung segmentation.
The proposed imaging protocol acquires 3D data with 16 partitions using the stack of stars trajectory; the sampling pattern is the same for all the partitions, which enables slice-by-slice recovery. While the number of slices is sufficient for good depiction of diaphragm and lung volume dynamics in normal subjects, it may not be sufficient for obese subjects. Improved slice coverage may be obtained using fully 3D recovery exploiting the spatial redundancies and using 3D trajectories. The current sequence uses a 3D stack of stars trajectory, where the sampling along the kz direction is uniform. Since the kz direction is fully sampled (except in some cases where partial Fourier recovery is used), we compute a Fourier transform along kz and recover each slice independently. We anticipate that using different angles for different kz planes as well as sampling different kz planes with different sampling density will provide a more incoherent and appropriate sampling pattern. This strategy may result in improved recovery, but at the cost of higher computational complexity and memory demand, since we cannot decouple the problem to solve for each slice independently. The golden angle-sampling pattern was used to achieve incoherent sampling across time frames; however, other interleaved patterns can be used with BCS to provide these accelerations. Our future work will focus on these and other image reconstruction schemes that are optimized for individual patients suffering from respiratory disorders including COPD, asthma, and cystic fibrosis.
In conclusion, our study indicates that the blind compressed sensing (BCS) scheme gives individualized reconstructions with diagnostically useful image quality and minimal spatiotemporal blurring as compared to other accelerated imaging schemes. We showed 3D dynamic imaging of lung volumes and diaphragm motion with high spatial and temporal resolution is achievable using the BCS scheme.
ACKNOWLEDGEMENTS
The authors thank the reviewers for their valuable suggestions and comments.
APPENDIX A
Tradeoffs in image recovery using constrained algorithms
The nuclear minimization scheme, the l1 Fourier sparsity regularization scheme, and the BCS rely on modeling the temporal profiles/columns of the Casorati matrix. The sparsity priors on the coefficients U in BCS and on the Fourier coefficients in the l1 Fourier sparsity regularization scheme cause many of the coefficients to be zero. Hence these schemes use different basis functions at different pixels. The nuclear norm minimization scheme, in contrast, does not enforce any sparsity prior and hence uses the same basis functions at each pixel. The projection of the intensity profile at the pixel (x, y), denoted by the vector , is obtained as
where the matrix P(x, y) is the specified by
| (1) |
The rows of the matrix Vac are the temporal basis functions that are active at the pixel. The above relation shows that the intensity at the ith frame (ith row of ) is obtained as the weighted linear combination of all the entries in ρ(x, y); the weights are specified by the ith row of P(x, y). We term the rows of the P(x, y) matrix in (6) as the temporal point spread function (TPSF) since it characterizes averaging across time performed by the above constrained schemes to remove aliasing, which is noise-like in case of radial undersampling (see Fig A). We observe that each row of the matrix gives the weights for the corresponding time point.
Since we use the l1 norm, which is a convex relaxation of l0 sparsity, the recovered coefficients are not exactly sparse, and have many small non-zero coefficients. Similarly, the recovered matrix is not exactly low rank in the nuclear norm setting. For visualization purposes, we truncate the coefficients whose magnitudes are less than 0.1% of the maximum in the Fourier sparsity regularization and BCS settings to generate Fig. A. Similarly, we perform a singular value decomposition of the recovered matrix, followed by a truncation of singular values less than 0.1% of the maximum in the nuclear norm scheme. We stress that this truncation is only used for visualization; the actual algorithms do not use truncation. Fig. A shows the TPSF for one time point corresponding to peak inhalation (specified by solid orange line) obtained from the reconstructed data and the corresponding signal profiles at three pixels. The pixel intensity at a specific pixel and time point in the denoised image is obtained as a weighted linear combination of pixels at all the time points at the same spatial location; the weights are specified by the value of the TPSF. We observe that the TPSF values are higher for frames with similar respiratory phase (marked by dotted orange markers), which implies that these pixels contribute to the summation heavily. We observe that the TPSF is spatially and temporally varying for BCS and l1 Fourier sparsity regularization scheme. Since the low-rank minimization scheme uses the same set of basis functions at each pixel, in this case the TPSF is only temporally varying. The TPSF for view sharing method is both temporally and spatially invariant as seen in Fig. A.
Figure A:
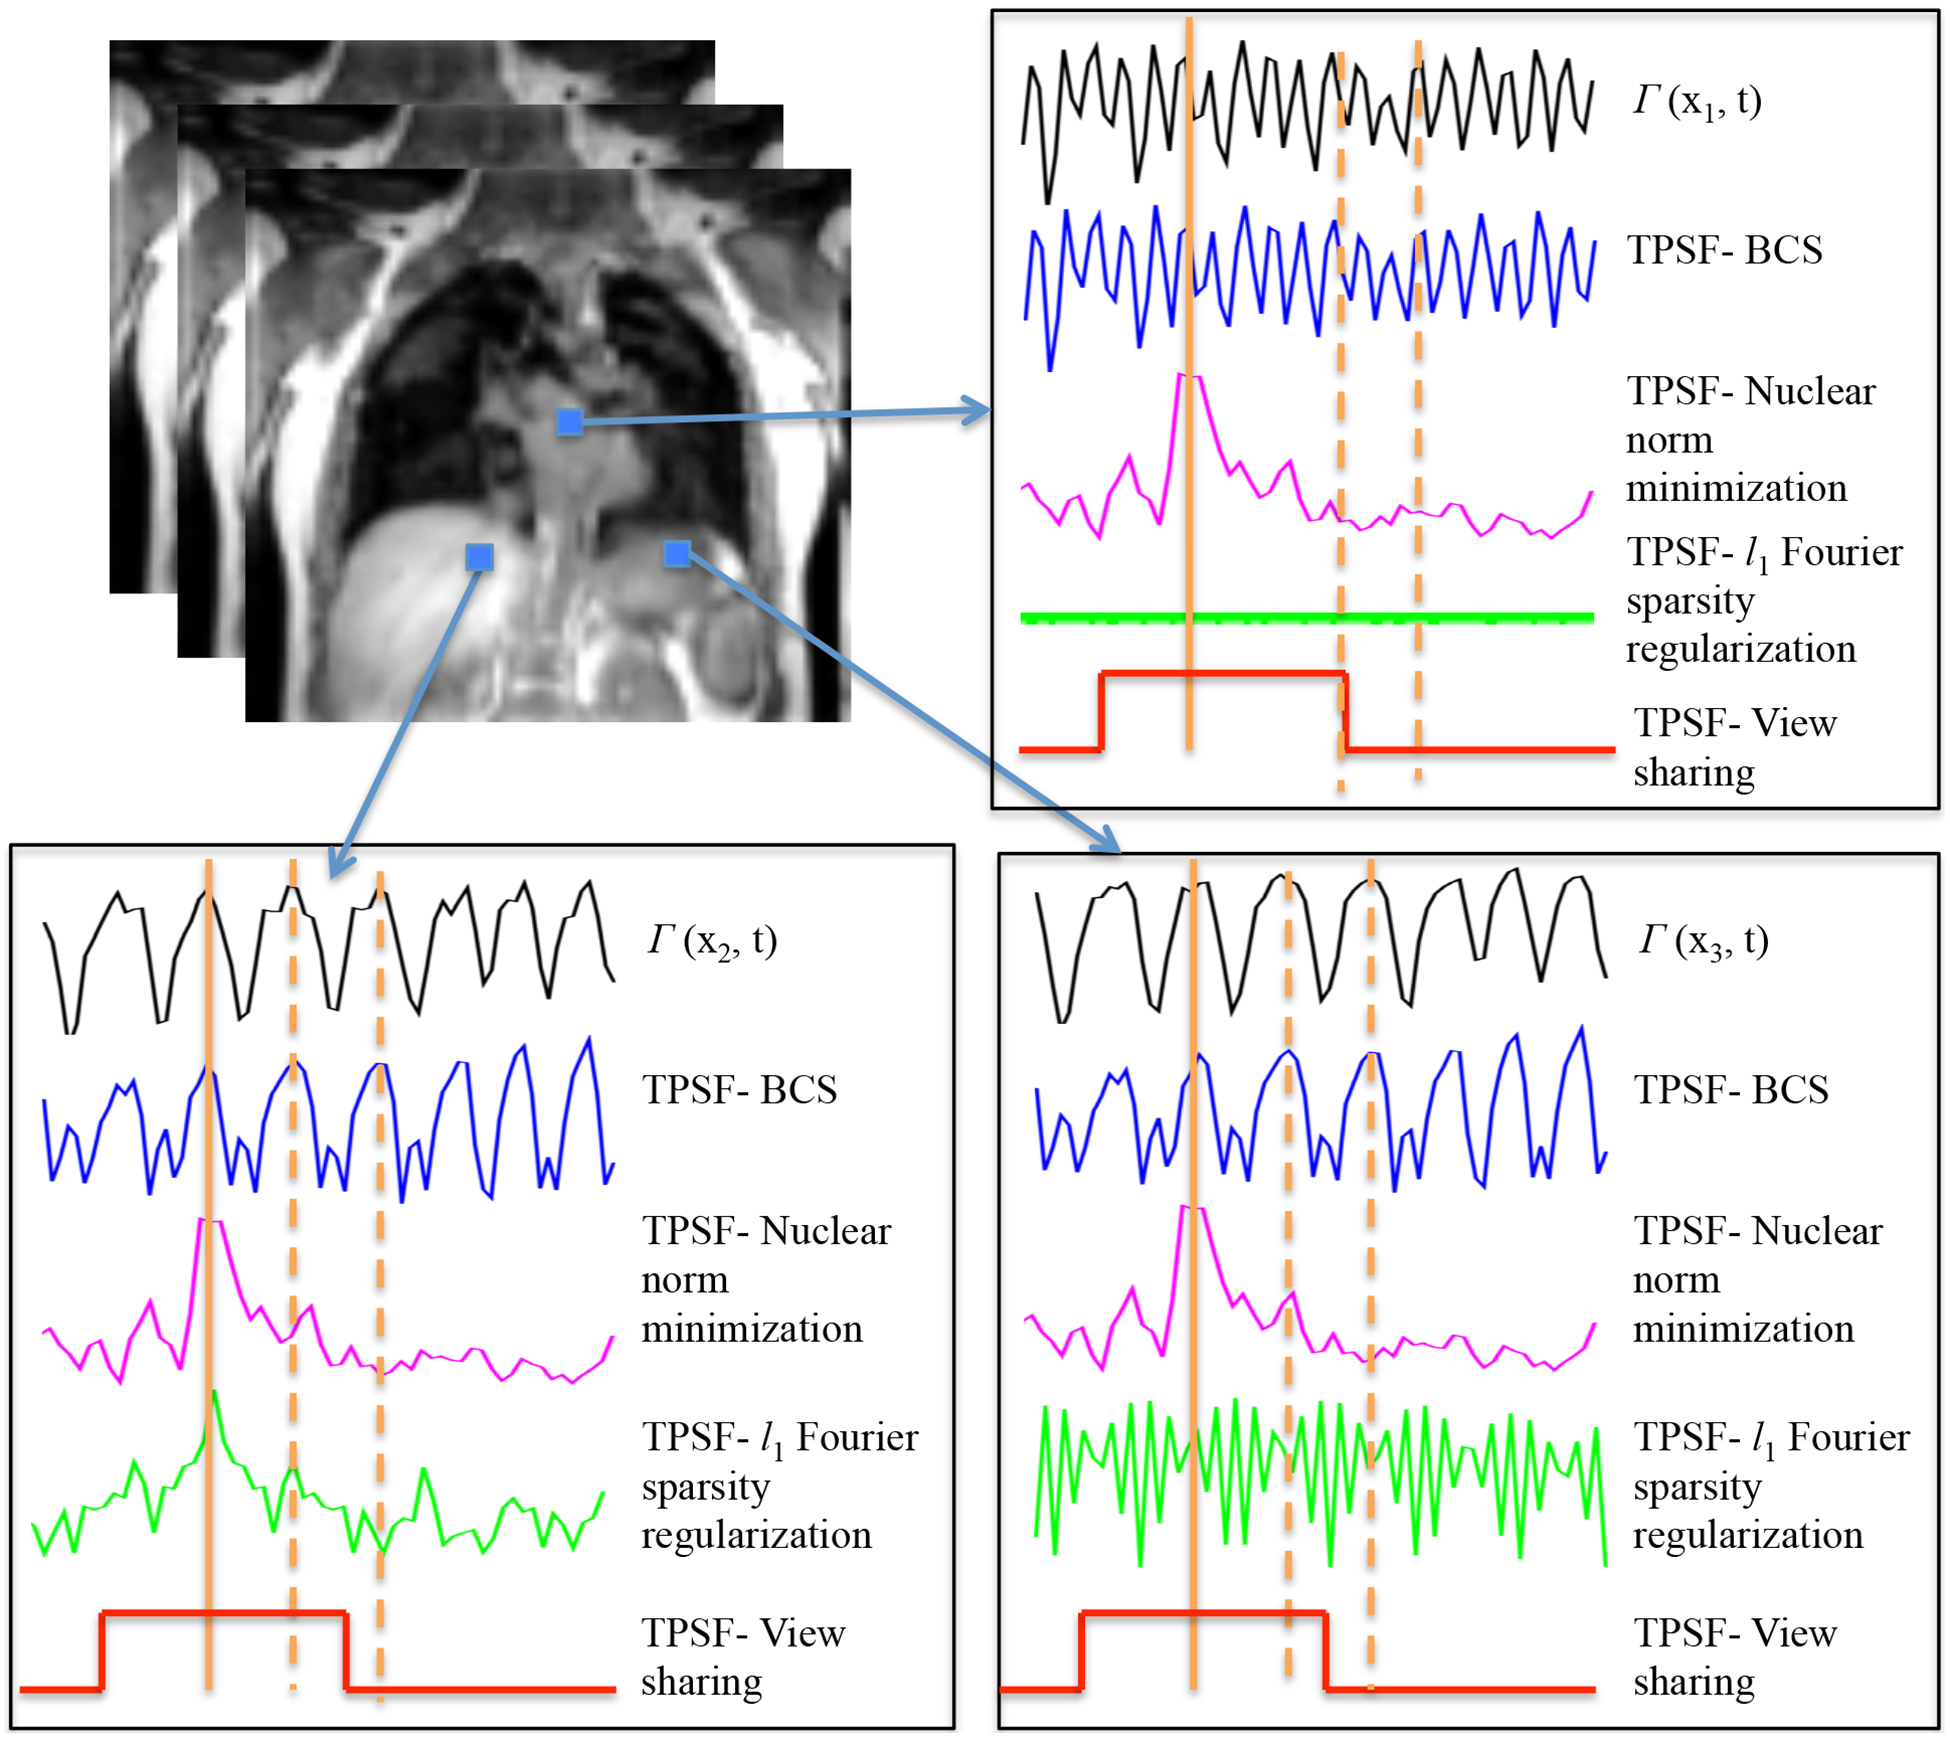
Illustrations of different algorithms: The TPSFs at a specific time frame at peak inhalation (shown by solid orange marker) and the underlying signal time profile are shown for three different pixels. The TPSF plots show that all the three constrained schemes provide non-local averaging of pixel values, thus offering good denoising without resulting in temporal blurring. However the TPSF of view sharing is spatially and temporally invariant and thus leads to significant temporal blurring. The TPSF of BCS and l1 Fourier sparsity regularization scheme are spatially varying, while the nuclear norm minimization scheme is spatially invariant. We see that the TPSF from BCS is in good correlation with the underlying time profiles (black curves) at the respective pixels. The TPSF for the time frames shown by the solid orange marker has high values corresponding to time frames in the similar respiratory phase (shown by dotted orange marker). These frames contribute predominantly to the recovery of the specific frame, since this recovery is a weighted combination of signal at other time frames and the weights are specified by TPSF.
REFERENCES
- 1.Gierada DS, Curtin JJ, Erickson SJ et al. Diaphragmatic motion: fast gradient-recalled-echo MR imaging in healthy subjects. Radiology 194(3), 879–884 (1995). [DOI] [PubMed] [Google Scholar]
- 2.Craighero S, Promayon E, Baconnier P et al. Dynamic echo-planar MR imaging of the diaphragm for a 3D dynamic analysis. European radiology 15(4), 742–748 (2005). [DOI] [PubMed] [Google Scholar]
- 3.Polkey MI, Kyroussis D, Hamnegard C-H et al. Diaphragm strength in chronic obstructive pulmonary disease. American journal of respiratory and critical care medicine 154(5), 1310–1317 (1996). [DOI] [PubMed] [Google Scholar]
- 4.Gold W & Boushey H. Pulmonary function testing. Textbook of respiratory medicine 1 844–846 (2000). [Google Scholar]
- 5.Gauthier AP, Verbanck S, Estenne M et al. Three-dimensional reconstruction of the in vivo human diaphragm shape at different lung volumes. Journal of Applied Physiology 76(2), 495–506 (1994). [DOI] [PubMed] [Google Scholar]
- 6.Kondo T, Kobayashi I, Taguchi Y et al. A dynamic analysis of chest wall motions with MRI in healthy young subjects*. Respirology 5(1), 19–25 (2000). [DOI] [PubMed] [Google Scholar]
- 7.Cluzel P, Similowski T, Chartrand-Lefebvre C et al. Diaphragm and Chest Wall: Assessment of the Inspiratory Pump with MR Imaging—Preliminary Observations 1. Radiology 215(2), 574–583 (2000). [DOI] [PubMed] [Google Scholar]
- 8.Kiryu S, Loring SH, Mori Y et al. Quantitative analysis of the velocity and synchronicity of diaphragmatic motion: dynamic MRI in different postures. Magnetic resonance imaging 24(10), 1325–1332 (2006). [DOI] [PubMed] [Google Scholar]
- 9.Kauczor H-U & Altes TA. MRI of the Lung. (Springer Science & Business Media, 2009). [Google Scholar]
- 10.Plathow C, Ley S, Fink C et al. Evaluation of chest motion and volumetry during the breathing cycle by dynamic MRI in healthy subjects: comparison with pulmonary function tests. Investigative radiology 39(4), 202–209 (2004). [DOI] [PubMed] [Google Scholar]
- 11.Plathow C, Ley S, Fink C et al. Analysis of intrathoracic tumor mobility during whole breathing cycle by dynamic MRI. International Journal of Radiation Oncology* Biology* Physics 59(4), 952–959 (2004). [DOI] [PubMed] [Google Scholar]
- 12.Plathow C, Schoebinger M, Fink C et al. Evaluation of lung volumetry using dynamic three-dimensional magnetic resonance imaging. Investigative radiology 40(3), 173–179 (2005). [DOI] [PubMed] [Google Scholar]
- 13.Plathow C, Fink C, Sandner A et al. Comparison of relative forced expiratory volume of one second with dynamic magnetic resonance imaging parameters in healthy subjects and patients with lung cancer. Journal of magnetic resonance imaging 21(3), 212–218 (2005). [DOI] [PubMed] [Google Scholar]
- 14.Blackall J, Ahmad S, Miquel M et al. MRI-based measurements of respiratory motion variability and assessment of imaging strategies for radiotherapy planning. Physics in medicine and biology 51(17), 4147 (2006). [DOI] [PubMed] [Google Scholar]
- 15.Tokuda J, Schmitt M, Sun Y et al. Lung motion and volume measurement by dynamic 3D MRI using a 128-channel receiver coil. Academic radiology 16(1), 22–27 (2009). [DOI] [PMC free article] [PubMed] [Google Scholar]
- 16.Griswold MA, Jakob PM, Heidemann RM et al. Generalized autocalibrating partially parallel acquisitions (GRAPPA). Magnetic resonance in medicine 47(6), 1202–1210 (2002). [DOI] [PubMed] [Google Scholar]
- 17.Bhave S, Lingala SG, Johnson CP et al. Accelerated whole-brain multi-parameter mapping using blind compressed sensing. Magnetic Resonance in Medicine (2015). [DOI] [PMC free article] [PubMed] [Google Scholar]
- 18.Lingala SG & Jacob M. Blind compressive sensing dynamic MRI. IEEE Transactions on Medical Imaging, 32(6), 1132–1145 (2013). [DOI] [PMC free article] [PubMed] [Google Scholar]
- 19.Lingala SG, DiBella E, Adluru G et al. Accelerating free breathing myocardial perfusion MRI using multi coil radial k- t SLR. Physics in medicine and biology 58(20), 7309 (2013). [DOI] [PMC free article] [PubMed] [Google Scholar]
- 20.Lingala SG, Hu Y, DiBella E et al. Accelerated dynamic MRI exploiting sparsity and low-rank structure: kt SLR. IEEE Transactions on Medical Imaging, 30(5), 1042–1054 (2011). [DOI] [PMC free article] [PubMed] [Google Scholar]
- 21.Majumdar A & Ward RK. Causal dynamic MRI reconstruction via nuclear norm minimization. Magnetic resonance imaging 30(10), 1483–1494 (2012). [DOI] [PubMed] [Google Scholar]
- 22.Majumdar A & Ward RK. Exploiting rank deficiency and transform domain sparsity for MR image reconstruction. Magnetic resonance imaging 30(1), 9–18 (2012). [DOI] [PubMed] [Google Scholar]
- 23.Walsh DO, Gmitro AF & Marcellin MW. Adaptive reconstruction of phased array MR imagery. Magnetic Resonance in Medicine 43(5), 682–690 (2000). [DOI] [PubMed] [Google Scholar]
- 24.Adluru G, McGann C, Speier P et al. Acquisition and reconstruction of undersampled radial data for myocardial perfusion magnetic resonance imaging. Journal of Magnetic Resonance Imaging 29(2), 466–473 (2009). [DOI] [PMC free article] [PubMed] [Google Scholar]
- 25.Liang Z-P. Spatiotemporal imagingwith partially separable functions Spatiotemporal imagingwith partially separable functions in 4th IEEE International Symposium on Biomedical Imaging: From Nano to Macro, 2007. ISBI 2007. . 988–991 (IEEE). [Google Scholar]
- 26.Lustig M, Santos JM, Donoho DL et al. kt SPARSE: High frame rate dynamic MRI exploiting spatiotemporal sparsity in Proceedings of the 13th Annual Meeting of ISMRM, Seattle. [Google Scholar]
- 27.Otazo R, Kim D, Axel L et al. Combination of compressed sensing and parallel imaging for highly accelerated first-pass cardiac perfusion MRI. Magnetic Resonance in Medicine 64(3), 767–776 (2010). [DOI] [PMC free article] [PubMed] [Google Scholar]
- 28.Jung H, Park J, Yoo J et al. Radial k-t FOCUSS for high-resolution cardiac cine MRI. Magnetic Resonance in Medicine 63(1), 68–78 (2010). [DOI] [PubMed] [Google Scholar]
- 29.Jung H, Sung K, Nayak KS et al. k-t FOCUSS: A general compressed sensing framework for high resolution dynamic MRI. Magnetic Resonance in Medicine 61(1), 103–116 (2009). [DOI] [PubMed] [Google Scholar]
- 30.Hansen PC & O’Leary DP. The use of the L-curve in the regularization of discrete ill-posed problems. SIAM Journal on Scientific Computing 14(6), 1487–1503 (1993). [Google Scholar]
- 31.Ravishankar S & Bresler Y. MR image reconstruction from highly undersampled k-space data by dictionary learning. IEEE Transactions on Medical Imaging, 30(5), 1028–1041 (2011). [DOI] [PubMed] [Google Scholar]
- 32.Sun D, Roth S & Black MJ. Secrets of optical flow estimation and their principles in Conference on Computer Vision and Pattern Recognition (CVPR), 2010. IEEE 2432–2439 (IEEE). [Google Scholar]
- 33.Rom WN & Markowitz SB. Environmental and occupational medicine. (Lippincott Williams & Wilkins, 2007). [Google Scholar]
- 34.Dean E Effect of body position on pulmonary function. Physical Therapy 65(5), 613–618 (1985). [DOI] [PubMed] [Google Scholar]
- 35.Moreno F & Lyons HA. Effect of body posture on lung volumes. Journal of Applied physiology 16(1), 27–29 (1961). [DOI] [PubMed] [Google Scholar]


