Abstract
Biomolecular droplets formed through phase separation have a tendency to fuse. The speed with which fusion occurs is a direct indicator of condensate liquidity, which is key to both cellular functions and diseases. Using a dual-trap optical tweezers setup, we found the fusion speeds of four types of droplets to differ by two orders of magnitude. The order of fusion speed correlates with the fluorescence of thioflavin T, which in turn reflects the macromolecular packing density inside droplets. Unstructured protein or polymer chains pack loosely and readily rearrange, leading to fast fusion. In contrast, structured protein domains pack more closely and have to break extensive contacts before rearrangement, corresponding to slower fusion. This molecular interpretation for disparate fusion speeds provides mechanistic insight into the assembly and aging of biomolecular droplets.
Keywords: biomolecular condensates, droplet fusion, electrostatic interactions, optical tweezers, phase transition
Graphical Abstract

The tendency of biomolecular droplets to fuse is key to cellular functions and diseases. Using optical tweezers, fluorescence microscopy, and theoretical modeling, Ghosh and Zhou have begun to unravel the molecular origin for disparate fusion speeds among different biomolecular droplets. They found that fusion speed is dictated by macromolecular packing density inside droplets, which can be reported by thioflavin T fluorescence.
Biomolecular condensates form the hubs of many cellular functions such as transcription and stress response.[1–2] These condensates include membraneless organelles such as nucleoli, P granules, and stress granules; typically appear as micro-sized droplets; and span material states from liquid-like to solid-like (or becoming solid-like over time, a process known as aging). In many cases, the liquid state is crucial for functionality and solidification is linked to neurodegeneration and other pathologies.[3–4] Thus an ATP-dependent process actively maintains the internal fluidity of nucleoli,[5] and RNA has been shown to increase the fluidity of LAF-1 protein droplets[6] and proposed to prevent condensates formed by prion-like RNA-binding proteins from solidification.[7]
The speed of fusion between droplets is a direct indicator of liquidity: fast fusion corresponds to a more liquid-like state whereas slow fusion a more solid-like state. A number of studies have reported fusion speeds, using either fluorescence microscopy[5–6, 8–13] or optical tweezers (OT).[3–4, 14–16] In the former case, one tracks the time change in the shape (e.g., aspect ratio or neck radius) of two fusing droplets. In the latter case, one tracks the forces that the fusing droplets exert as they move away from the optical traps. It is generally understood that fusion is accelerated by the interfacial surface tension (γ) of the droplets and retarded by viscosity (in particular, interior viscosity η when the bulk phase has much lower viscosity), and thus the fusion time (τf) is proportional to η and inversely proportional to γ. Observed fusion times of related systems can differ by one to two orders of magnitude.[5, 11, 13–14, 16] Slowed fusion in some cases was correlated with accelerated condensate aging.[3, 14]
We are just starting to identify and understand the physicochemical determinants of droplet fusion speed. Several studies have highlighted the role of the strength of intermolecular local interactions. For example, disease-linked mutations that increase the propensity for protein aggregation, presumably by strengthening local interactions, also slow down fusion.[3–4] Similarly, the fusion times of binary droplets formed by arginine- or lysine-containing peptides with purine or pyrimidine homopolymeric RNAs follow the order of the strengths of cation-pi interactions.[13, 16] Another potential determinant is molecular flexibility, as indicated by a 350-fold increase in fusion time when a subset of glycine residues in the prion-like domain of FUS was mutated into alanines.[14] Macromolecular crowding has been reported to slow down fusion, although different mechanisms have been implicated.[12, 15] There was also a suggestion that electrostatic interactions confer liquid-like properties whereas hydrophobic interactions confer solid-like properties,[17] but its generality was questioned.[18] Complicating the matter, some factors, e.g., interaction strength, may affect both surface tension and viscosity in the same direction, leaving the net effect on fusion time uncertain. For example, increasing salt concentration, by weakening electrostatic interactions, reduced both the viscosity and surface tension of PGL-3 droplets,[19] but τf was not reported. Droplets separately formed by two major components of nucleoli, nucleophosmin and fibrillarin, provide a clear demonstration of the tussle between surface tension and viscosity.[11] Compared to nucleophosmin droplets, fibrillarin droplets have a higher surface tension, which would make them fuse faster, but in fact their fusion time is over 100-fold longer, implicating viscosity as the overriding factor in this case. Lastly, we note our recent proposal of the structural compactness of component macromolecules as a determinant of material properties.[18]
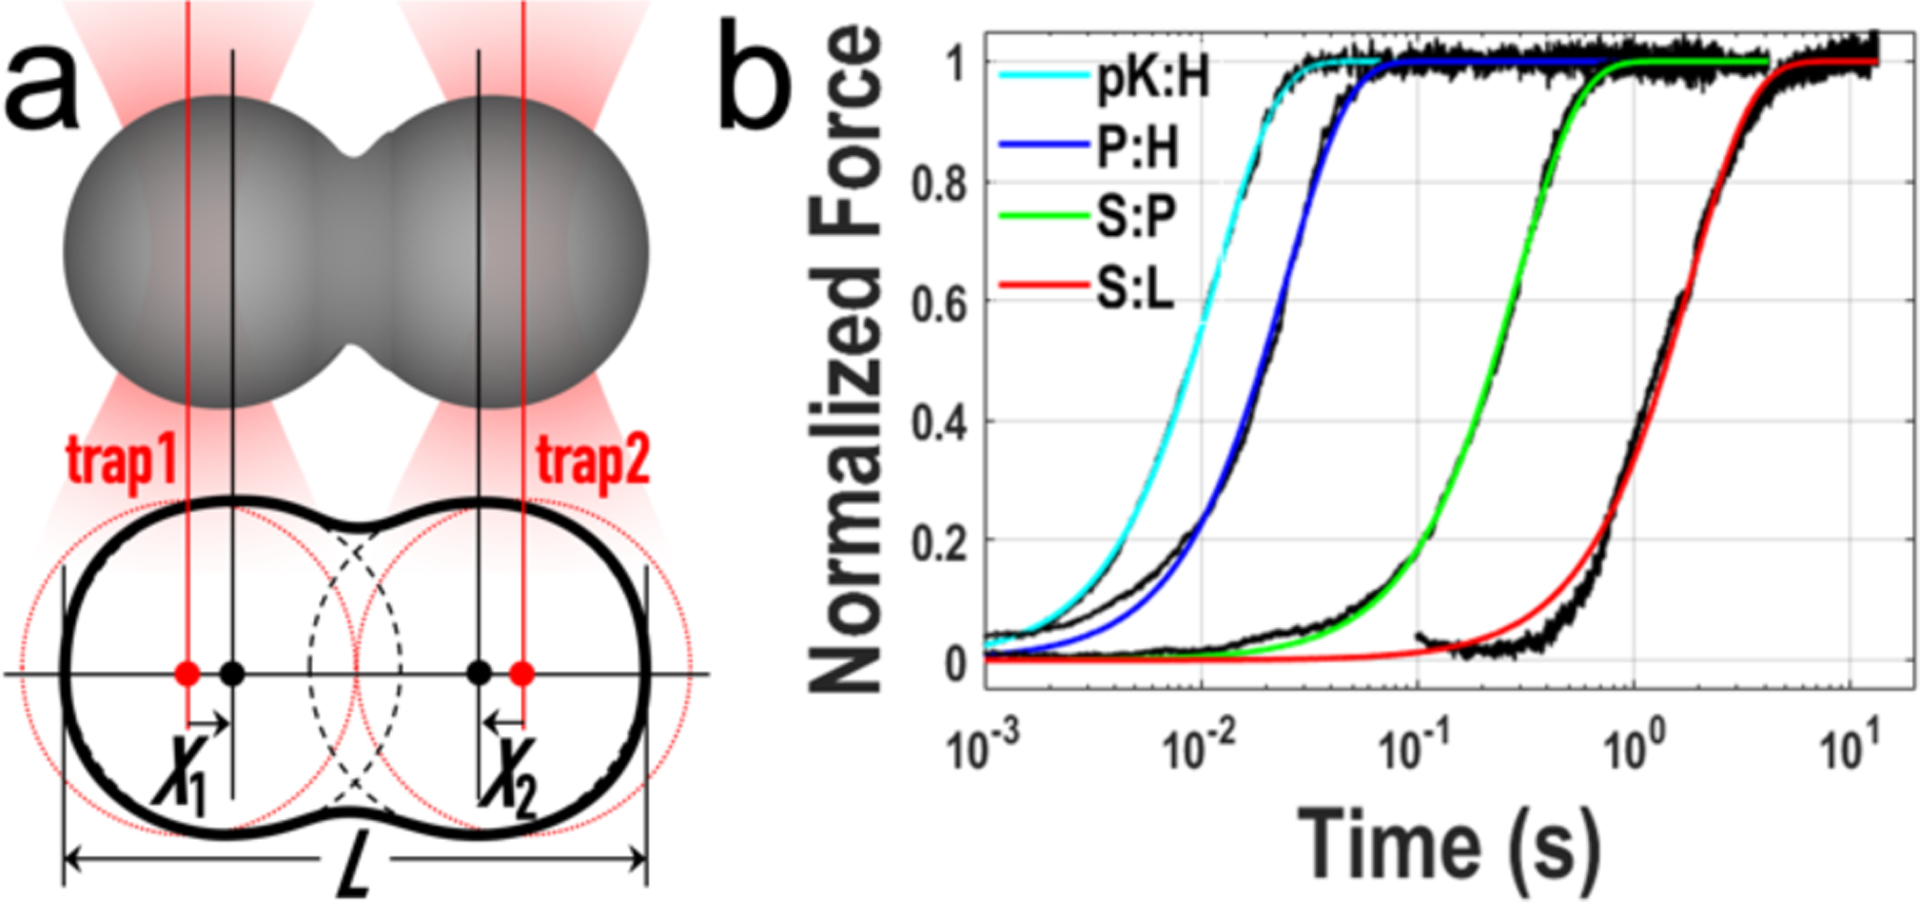
Here we present quantitative analysis of OT-tracked fusion progress curves for a variety of droplets (Figure 1) to gain better understanding of the physicochemical determinants of fusion speed. To provide a theoretical basis for the quantitative analysis, we model the droplet phase as an incompressible, viscous fluid, and the fusion process as a Stokes flow (see Supporting Information, Section 5). The reduction in the edge-to-edge distance, L, fits well to a stretched exponential,
with β = 1.5 and τf = 1.97(η/γ)R, where R denotes the radius of the droplets (Figure S1). We prepared the two fusing droplets in equal size (Supporting Information, Section 2). The difference between the forces detected by the two optical traps is proportional to the reduction in L (Supporting Information, Section 6; Figure S2), and thus also fits to the above stretched exponential (Figure 1b). The fusion times (τf) of four types of droplets, all with similar sizes, span over two orders of magnitude.
Figure 1.

Droplet fusion tracked by optical tweezers. a) Illustration of the fusion of two droplets under optical trapping. b) Force traces of 4 different types of droplets, with similar initial sizes (radii ranging from 1.9 to 2.9 μm).
Three of the four types of droplets were formed by binary mixtures, P:H, S:P, and S:L, of four macromolecular species: pentameric constructs of SH3 domains (S; acidic) and proline-rich motifs (P; basic), single-domain protein lysozyme (L; basic), and polymer heparin (H; acidic).[18] L and H were identified as representatives of suppressors and promoters, respectively, of S:P phase separation.[20] A fourth binary, H:L, formed network-like precipitates[18] and hence were unsuited for fusion study by OT. We chose another polymeric promoter, polylysine (pK),[20] whose mixtures with H also formed network-like precipitates at low salt but turned into droplets at 0.8 M KCl (Figure S3), similar to observations on a protein:DNA binary.[21] The pK:H droplets have the shortest fusion time. In comparison, P:H, S:P, and S:L droplets fuse at speeds approximately 2-, 20-, and 100-fold lower.
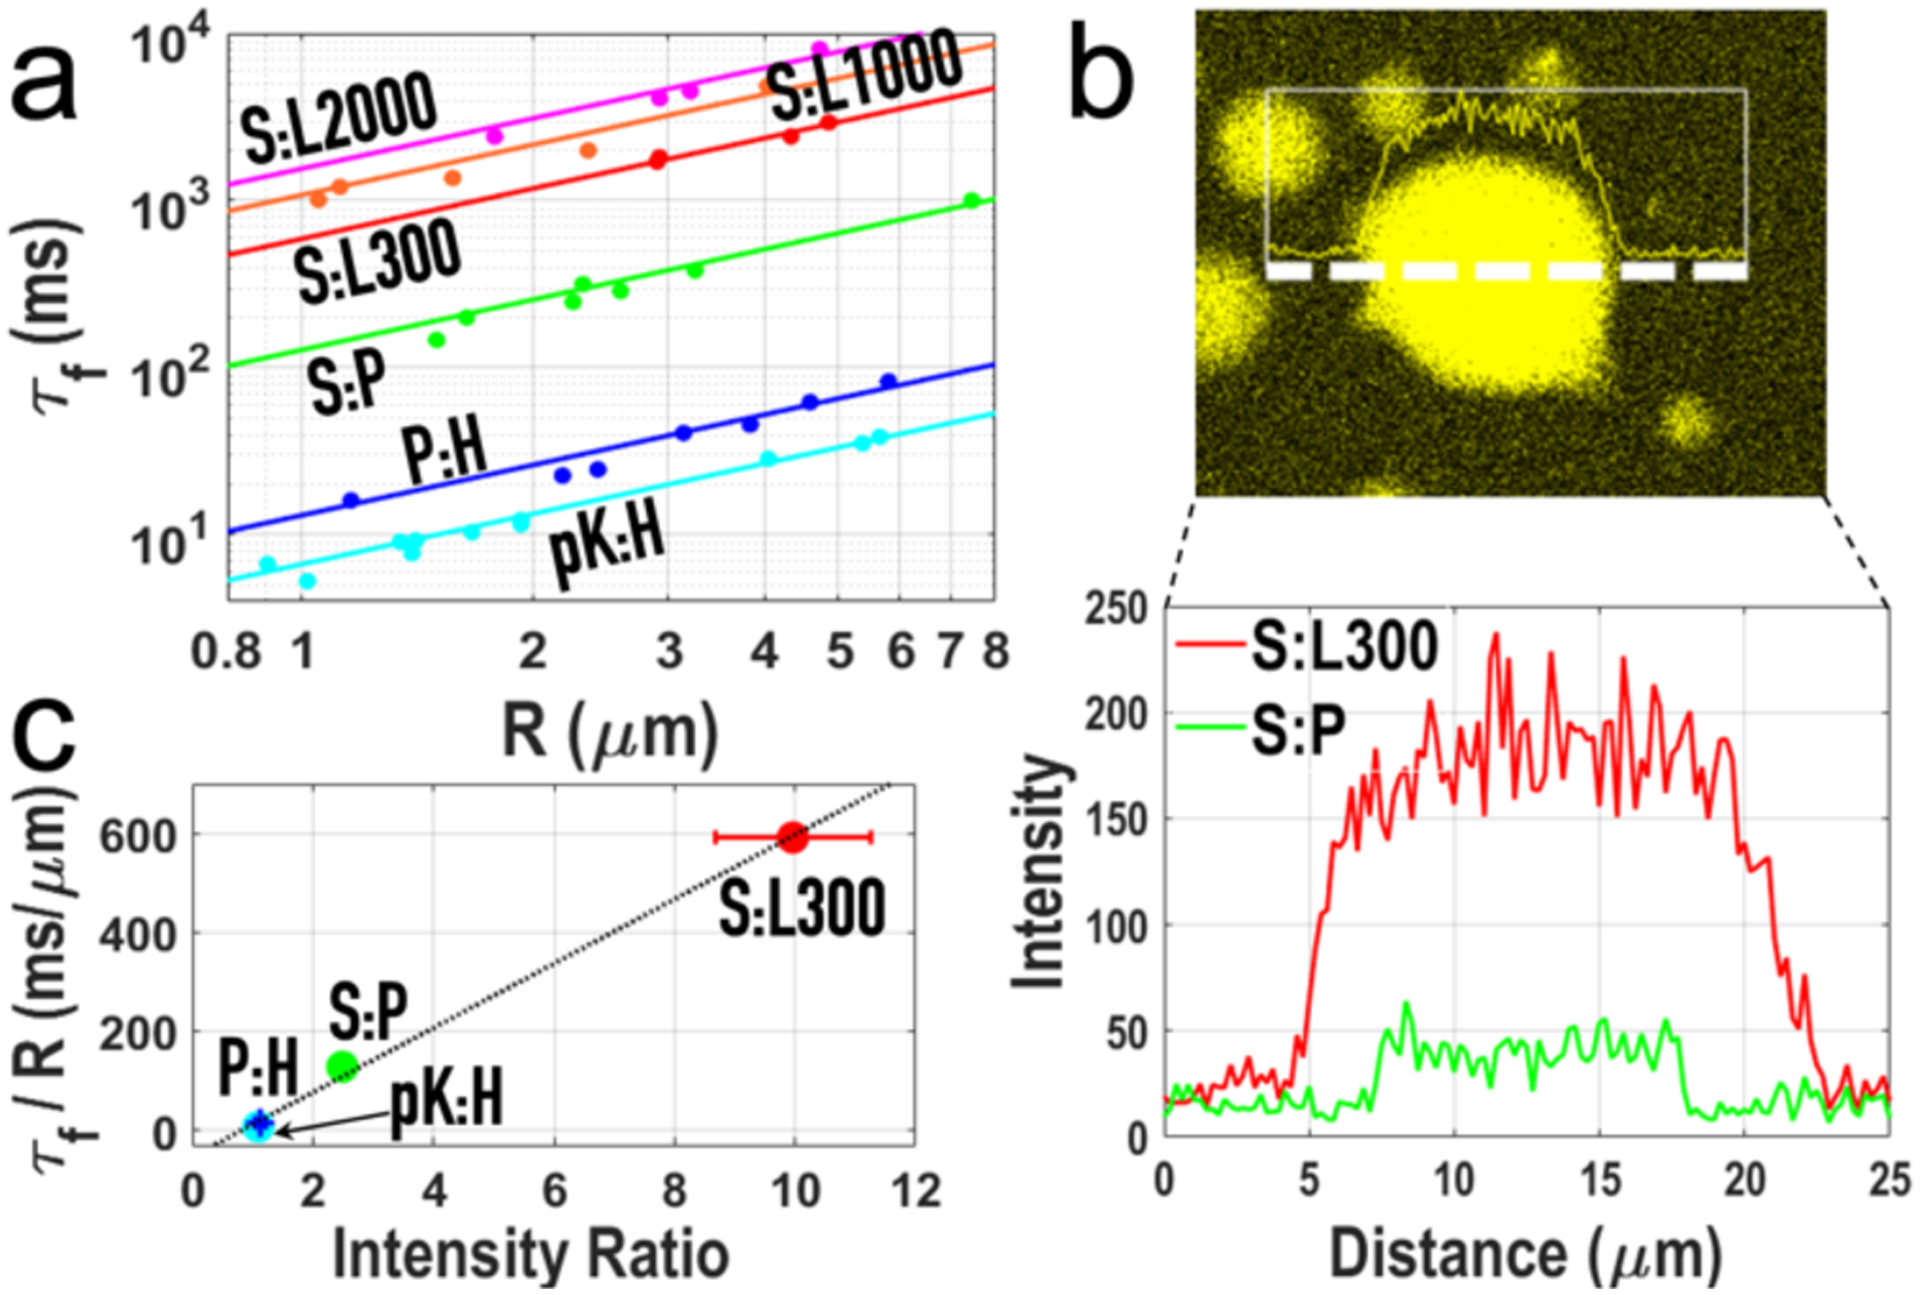
The Stokes model predicts a proportional relation between fusion time and droplet size. We measured fusion times for droplets with radii ranging from 0.8 to 8 μm, and they indeed follow a proportional relation (Figure 2a), as also reported in some previous studies.[5–6, 8–11] The slope S ≡ τf/R, equal to 1.97η/γ according to the Stokes model, is 6.7 ± 0.2, 13.1 ± 1.3, 128.0 ± 10.3, and 591.2 ± 42.8 ms/μm, respectively, for pK:H, P:H, S:P and S:L droplets. In previous work, we used a dye molecule, thioflavin T (ThT), to probe the macromolecular packing inside P:H, S:P and S:L droplets, and found near background-level, weak, and strong fluorescence, respectively, in these three types of droplets.[18] This ranking in fluorescence intensity is identical to the ranking in fusion time. Consistent with this trend, ThT inside pK:H droplets is completely dark. Among the four types of droplet, S exhibits a linear correlation with the ratio of the ThT fluorescence intensity in the droplet phase to that in the bulk phase (Figure 2b, c).
Figure 2.

Correlation of fusion time with ThT fluorescence intensity. a) Proportional relation between fusion time (τf) and droplet radius (R). Errors bars (representing the uncertainties in τf as a parameter in fitting force traces to a stretched exponential are smaller than the size of the symbols. b) A line scan of ThT fluorescence across 34 μm through an S:L droplet, and the intensity profiles for this S:L droplet and for an S:P droplet, illustrating the contrast in ThT fluorescence between these droplets. c) Linear relation between τf/R and the ratio of ThT fluorescence intensities inside and outside droplets. Error bars in τf/R represent the uncertainties in the slope of the linear fit in panel a); error bars in intensity ratio are standard deviations of replicate measurements (n = 5 – 8). Some errors are not visible because they are smaller than the size of the symbols.
To gain some insight into whether surface tension or viscosity is the dominant factor for fusion speed, we studied the fusion of S:L droplets prepared with higher L concentrations. Upon increasing L from 300 μM to 1000 and 2000 μM, S increases from 591.2 ± 42.8 ms/μm to 1080.5 ± 218.8 and 1554.0 ± 284.1 ms/μm, respectively (Figures 2a and S4a). The increase in S comes as the L concentration inside droplets also increases (Figure S4b). Interestingly, S:L droplets prepared at 486 μM of L collapse on a coverslip but those at 1736 μM of L stand as spherical, indicating an increase in surface tension at the higher L. Thus, with increasing L, the slowdown in fusion is opposite to what is expected from the increase in surface tension but in line with an anticipated increase in viscosity, hinting that the latter is the dominant factor. The viscosity of L solutions is indeed a rapidly increasing function of concentration;[22] ThT fluorescence intensities also increase with increasing L (Figure S5).
Support for viscosity as the likely dominant factor for fusion speeds among the four types of droplets came from shapes of droplets resting on a coverslip and from fluorescence recovery after photobleaching (FRAP). These two types of data are indicators of surface tension and viscosity, respectively. The tallness of resting droplets has the following order (Figure S6): pK:H ~ P:H < S:P ~ S:L2000, indicating some modest difference in surface tension between the first two types of droplets and the second two types. In contrast, the times for fluorescence recovery, τF, correlate well with the droplet fusion times (Figure S7). However, FRAP may not be solely determined by viscosity and can be affected by other details such as the bleached region to droplet size ratio. Direct measurements of surface tension and viscosity will be needed to unequivocally identify the dominant factor for fusion speeds.
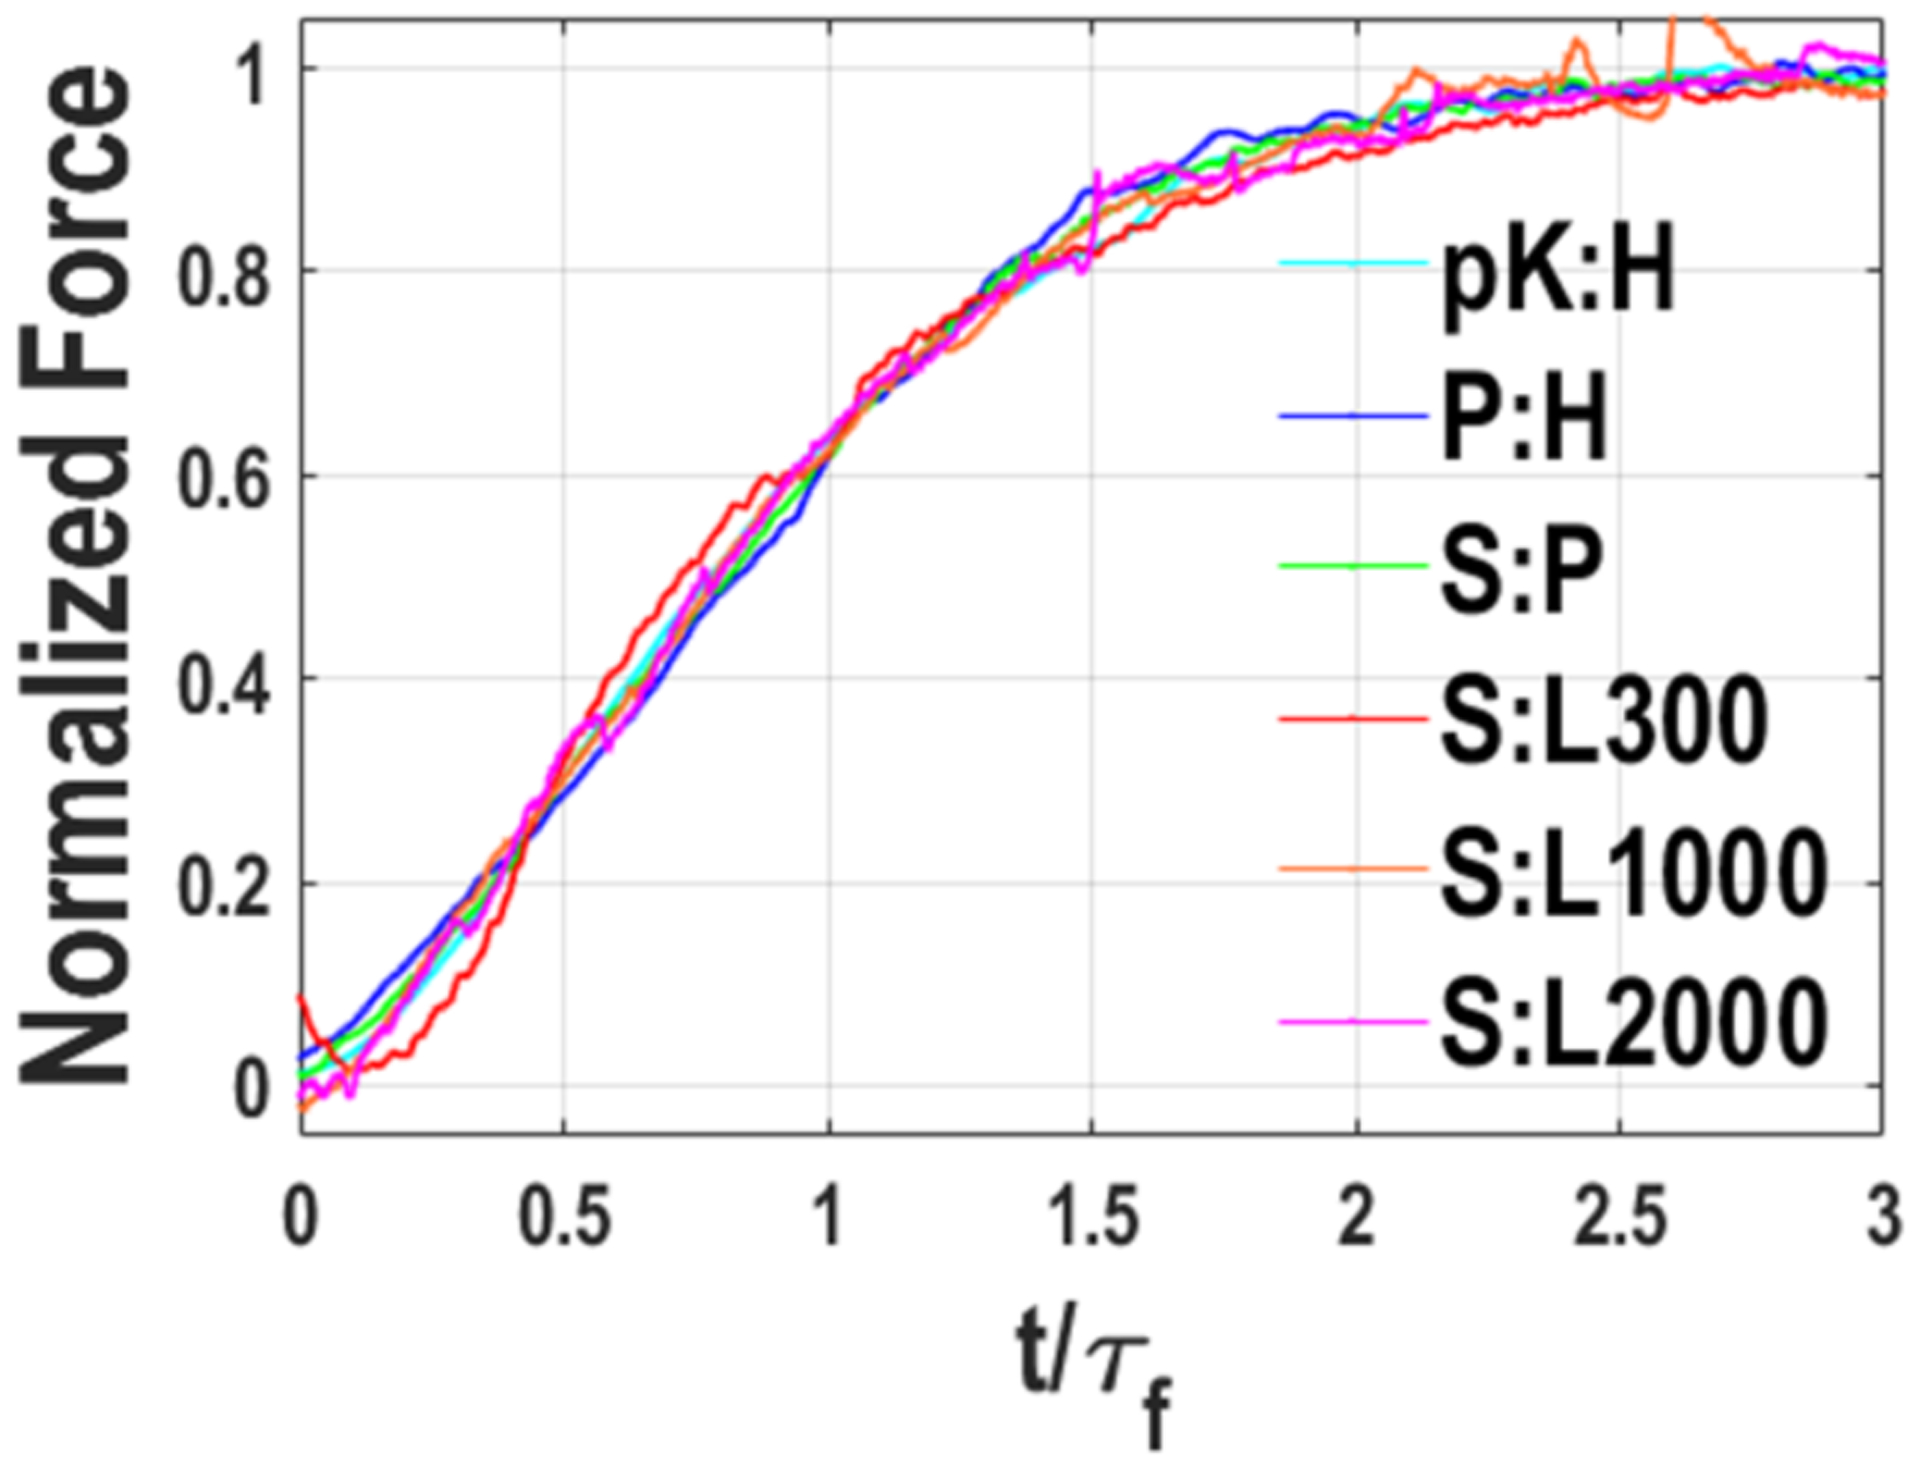
According to the Stokes model, a universal function, 1 – exp[−(t/τf)β], fits all OT-detected force progress curves. If time is scaled by the respective fusion times, then all progress curves should collapse to a master curve. Figure 3 shows that this is indeed the case, providing strong validation of the Stokes model.
Figure 3.

Collapse of fusion progress curves into a single master curve. Progress curves display running averages in window sizes ranging from 0.64 to 32 ms.
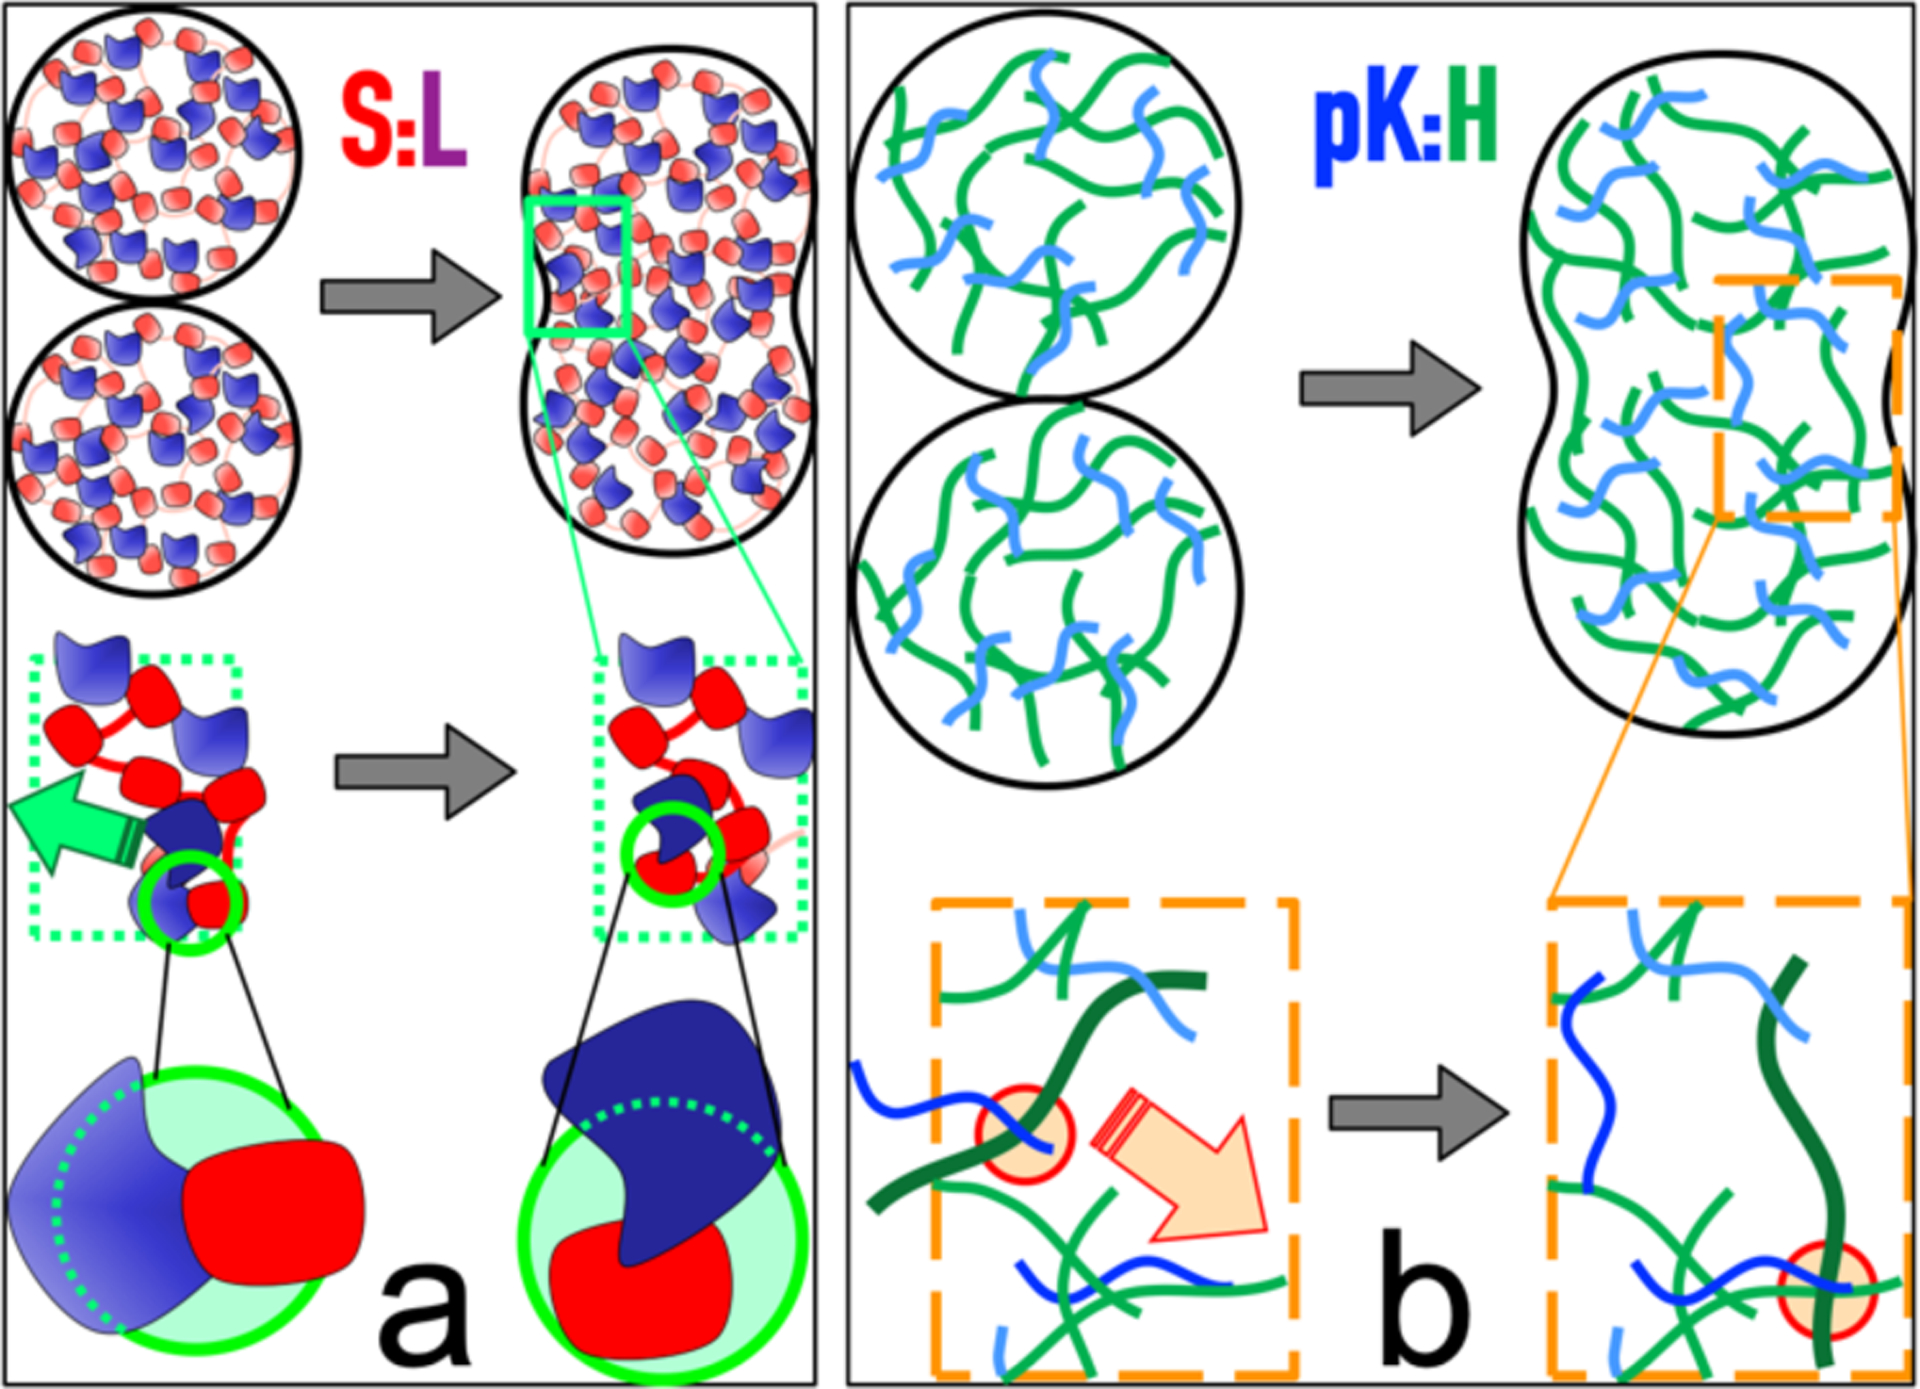
The correlation between fusion time and ThT fluorescence provides a starting point for seeking the molecular origin of the wide disparity in fusion speed between the different types of droplets studied here. Previously we have interpreted ThT fluorescence as reflecting macromolecular packing density, which in turn is related to the structural compactness of component macromolecules and to their multivalent interactions.[18] Let us consider the two extremes, i.e., S:L and pK:H droplets, in the τf spectrum. S comprises five flexibly-linked, structured, SH3 domains. In S:L droplets, each single-domain L molecule is surrounded by SH3 domains and linkers from multiple S molecules, likely including at least one pair of L and SH3 domains with extensive contacts and leading to close packing (Figure 4a). In contrast, pK and H are unstructured polymer chains. Intermolecular interactions in pK:H droplets largely involve multiple physical crosslinks between the chain molecules, corresponding to loose packing (Figure 4b). Fusion requires rearrangement of the macromolecular matrices inside two droplets, and can be rate-limited by the breakup of inter-domain contacts (as in S:L droplets) or inter-chain crosslinks (as in pK:H droplets). Breaking the extensive contacts between two structured domains takes more energy and hence occurs more slowly than breaking a physical crosslink between two unstructured chains, a distinction noted previously.[23] Rearrangement of unstructured chains is further aided by their molecular flexibility. These differences explain the much slower fusion of S:L droplets relative to pK:H droplets.
Figure 4.

Differences between S:L and pK:H droplets in packing and in contact breaking during fusion. a & b) In S:L (pK:H) droplets, macromolecules are closely (loosely) packed; fusion is rate-limited by breaking old inter-domain contacts (inter-chain physical crosslinks) before forming new ones.
P and H are also unstructured polymer chains and hence P:H and pK:H droplets have similar fusion speeds. The 2-fold higher fusion speed of pK:H droplets likely results from the higher KCl concentration that we had to work with, leading to weakened electrostatic attraction. Indeed, the fusion speed of P:H droplets is higher upon increasing KCl concentration (Figure S8). S:P droplets present an intermediate situation between S:L and P:H droplets, where intermolecular interactions consist of both domain-chain contacts (between SH3 in S and proline-rich motif in P) and interchain crosslinks (involving linkers in S). The resulting packing density and fusion speed are also intermediate between those of P:H and S:L droplets. Fusion speed and ThT fluorescence intensity are correlated because they are both dictated by macromolecular packing density inside droplets.
In summary, our data support two conclusions. First, structural compactness of component macromolecules is a new determinant of fusion speed. Second, this and other determinants can be integrated into a single fusion-speed predictor, i.e., macromolecular packing density, which can be reported by ThT fluorescence. The first conclusion offers an explanation for a dramatic, 80-fold speedup in droplet fusion when a structured domain was deleted in fibrillarin.[11] The second conclusion supports an indirect mechanism for the slowdown of droplet fusion by macromolecular crowding, apart from an increased viscosity of the bulk phase[12] and a crowder-mediated depletion force.[15] Namely, crowders in the bulk phase can displace component macromolecules into and thereby increase their packing density inside droplets.[24] It is also likely that glycine-to-alanine mutations in the FUS prion-like domain slow down fusion[14] by increasing the compactness of this domain and consequently the packing density of FUS in the droplet phase. The slowed fusion in both this and another study[3] was correlated with accelerated condensate aging, implicating a shared mechanism between slow fusion and aging. The conclusions of our study provide molecular-level insight into the assembly and aging of biomolecular condensates.
Supplementary Material
Acknowledgements
Fluorescence microscopy data were acquired in the Fluorescence Imaging Core at the Research Resources Center of University of Illinois at Chicago; we thank Dr. Peter T. Toth and Ke Ma for technical assistance. This work was supported by National Institutes of Health Grant GM118091.
Footnotes
Supporting information for this article is given via a link at the end of the document.
Contributor Information
Archishman Ghosh, Department of Chemistry, University of Illinois at Chicago, Chicago, IL 60607 (USA).
Huan-Xiang Zhou, Department of Chemistry, University of Illinois at Chicago, Chicago, IL 60607 (USA); Department of Physics, University of Illinois at Chicago, Chicago, IL 60607 (USA).
References
- [1].Cho WK, Spille JH, Hecht M, Lee C, Li C, Grube V, Cisse II, Science 2018, 361, 412–415. [DOI] [PMC free article] [PubMed] [Google Scholar]
- [2].Kroschwald S, Munder MC, Maharana S, Franzmann TM, Richter D, Ruer M, Hyman AA, Alberti S, Cell Rep 2018, 23, 3327–3339. [DOI] [PubMed] [Google Scholar]
- [3].Patel A, Lee HO, Jawerth L, Maharana S, Jahnel M, Hein MY, Stoynov S, Mahamid J, Saha S, Franzmann TM, Pozniakovski A, Poser I, Maghelli N, Royer LA, Weigert M, Myers EW, Grill S, Drechsel D, Hyman AA, Alberti S, Cell 2015, 162, 1066–1077. [DOI] [PubMed] [Google Scholar]
- [4].Gui X, Luo F, Li Y, Zhou H, Qin Z, Liu Z, Gu J, Xie M, Zhao K, Dai B, Shin WS, He J, He L, Jiang L, Zhao M, Sun B, Li X, Liu C, Li D, Nat Commun 2019, 10, 2006. [DOI] [PMC free article] [PubMed] [Google Scholar]
- [5].Brangwynne CP, Mitchison TJ, Hyman AA, Proc Natl Acad Sci U S A 2011, 108, 4334–4339. [DOI] [PMC free article] [PubMed] [Google Scholar]
- [6].Elbaum-Garfinkle S, Kim Y, Szczepaniak K, Chen CC, Eckmann CR, Myong S, Brangwynne CP, Proc Natl Acad Sci U S A 2015, 112, 7189–7194. [DOI] [PMC free article] [PubMed] [Google Scholar]
- [7].Maharana S, Wang J, Papadopoulos DK, Richter D, Pozniakovsky A, Poser I, Bickle M, Rizk S, Guillen-Boixet J, Franzmann TM, Jahnel M, Marrone L, Chang YT, Sterneckert J, Tomancak P, Hyman AA, Alberti S, Science 2018, 360, 918–921. [DOI] [PMC free article] [PubMed] [Google Scholar]
- [8].Brangwynne CP, Eckmann CR, Courson DS, Rybarska A, Hoege C, Gharakhani J, Julicher F, Hyman AA, Science 2009, 324, 1729–1732. [DOI] [PubMed] [Google Scholar]
- [9].Hubstenberger A, Noble SL, Cameron C, Evans TC, Dev Cell 2013, 27, 161–173. [DOI] [PMC free article] [PubMed] [Google Scholar]
- [10].Zhang H, Elbaum-Garfinkle S, Langdon EM, Taylor N, Occhipinti P, Bridges AA, Brangwynne CP, Gladfelter AS, Mol Cell 2015, 60, 220–230. [DOI] [PMC free article] [PubMed] [Google Scholar]
- [11].Feric M, Vaidya N, Harmon TS, Mitrea DM, Zhu L, Richardson TM, Kriwacki RW, Pappu RV, Brangwynne CP, Cell 2016, 165, 1686–1697. [DOI] [PMC free article] [PubMed] [Google Scholar]
- [12].Caragine CM, Haley SC, Zidovska A, Phys Rev Lett 2018, 121, 148101. [DOI] [PMC free article] [PubMed] [Google Scholar]
- [13].Boeynaems S, Holehouse AS, Weinhardt V, Kovacs D, Van Lindt J, Larabell C, Van Den Bosch L, Das R, Tompa PS, Pappu RV, Gitler AD, Proc Natl Acad Sci U S A 2019, 116, 7889–7898. [DOI] [PMC free article] [PubMed] [Google Scholar]
- [14].Wang J, Choi JM, Holehouse AS, Lee HO, Zhang X, Jahnel M, Maharana S, Lemaitre R, Pozniakovsky A, Drechsel D, Poser I, Pappu RV, Alberti S, Hyman AA, Cell 2018, 174, 688–699 e616. [DOI] [PMC free article] [PubMed] [Google Scholar]
- [15].Kaur T, Alshareedah I, Wang W, Ngo J, Moosa MM, Banerjee PR, Biomolecules 2019, 9, 71. [DOI] [PMC free article] [PubMed] [Google Scholar]
- [16].Alshareedah I, Kaur T, Ngo J, Seppala H, Kounatse LD, Wang W, Moosa MM, Banerjee PR, J Am Chem Soc 2019, 141, 14593–14602. [DOI] [PMC free article] [PubMed] [Google Scholar]
- [17].Weber SC, Curr Opin Cell Biol 2017, 46, 62–71. [DOI] [PubMed] [Google Scholar]
- [18].Ghosh A, Zhang X, Zhou HX, J Am Chem Soc 2020, 142, 8848–8861. [DOI] [PMC free article] [PubMed] [Google Scholar]
- [19].Jawerth LM, Ijavi M, Ruer M, Saha S, Jahnel M, Hyman AA, Julicher F, Fischer-Friedrich E, Phys Rev Lett 2018, 121, 258101. [DOI] [PubMed] [Google Scholar]
- [20].Ghosh A, Mazarakos K, Zhou HX, Proc Natl Acad Sci U S A 2019, 116, 19474–19483. [DOI] [PMC free article] [PubMed] [Google Scholar]
- [21].Zhou H, Song Z, Zhong S, Zuo L, Qi Z, Qu LJ, Lai L, Angew Chem Int Ed Engl 2019, 58, 4858–4862. [DOI] [PubMed] [Google Scholar]
- [22].Godfrin PD, Hudson SD, Hong K, Porcar L, Falus P, Wagner NJ, Liu Y, Phys Rev Lett 2015, 115, 228302. [DOI] [PubMed] [Google Scholar]
- [23].Zhou HX, Trends Biochem Sci 2012, 37, 43–48. [DOI] [PMC free article] [PubMed] [Google Scholar]
- [24].Nguemaha V, Zhou HX, Sci Rep 2018, 8, 6728. [DOI] [PMC free article] [PubMed] [Google Scholar]
Associated Data
This section collects any data citations, data availability statements, or supplementary materials included in this article.


