

Abstract
High‐dose (HD) methotrexate (MTX) is a critical component of treatment for hematologic malignancies in children and young adults. Therapeutic drug monitoring is necessary due to substantial interindividual variation in MTX clearance. Common function‐altering polymorphisms in SLCO1B1 (encodes OATP1B1, which transports MTX) may contribute to clearance variability. We performed pharmacokinetic modeling using data for 106 children and young adults treated with HD MTX for hematologic malignancies; of 396 total courses of HD MTX, 360 consisted of 5 g/m2 over 24 hours. We evaluated the contribution of clinical covariates and SLCO1B1 genotype (388A>G and 521T>C) to MTX clearance variability. Of the clinical covariates studied, patient weight improved the pharmacokinetic model most significantly (P < 0.001). The addition of the SLCO1B1 variants individually further improved the model (P < 0.05 for each). An interaction between these variants was suggested when both were included (P = 0.017). SLCO1B1 genotype should be considered in efforts to personalize HD MTX dosing.
Methotrexate (MTX) is an antifolate chemotherapy agent. High‐dose (HD) MTX regimens (> 500 mg/m2 per dose), integral to the treatment of children and young adults with acute lymphoblastic leukemia (ALL) and other malignancies, are administered intravenously and require significant inpatient supportive care to reduce risk for toxicities. The addition of HD MTX to therapy for high‐risk B‐cell ALL significantly improved survival for high‐risk B‐cell ALL 1 and reduced central nervous system relapse in lymphoblastic lymphoma. 2 , 3
Although highly effective, HD MTX has a narrow therapeutic window with potentially severe toxicities (e.g., myelosuppression, mucositis, hepatotoxicity, nephrotoxicity, and neurotoxicity). 4 Drug level monitoring is required to reduce risk for toxicities. Greater than 90% of children diagnosed with cancer in the United States are treated per Children’s Oncology Group (COG) protocols, on which supportive care measures are adjusted for supratherapeutic MTX levels but no changes are made for low MTX levels, suggesting rapid clearance. 4 Drug clearance following HD MTX administration shows significant interpatient variability, 5 , 6 , 7 with increased toxicity seen with slow clearance 8 , 9 and decreased efficacy with rapid clearance. 10 Clinical variables potentially affecting HD MTX clearance include age, sex, race/ethnicity, and baseline renal function, but each of these factors accounted for < 5% of variability in MTX clearance. 6 , 7 , 11
The MTX disposition pathway is complex, involving numerous transporters and enzymes. 12 MTX primarily undergoes renal excretion, 13 but due to significant contribution of enterohepatic circulation to its disposition, both transporters in the kidneys and liver are important determinants of clearance. 14 The OATPs (SLCO), are uptake transporters involved in the disposition of a variety of substrates, including steroid hormones, antimicrobials, chemotherapeutic agents, and statins. 15 In the liver, MTX is transported by OATP1B1, expressed at the basolateral membrane of hepatocytes. 16 , 17 The SLCO1B1 gene has multiple function‐altering variants. 18 The SLCO1B1 521T>C single nucleotide polymorphism (SNP; rs4149056), present in ~ 15% of subjects of European or Asian descent, 19 results in impaired transport of many substrates, 17 with important clinical consequences (e.g., significantly higher rates of statin‐induced myopathy in patients with one or more variant 521T>C alleles, due to reduced hepatic uptake resulting in increased systemic exposure to the drug). 20 The SLCO1B1 388A>G variant (rs2306283) has conflicting reports regarding its functional consequences, possibly due to substrate‐specific effects or differences in experimental conditions utilized, but for some drugs, this variant has significant effects on disposition. 18
Several SLCO1B1 variants, including 521T>C, have been shown in genomewide association studies to be associated with HD MTX clearance in pediatric patients with ALL. 6 , 7 , 11 In these studies, SLCO1B1 variants explained ~ 10% of interpatient variability in MTX clearance; 6 , 11 the SLCO1B1 521T>C variant alone explained 2% of variability, with patients with SLCO1B1 521CC having, on average, a 13% lower MTX clearance than patients with 521TT. 7 The contribution of genetic variants was significantly larger than seen for any of the clinical covariates studied except treatment arm (which affected MTX dosing). Other significant SLCO1B1 variants were in linkage disequilibrium with 521T>C, and the effect of the 388A>G variant was seen only after controlling for 521T>C genotype. 7 , 11 Smaller studies have found similar results. 21 , 22
However, in prior studies, 6 , 7 , 11 most patients received lower doses (1–2.5 g/m2) of HD MTX, with a minority receiving HD MTX at 5 g/m2, 7 which is the standard dosing used for contemporary COG protocols. The pharmacokinetic (PK) parameters of MTX vary significantly with dosing regimen. 23 , 24 The impact of genetic variation in a given transporter may vary with dose due to saturation of a transporter at higher doses or dose‐dependent stimulation of alternative elimination pathways. 25 Additionally, in the largest study, only MTX levels through 48 hours after infusion were included, 7 but a significant number of patients will not have achieved drug clearance, and subsequent MTX levels after 48 hours may have an effect on toxicities. 8
Current COG HD MTX protocols dose based on body surface area (BSA) without considering the impact of clinical or genetic factors on drug exposure. Because of the importance of drug clearance to toxicity and outcomes, precisely dosing HD MTX in each patient to achieve target PK parameters would maximize efficacy while minimizing toxicity. Additional data regarding the impact of clinical and genetic factors on HD MTX clearance, particularly at the most commonly used dosing of 5 g/m 2 , is needed for generation of drug dosing algorithms. We focused on two polymorphisms in SLCO1B1, 521T>C and 388A>G, because both are common variants with previous literature suggesting an effect on MTX PKs.
METHODS
Study population and recruitment
We evaluated 106 patients with B‐cell or T‐cell ALL or lymphoblastic lymphoma who were treated at Vanderbilt University Medical Center (VUMC) on a COG protocol involving at least one dose of HD MTX (Table 1 ). Patients up to 30 years of age are typically eligible for COG protocols and were included.
Table 1.
Summary information for all evaluated patients
| Human subjects (n = 89) | BioVU (n = 17) | Combined (n = 106) | |
|---|---|---|---|
|
Age in years at time of first course of HD MTX: median (range) |
9.4 (0.6–27.6) | 15.6 (3.9–27.4) | 10.1 (0.6–27.6) |
| > 18 years, n | 6 | 8 | 14 |
| > 25 years, n | 1 | 4 | 5 |
| Male sex, n (%) | 42 (47.2) | 11 (64.7) | 53 (50.0) |
| Race/ethnicity, n (%)a | |||
| White | 75 (84.3) | 13 (76.5) | 88 (83.0) |
| Hispanic/Latino | 10 (11.2) | 1 (5.9) | 11 (10.4) |
| Otherb | 4 (4.5) | 3 (17.6) | 7 (6.6) |
| Total number of MTX courses analyzed | 337 | 59 | 396 |
| Total number of MTX levels assessed | 1676 | 314 | 1,990 |
| Number of MTX levels per patient per course: median (range) | 5 (1–11) | 5 (2–20) | 5 (1–20) |
| Number of courses at each MTX dosing level | |||
| 1 g/m2 infused over 24 hours | 10 | 7 | 17 |
| 1 g/m2 infused over 36 hours | 3 | 0 | 3 |
| 2 g/m2 infused over 24 hours | 2 | 0 | 2 |
| 3 g/m2 infused over 24 hours | 1 | 1 | 2 |
| 4 g/m2 infused over 24 hours | 8 | 3 | 11 |
| 5 g/m2 infused over 24 hours | 313 | 47 | 360 |
| 8 g/m2 infused over 24 hours | 0 | 1 | 1 |
| Treatment protocols utilized | |||
| B‐ALL: COG AALL0031, AALL0232, AALL0631, AALL07P4, AALL1131; CCG 1961 | |||
| Relapsed B‐ALL: COG AALL02P2, COG AALL1331; UK‐R3 | |||
| T‐ALL: COG AALL0434, AALL1231 | |||
| Lymphoblastic lymphoma: CCG A5917 | |||
ALL, acute lymphoblastic leukemia; CCG, Children’s Cancer Group; COG, Children’s Oncology Group; HD, high dose; MTX, methotrexate.
Patient‐reported, as documented in the electronic health record.
Other ethnicities noted in the combined cohort were black (n = 3), East Asian (n = 1), and mixed ethnicity (n = 3). Mixed ethnicity patients all reported one parent who is white and one parent who is black (n = 2) or East Asian (n = 1).
For the human subject cohort, patients were approached at routine care visits and written informed consent was obtained. BioVU, VUMC’s DNA biobank linked to a de‐identified version of the medical record known as the Synthetic Derivative, 26 was utilized to obtain additional patients not included in the human subjects portion, such as those who were deceased. Procedures were utilized to avoid duplication of patients between cohorts. See Supplementary Information for details on subject identification. Patients who had received an allogeneic bone marrow transplant prior to the time of DNA sample collection were excluded from the study. This study was approved by the Vanderbilt Institutional Review Board.
Patients in the human subject cohort were treated with HD MTX between 2003 and 2018. Due to date shifting of up to 1 year in either direction used during the de‐identification process for BioVU, the dates this cohort were treated can only be approximated; shifted dates of treatment were 2010–2017. Patients were treated mostly per COG protocols, with a few treated per older Children’s Cancer Group or other protocols (Table 1 ).
DNA sample collection
For the human subject cohort, genomic DNA was extracted from lymphocytes from either a 5 mL blood sample or a saliva sample using an Oragene OGR‐500 kit. BioVU DNA samples were obtained from the biobank, and DNA extraction and biobanking of human subject samples were performed by the Vanderbilt Technologies for Advanced Genomics (VANTAGE) core laboratory per established protocols. Genotyping for SLCO1B1 variants of interest was completed by VANTAGE using custom designed multiplexed MassARRAY iPLEX Gold SNP panels (Agena Bioscience, San Diego, CA) evaluated in a MassArray Typer 4.0; panel designs are available upon request. Evaluated SNPs had call rates of > 95%.
Treatment details and data collection
The VUMC electronic health records and the BioVU Synthetic Derivative were utilized to collect clinical information, including diagnosis, sex, race/ethnicity (self‐reported), age, dosing of MTX, serial plasma MTX levels, and baseline creatinine and total bilirubin values prior to each course of HD MTX. All subjects received HD MTX intravenously with bicarbonate‐containing i.v. fluids and i.v. folinic acid as a rescue agent, with individual protocols dictating the MTX dose and infusion time and details of supportive care. For most subjects (n = 98), 10% of the total MTX dose was given as a bolus over 0.5 hours followed by 90% over 23.5 hours. MTX dose and infusion time were included in data collection and PK modeling. The dose of MTX was based on the patient’s BSA and not capped at a maximum dose. Drugs known to affect MTX clearance (such as sulfamethoxazole‐trimethoprim, penicillins, nonsteroidal anti‐inflammatory drugs, and tyrosine kinase inhibitors) were avoided during HD MTX. No patients in our study required glucarpidase administration for treatment of supratherapeutic MTX levels. The i.v. fluid type and rate were dictated by COG protocols for administering HD MTX; most patients received D5¼NS with 30 mEq NaHCO3/L at 125 mL/m2/hour.
Plasma MTX levels were collected as part of each subject’s treatment protocol and were measured in the VUMC clinical laboratory using a Clinical Laboratory Improvement Amendments (CLIA)‐approved, validated homogenous enzyme immunoassay procedure (ARK Diagnostics, Fremont, CA; limits of detection 0.04–1200 μM). Levels were collected per protocol, usually at 24, 42, and 48 hours after the start of MTX and then at least daily thereafter (timing based on treating clinician’s discretion) until the MTX level was < 0.10 μM at which time the patient could be discharged from the hospital and no further levels were typically collected. In a few cases, the clinician elected to continue checking levels after the value reached < 0.10 μM; for consistency, we utilized drug levels up to and including the first value that was < 0.10 μM. A small number of MTX levels that were considered by the investigators to be spurious were excluded from the data set. Levels below the limit of quantitation (BLOQ; < 0.04 μM) were recorded as 0.04 μM and further levels for that MTX course were excluded. Only 16 of 1,990 levels (0.8%) were BLOQ and a sensitivity analysis with and without BLOQ values was performed confirming insignificant change in the PK analysis results. Information was collected separately for each course of HD MTX received by each subject to permit assessment of intrapatient and interpatient variability in clearance. Study data were managed using the Research Electronic Data Capture (REDCap) application. 27
Population PK analysis
We performed population PK analysis with a nonlinear mixed‐effects model implemented in NONMEM version VII 28 using a typical pediatric population PK modeling approach, similar to two recent HD MTX studies. 29 , 30 We chose the base model by comparing several compartment PK models with either a proportional residual error model or a combined additive and proportional residual error model, assuming lognormal distribution for random effects PK parameters. For estimations, we used the stochastic approximation expectation maximization, which was followed by importance sampling to obtain the object function and standard errors, because stochastic approximation expectation maximization could better handle more complex PK/pharmacodynamic problems with many parameters than the first order conditional estimation with interaction. 31 Regarding a residual error model, although the combined additive and proportional error would be more flexible compared with a proportional error model, our data better supported the proportional error model, and hence a two‐compartment model with a proportional residual error model was chosen as the base model. We note that a proportional error model would be more prone to violating the modeling assumption as it may be able to fully account residual errors that substantially deviated from those proportional to the model function. The main PK parameters were total clearance (CL; L/hr); volume of distribution for the central compartment (V1; L); intercompartmental clearance (Q; L/hr); and volume of distribution for the peripheral compartment (V2; L). The final base model included the between‐individual variance components for the main PK parameters (CL, V1, Q, V2) and the between‐occasion variance components on CL to account for the between‐occasion variability because up to four courses of data for each patient were included in the PK modeling.
With the final base model, covariate model building was performed with the following candidate covariates, which were selected a priori based on previous research and biological plausibility: weight, age, sex, race, baseline serum creatinine, baseline total bilirubin level, and two genotypes (SLCO1B1 521T>C and 388A>G, planned to be assessed for individual effects and an interaction effect based on prior literature 7 ). Self‐reported race was considered in three categories (white, Hispanic/Latino, and other) due to a small number of patients in the “other” category. The homozygous wild‐type genotype (TT) for the 521T>C variant was compared with any variant (CC or CT) due to the low number of patients with the homozygous variant genotype (n = 3). For the 388A>G variant, the three genotypes (homozygous wild‐type AA and variant genotypes AG and GG) were compared separately. Model selection was performed based on the objective function values (OFV; −2 log likelihood) along with the number of parameters, which would approximately follow χ2 distribution. Based on the χ2 statistic with 1 degree of freedom, a decrease of > 3.84 in OFV with one additional parameter corresponds to a P value < 0.05.
For model checking, several goodness‐of‐fit plots were generated. Population and individual predicted MTX concentrations were compared with observed MTX concentrations, and conditional weighted residuals were examined against population predicted MTX concentrations. Predictive model checking was also performed based on predicted MTX concentrations from the final model using simulations. See Supplementary Information for details regarding model checking. We used the programming language R version 3.5.2 32 for the covariate model building and model checking.
RESULTS
Population PK modeling was completed utilizing data from 106 patients (89 in the human subject cohort and 17 in the BioVU cohort) with ALL or lymphoblastic lymphoma (Table 1 ). Although these patients received a total of 422 courses of HD MTX (range 1–10 courses per patient, mean 4, with 87 patients receiving exactly 4 courses), only the first 4 courses with complete information were utilized for each patient due to the small number of patients (n = 7) who received > 4 courses and difficulty incorporating variability in later courses into modeling. Additionally, after review of the data, one course was excluded for each of the five patients due to errors with the infusion (incorrectly programmed pump, infusion stopped due to central line malfunction, or infusion started before urine was alkalinized) as these iatrogenic issues would significantly affect clearance independent of genotype. Ultimately, 396 courses of HD MTX were analyzed. Two patients had Down syndrome (known association with reduced MTX clearance), and both received lower doses (1–2 g/m2) of HD MTX per COG protocol. No patients withdrew from the study or were lost to follow‐up during the study period. Allele frequencies for the variants of interest are shown in Table 2 .
Table 2.
Evaluated genetic variants
| Gene | Variant details | dbSNP IDa | Minor allele frequenciesb | ||||
|---|---|---|---|---|---|---|---|
| Study cohort | Globalb | Whiteb | Hispanicb | Africanb | |||
| SLCO1B1 | c.521T>C (V174A) | rs4149056 | 0.16 | 0.13 | 0.16 | 0.11 | 0.03 |
| c.388A>G (N130D) | rs2306283 | 0.45 | 0.48 | 0.40 | 0.43 | 0.77 | |
The dbSNP ID refers to the reference SNP ID number that identifies the variant in the Single Nucleotide Polymorphism database (dbSNP) from the National Center for Biotechnology Information (NCBI).
For both polymorphisms, the variant allele is considered to be the minor allele. Minor allele frequencies by race are reported from the Genome Aggregation Database (gnomAD) version 2.1.1 (https://gnomad.broadinstitute.org). The gnomAD race categories of “Non‐Finnish European,” “Latino,” and “African” were used for the values for white, Hispanic, and African populations, respectively.
Population PK parameters and effect of age and weight on MTX clearance
Results of population PK analysis from the base and covariate models are presented in Table 3 . First, we obtained parameter estimates and 95% confidence intervals from the base model without covariates for the main population PK parameters (CL, V1, Q, and V2). The PK parameters varied substantially among patients; the coefficients of variation for CL, V1, Q, and V2 were 50%, 55%, 85%, and 95%, respectively. The interoccasion variability (coefficients of variation) in CL was small relative to the between‐individual variability: 21%, 11%, 12%, and 10% for courses 1 to 4, respectively.
Table 3.
Pharmacokinetic model parameter estimates for SLCO1B1 521T>C alone and interaction with 388A>G a
| Base model | Covariate model | ||||||
|---|---|---|---|---|---|---|---|
| Model 0: weight only | Model 1: weight and SLCO1B1 521T>C | Model 2: weight and genotypes interaction | |||||
| Parameters | Estimates (SE) [95% CI] | Parameters | Estimates (SE) [95% CI] | Parameters | Estimates (SE) [95% CI] | Parameters | Estimates (SE) [95% CI] |
| OFV = −5734 | OFV = −5,813 | OFV = −5,819 | OFV = −5,827 | ||||
| CL | CL = θ1 (wgt/70)θ2 | CL = θ1 (wgt/70)θ2 × θ9 SNP1 | CL = θ1 (wgt/70)θ2 × θ9 SNP1 × θ10 SNP2:AG × θ11 SNP2:GG × θ12 SNP1x SNP2:AG × θ13 SNP1x SNP2:GG | ||||
| 7.14 (0.44) [6.28, 8.00] | θ1 | 10.29 (0.63) [9.06, 11.52] | θ1 | 10.73 (0.75) [9.26, 12.20] | θ1 | 10.79 (0.67) [9.48, 12.1] | |
| θ2 | 0.56 (0.08) [0.40, 0.72] | θ2 | 0.60 (0.06) [0.48, 0.72] | θ2 | 0.58 (0.07) [0.44, 0.72] | ||
| θ9 | 0.96 (0.03) [0.90, 1.02] | θ9 | 0.84 (0.04) [0.76, 0.92] | ||||
| θ10 | 1.00 (0.14) [0.73, 1.27] | ||||||
| θ11 | 0.92 (0.03) [0.86, 0.98] | ||||||
| θ12 | 1.15 (0.14) [0.88, 1.42] | ||||||
| θ13 | 1.23 (0.08) [1.07, 1.39] | ||||||
| V1 | V1 = θ3 (wgt/70)θ4 | V1 = θ3 (wgt/70)θ4 | V1 = θ3 (wgt/70)θ4 | ||||
| 24.64 (1.06) [22.56, 26.72] | θ3 | 37.35 (2.38) [32.69, 42.01] | θ3 | 38.87 (2.60) [33.77, 43.97] | θ3 | 38.8 (2.52) [33.86, 43.74] | |
| θ4 | 0.64 (0.09) [0.46, 0.82] | θ4 | 0.69 (0.07) [0.55, 0.83] | θ4 | 0.67 (0.08) [0.51, 0.83] | ||
| Q | Q = θ5 (wgt/70)θ6 | Q = θ5 (wgt/70)θ6 | Q = θ5 (wgt/70)θ6 | ||||
| 0.07 (0.01) [0.05, 0.09] | θ5 | 0.13 (0.02) [0.09, 0.17] | θ5 | 0.13 (0.02) [0.09, 0.17] | θ5 | 0.13 (0.02) [0.09, 0.17] | |
| θ6 | 0.73 (0.12) [0.49, 0.97] | θ6 | 0.77 (0.13) [0.52, 1.02] | θ6 | 0.75 (0.13) [0.50, 1.00] | ||
| V2 | V2 = θ7 (wgt/70)θ8 | V2 = θ7 (wgt/70)θ8 | V2 = θ7 (wgt/70)θ8 | ||||
| 2.50 (0.22) [2.07, 2.93] | θ7 | 4.20 (0.49) [3.24, 5.16] | θ7 | 4.79 (0.65) [3.52, 6.06] | θ7 | 4.54 (0.55) [3.46, 5.62] | |
| θ8 | 0.83 (0.13) [0.58, 1.08] | θ8 | 0.91 (0.13) [0.66, 1.16] | θ8 | 0.87 (0.13) [0.62, 1.12] | ||
| ω2 CL (%CV) | 50.4 (4.6) [41.3, 59.5] | ω2 CL (%CV) | 33.8 (3.9) [26.1, 41.5] | ω2 CL (%CV) | 33.0 (4.6) [24.0, 42.0] | ω2 CL (%CV) | 32.9 (4.9) [23.4, 42.4] |
| ω2 V1 (%CV | 54.6 (8.2) [38.4, 70.7] | ω2 V1 (%CV) | 37.1 (4.6) [28.2, 46.1] | ω2 V1 (%CV) | 36.0 (8.5) [19.4, 52.6] | ω2 V1 (%CV) | 35.9 (7.1) [22.1, 49.7] |
| ω2 Q (%CV) | 84.8 (12.6) [60.1, 109.4] | ω2 Q (%CV) | 73.0 (8.4) [56.5, 89.5] | ω2 Q (%CV) | 73.3 (10.2) [53.3, 93.3] | ω2 Q (%CV) | 72.8 (9.0) [55.2, 90.4] |
| ω2 V2 (%CV) | 94.6 (21.2) [53.0, 136.2] | ω2 V2 (%CV) | 82.4 (13.4) [56.2, 108.7] | ω2 V2 (%CV) | 80.9 (15.6) [50.3, 111.6] | ω2 V2 (%CV) | 81.9 (12.5) [57.3, 106.5] |
| ω2 BOV1 (%CV) | 20.5 (5.3) [10.2, 30.8] | ω2 BOV1 (%CV) | 20.2 (5.8) [8.9, 31.5] | ω2 BOV1 (%CV) | 20.3 (9.2) [2.2, 38.4] | ω2 BOV1 (%CV) | 20.3 (7.8) [5.0, 35.6] |
| ω2 BOV2 (%CV) | 11.0 (4.7) [1.8, 20.3] | ω2 BOV2 (%CV) | 11.1 (4.6) [2.0, 20.1] | ω2 BOV2 (%CV) | 10.8 (5.1) [0.7, 20.8] | ω2 BOV2 (%CV) | 11.0 (4.6) [2.0, 20.1] |
| ω2 BOV3 (%CV) | 11.5 (2.4) [6.8, 16.2] | ω2 BOV3 (%CV) | 12.8 (3.8) [5.5, 20.2] | ω2 BOV3 (%CV) | 13.0 (3.8) [5.4, 20.5] | ω2 BOV3 (%CV) | 13.2 (3.5) [6.3, 20.1] |
| ω2 BOV4 (%CV) | 9.7 (3.9) [2.1, 17.3] | ω2 BOV4 (%CV) | 10.4 (3.8) [2.9, 17.8] | ω2 BOV4 (%CV) | 10.4 (4.2) [2.2, 18.7] | ω2 BOV4 (%CV) | 10.4 (3.0) [4.6, 16.2] |
| σ2 prop (%CV) | 32.0 (0.7) [30.5, 33.4] | σ2 prop (%CV) | 31.7 (0.8) [30.1, 33.3] | σ2 prop (%CV) | 31.7 (0.7) [30.3, 33.1] | σ2 prop (%CV) | 31.6 (0.7) [30.3, 33.0] |
CI, confidence interval; CL, total clearance (L/hr); CV, coefficient of variation; OFV, objective function value; Q, intercompartmental clearance (L/hr); SNP1, SLCO1B1 521CT or 521CC (any variant); SNP2:AG, SLCO1B1 388AG; SNP2:GG, 388GG; V1, volume of distribution for the central compartment (L); V2, volume of distribution for the peripheral compartment (L); wgt, body weight in kg; ω2 CL, ω2 V1, ω2 Q, and ω2 V2, between‐individual variance for CL, V1, Q, and V2, respectively; ω2 BOV1, ω2 BOV2, ω2 BOV3, and ω2 BOV4, inter‐occasion variance for CL from course 1 to course 4, respectively; σ2 prop, proportional residual error variance.
The 95% CIs are presented in square brackets after the SE.
Among the evaluated covariates, patient weight explained the largest part of the between‐individual variability for all PK parameters; inclusion of weight in the base model yielded a large reduction of 79 in OFV from −5,734 to −5,813 (P < 0.001; Table 3 ). After inclusion of weight, other covariates (age, sex, race, and baseline creatinine and total bilirubin) explained very little of the between‐individual variability (OFV decrease < 3). Consistent with prior reports, we found that MTX clearance tended to increase with increasing weight (Figure 1a ) and increasing age (Figure 1b ). Once the individual predicted MTX clearance from the base model was weight normalized (dividing by weight), the previous relationships with weight or age disappeared and the relationships appeared similar (Figure 1c,d ), supporting age explains little variability beyond weight alone.
Figure 1.

Scatter plots for model‐predicted individual methotrexate (MTX) clearance (CL) by the base model. (a) Individual clearance vs. weight. (b) Individual CL vs. age. (c) Weight‐normalized individual CL vs. weight. (d) Weight‐normalized individual CL vs. age.
After including weight in the model, genotypic effects on CL were investigated separately for each genotype (SLCO1B1 521T>C and 388A>G) as well as jointly. A separate inclusion of each genotype improved the model fit with a decrease of OFV of 6.2 (P = 0.012) and 8.6 (P = 0.014; Table 3 and Table S1 ), respectively, whereas their joint inclusion did not result in improvement compared with the separate models. There was evidence of interaction between the two genotypes, although it was not strong (a decrease of 14 in OFV compared with the model with weight only, degree of freedom = 5, P = 0.017). We present three covariate models for comparison: model 0 using weight only, model 1 using weight and SLCO1B1 521T>C genotype only, and model 2 using weight and both genotypes (SLCO1B1 521T>C and 388A>G) as well as their interaction. The main parts of the covariate models are presented in Table 3 and as follows:
Model 0
CLi = θ1 × (wgti /70)θ2 × exp(ηi CL)
Model 1
CLi = θ1 × (wgti/70)θ2 × θ9 SNP1
Model 2
CLi = θ1 × (wgti/70)θ2 × θ9 SNP1 × θ10 SNP2:AG × θ11 SNP2:GG × θ12 SNP1x SNP2:AG × θ13 SNP1x SNP2:GG × exp(ηi CL)
Common to Models 0, 1, and 2
V1i = θ3 × (wgti/70)θ4 × exp(ηi V1)
Qi = θ5 × (wgti/70)θ6 × exp(ηi Q)
V2i = θ7 × (wgti/70)θ8 × exp(ηi V2),
where CLi, V1i, Qi, and V2i are individual‐specific PK parameters corresponding to CL, V1, Q, and V2, wgti is patient weight in kilograms (kg), and ηi CL, ηi V1, ηi Q, and ηi V2 are random variables explaining the between‐individual variability for CL, V1, Q, and V2, respectively, which were assumed to follow a normal distribution with mean zero and variance of ω2 CL, ω2 V1, ω2 Q, and ω2 V2. SNP1 represents the presence of any variant (genotypes CC or CT) for SLCO1B1 521T>C, and SNP2:AG and SNP2:GG represent genotypes AG and GG for the SLCO1B1 variant 388A>G, respectively; if the genotype of interest is present, the value of SNP1 or SNP2 is 1, otherwise the value is 0. The θs in the equations denote model parameters as typically used in statistical models. PK parameter estimates based on genotype at the two SLCO1B loci can be determined from the values in Table 3 . Compared with the base model, the between‐individual variability for CL, V1, Q, and V1 were significantly reduced to 33%, 36%, 73%, and 82%, respectively, by inclusion of weight and genotypes. The model assessment indicated adequate model fit (Figure 2 and Supplementary Information ).
Figure 2.

Population pharmacokinetic model diagnostic plots and predictive model checking for the final model, model 2. (a) Observed methotrexate (MTX) concentrations (in micromoles per liter (mcmol/L)) vs. population predicted concentrations. The gray diagonal line is a line of identity, whereas the black dashed line is a local polynomial regression fitting line for the data to show a trend. (b) Observed MTX concentrations vs. individual predicted concentrations. The gray diagonal line and the black dashed line are the same as in panel a. (c) Conditional weighted residuals (CWRES) vs. population predicted concentrations. The black dashed line is a local polynomial regression fitting line for the data to show a trend. (d) Predictive model check, where the lines represent the 5th (lower dashed line), 50th (middle solid line), and 95th (upper dashed line) percentiles of observed MTX concentrations; gray areas represent the 90th percentile region of predicted MTX concentrations from the final model using simulations. The main plot corresponds to the highlighted region of data in the inset.
Genotypic effects on MTX clearance
To examine how the genotypes of interest affect CL both alone and with interaction, we calculated CL for each variant genotype as a percentage of the wild‐type predicted CL with weight held constant; these values are provided in Table S1 . Patients homozygous wild‐type at SLCO1B1 521T>C (Table S1 A) and patients with wild‐type for both SLCO1B1 521T>C and 388A>G (Table S1 B) were considered as the reference groups for comparison, assigned 100% value for CL. If only 521T>C genotype was considered (model 1), CL for patients with any variant at this locus would be, on average, 4% lower compared with wild‐type patients (Table S1 A). When both genotypes of interest were considered jointly (model 2), predicted CL was dependent on both genotypes with an apparent interaction between these two variants. The largest decrease in clearance was seen for subjects with one or more variant 521T>C alleles and wild‐type (AA) for the 388A>G locus. A smaller reduction in CL was seen in patients with one or more variant alleles at SLCO1B1 521T>C and one or more variant alleles at 388A>G, suggesting that the 388G allele results in increased CL that offsets the decrease in CL seen for the 521T>C variant allele (Table S1 B). See Table S1 for other relationships between genotype and CL, and the Supplementary Information (Table S2 , Figure S2 ) for data from another model (model 3) using the SLCO1B1 388A>G variant alone.
Model‐predicted individual CL by genotype is shown in Figure 3 , where the weight‐normalized and nonweight‐normalized CL for each patient obtained from up to four courses were plotted. In our study, weight was by chance unevenly distributed across genotypes (Table S3 ). As we determined weight to be a major contributor to interindividual variability in MTX PK, Figure 3 illustrates the influence of weight when predicting patient CL grouped by genotype. For example, the mean (median) weight for TT/GG subjects is 35 kg (19 kg), significantly lower than TT/AA subjects at 42 kg (40 kg). Non‐normalized CL for TT/GG subjects is lower than TT/AA (Figure 3d ), but after weight normalization, the relationship is reversed—weight‐normalized clearance for TT/GG is greater than TT/AA.
Figure 3.
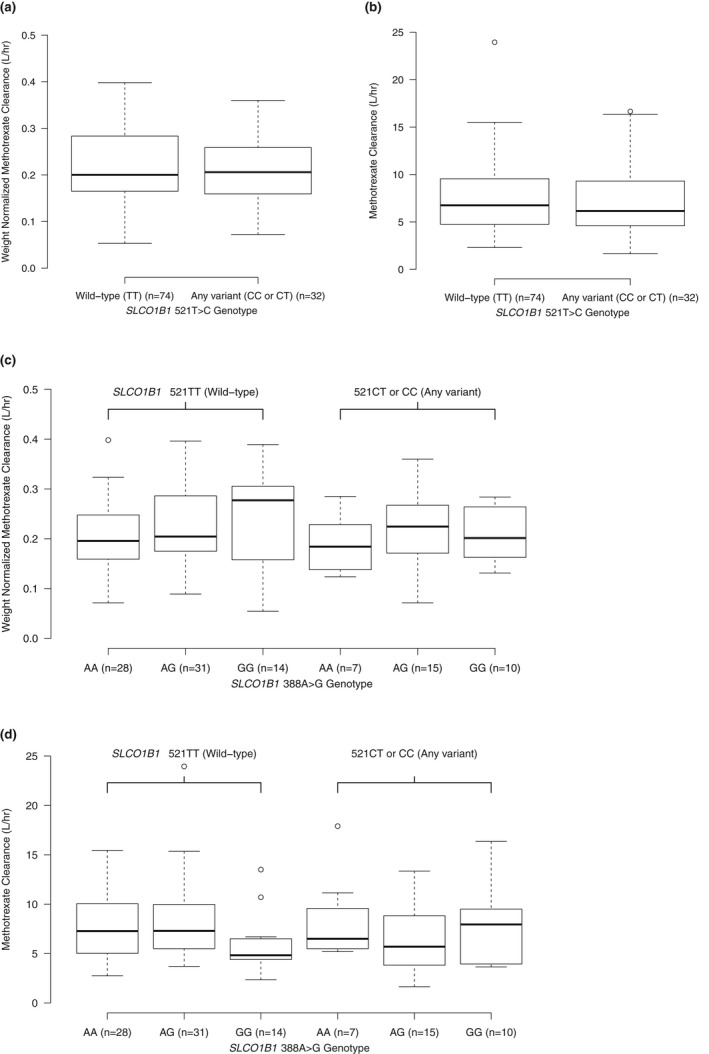
Box plots for model‐predicted individual methotrexate (MTX) clearance (CL). Model‐predicted individual MTX CL over maximum four courses in pediatric patients with acute lymphoblastic leukemia receiving high‐dose MTX (5 g/m2). Model 1: by genotype for SLCO1B1 521T>C allele, left: wild‐type (TT), right: any variant (CC or CT) – (a) shows weight‐normalized clearance (CL divided by weight in kg) and (b) shows CL without weight normalization. Model 2: by genotype for SLCO1B1 521T>C and 388A>G, left: wild‐type for 521T>C (TT) separated by 388A>G genotype (wild‐type = AA), right: any variant for 521T>C (CC or CT) separated by 388A>G (wild‐type = AA) – (c) shows weight‐normalized clearance (CL divided by weight in kg) and (d) shows CL without weight normalization. Top and bottom of boxes represent 75th and 25th percentile of the model‐predicted individual MTX CL, respectively, whereas the thick horizontal line represents the median. The dashed vertical lines are the whiskers extending to the most extreme data point, which is no more than 1.5 times the interquartile range from the box.
Finally, as HD MTX is primarily dosed by BSA in pediatric oncology patients, we also performed an analysis of clearance by genotyping utilizing BSA normalization wherein the individual model‐predicted CL values were divided by BSA (in m2; Supplementary Information Figure S1 , Table S4 ). Similar to weight, BSA normalization demonstrates consistent effects of SLCO1B1 genotype and gene interaction on HD MTX clearance.
DISCUSSION
Utilizing population PK modeling, we found that genetic variation in SLCO1B1 contributes to interpatient variability in HD MTX clearance in children and young adults with ALL and lymphoblastic lymphoma. This study adds to a growing body of work supporting the relationship between SLCO1B1 genetic variation and HD MTX pharmacokinetics. In our study, most patients (n = 96; 360 courses) received HD MTX at 5 g/m2, which is the dosing regimen utilized most frequently in contemporary COG protocols for the treatment of a large majority of pediatric oncology patients in the United States. We confirmed an association between the key SLCO1B1 variant 521T>C and reduced HD MTX clearance at a dose of 5 g/m2.
In recent studies, the SLCO1B1 388A>G variant allele was associated with increased MTX clearance, but this effect was only seen after stratifying for 521T>C genotype. The effect of the 388G allele in these studies was largest in patients with at least one copy of the 521T>C variant allele, and there was a slight trend toward progressively increased clearance with each copy of the 388G allele, although clearance values for the 388AG and 388GG genotypes within each 521T>C genotype were overall similar.7,11 Similarly, we found that for subjects with at least one variant 521T>C allele, those with the 388AG or 388GG genotype had increased clearance compared with 388AA, 15% and 13% increase from that of 388AA, respectively, with the heterozygous and homozygous variant subjects having similar clearance values (Figure 3c ). Prior data 7 , 11 and our data suggest an interaction between these two SLCO1B1 variants given that the effect of the 388A>G variant changes based on the patient’s 521T>C genotype.
We chose to provide weight‐normalized CL in Figure 3 due to the fact that, by chance, there were differences in the distribution of patient weights seen in each genotype group in our study (median weight for each group: 521TT‐388AA = 40 kg; 521TT‐388AG = 36 kg; 521TT‐388GG = 19 kg; 521CT/CC‐388AA = 44 kg; 521CT/CC‐388AG = 34 kg; 521CT/CC‐388GG = 30 kg; Table S3 ). Specifically, the patients with 388GG tended to, by chance, have a lower median weight than patients with 388AA or 388AG. Weight normalization allowed us to more accurately visualize the effect of the 388G allele given that changes in CL based on weight are known to occur (Figure 1 ). Overall, our data confirms a relationship between genotype at these two loci and MTX clearance. A prior study found that renal function (using estimated glomerular filtration rate) was an independent predictor of MTX clearance, 33 whereas in our study, which used serum creatinine as a covariate, we did not find that creatinine added meaningfully to the MTX clearance model. This could be due to the small amount of variability in our patients’ pre‐MTX creatinine, given that patients were required to have a creatinine close to their baseline and normal for age prior to proceeding with HD MTX, per institutional standards or the aforementioned study, including both pediatric and adult oncology patients with wide age ranges (0.6–79 years) with inherently more variation in serum creatinine.
The effect size for the 521T>C variant in our study was smaller than in prior studies, potentially related to most patients in this study receiving a different dosing regimen and a shift in the relative importance of this transporter to MTX disposition at higher doses. Our analysis was also different than recent studies in that we included weight in our PK modeling and thus presented clearance in L/hour, whereas the prior studies presented clearance in mL/min/m2; this could have an impact on effect size depending on the distribution of patient weight in other studies. The use of an allometric size factor relative to a standard weight of 70 kg to model PK parameters, as we have done, is considered to be a standard approach in pediatric PK modeling for several reasons that were articulated in recent reports. 34 , 35 We estimated these allometric scaling factors instead of fixing at 0.75 (CL and Q) and 1 (V1 and V2). First, our rich dataset allowed us to estimate the allometric scaling factors with good precision, which is the preferred approach due to possible drug‐specific relationships between PK parameters and body weight. Second, the difference in the objective function values was 33 (−5780 vs. −5813), which strongly supported the model with free allometric scaling factors. Last, the estimated allometric scaling factors for CL and V1 were markedly different from the theoretical values; the typical values were much deviated, and the 95% confidence intervals excluded the theoretical values. We found a similar interaction between the SLCO1B1 521T>C and 388A>G variants compared with a recent prior study, 7 with increase in clearance associated with the 388G allele only appreciated when stratifying for 521T>C genotype (Table S1 B and Figure 3 ).
There are limitations to our study. Although HD MTX is typically dosed according to BSA, we chose to analyze using weight‐based population PK analysis. We also analyzed using BSA as a size covariate and found both approaches were comparable in evaluating the effects of SLCO1B1 variants on MTX clearance. We reported the results with body weight with allometric scaling factor, a well‐established pediatric PK modeling approach, which may facilitate comparison among different studies. However, the clinical utility of a weight‐adjusted PK model should ideally be studied in a separate comparable population, which is beyond the scope of our current study. Another limitation of this work is the relatively small sample size. There are other potentially important variants in SLCO1B1, as well as in other genes in the MTX disposition pathway. 12 , 36 We did not examine additional variants in this analysis given the limitations of our sample size. Additionally, differences in i.v. fluid usage or components, such as those reported in a recent paper due to a national shortage of i.v. bicarbonate, could affect clearance independent of genotype 37 ; although we did not identify any patients in our study who received non‐bicarbonate fluids.
Although the effect size was modest, it was consistent with prior reports linking SLCO1B1 variants to MTX PK variation. Whereas these two SLCO1B1 variants alone may not justify changes in HD MTX dosing, it is conceivable these variants may interact with other MTX pathway variants to significantly modulate MTX PKs. As altered MTX clearance has been linked to drug‐induced toxicity and efficacy, it is important to maintain MTX PK within an optimal range for all patients, which has been approximated previously. 38 , 39 Ultimately, a precision medicine dosing strategy for HD MTX incorporating clinical and genetic variables to optimize MTX PK has the potential to reduce toxicity and increase efficacy associated with HD MTX regimens and improve long‐term outcomes for children and young adults with ALL and lymphoblastic lymphoma.
Funding
This work was supported by the National Institutes of Health (NIH) National Institute of General Medical Sciences (T32 award GM007569 to R.R.S., R01 award GM099924 to R.H.H., R01 award GM124109 to L.C., R01 award GM109145 and R35 award GM131770 to C.M.S.), NIH National Cancer Institute (K12 award CA090625 to R.R.S.), First Nonprofit Foundation/Lily’s Garden Research Fund (Vanderbilt University Medical Center institutional funding to R.R.S. and R.H.H.), Alex’s Lemonade Stand Foundation (Young Investigator Award 17‐00375 to R.R.S.), Rally Foundation (Fellowship Award to R.R.S.), Hyundai Hope on Wheels (Scholar Award to R.H.H.), Burroughs Wellcome Fund (IRSA 1015006 to S.L.V.), and the National Center for Advancing Translational Sciences (CTSA award UL1 TR002243, principal investigator Gordon Bernard – pilot funding to R.R.S. through the Vanderbilt Institute for Clinical and Translational Research and use of the REDCap application). The contents of this manuscript are solely the responsibility of the authors and do not necessarily represent official views of the National Institutes of Health.
Conflict of Interest
S.L.V. has received an honorarium as an invited speaker to Merck and has funding for pediatric pharmacogenomic validation from a Burroughs Wellcome Innovation in Regulatory Science Award. All other authors declared no competing interests for this work.
Author Contributions
R.R.S., L.C., and R.H.H. wrote the manuscript. R.R.S., L.C., and R.H.H. designed the research. R.R.S., L.C., and N.U. performed the research. R.R.S., L.C., S.L.V., C.M.S., and R.H.H. analyzed the data. S.L.V. and L.C. contributed or assisted with analytical tools.
Study Highlights.
WHAT IS THE CURRENT KNOWLEDGE ON THE TOPIC?
There is significant variability in clearance of high‐dose methotrexate (MTX) in children and young adults, which has important clinical implications. Variation in SLCO1B1 is related to interpatient variability in high‐dose (HD) MTX clearance.
WHAT QUESTION DID THIS STUDY ADDRESS?
Prior studies have primarily evaluated clearance in patients who received lower doses of HD MTX than those utilized on most contemporary Children’s Oncology Group protocols. We evaluated the effect of two key SLCO1B1 variants on HD MTX clearance in children and young adults with hematologic malignancies.
WHAT DOES THIS STUDY ADD TO OUR KNOWLEDGE?
We found an association between HD MTX clearance and two SLCO1B1 variants (521T>C and 388A>G). The presence of the 521T>C variant is associated with reduced clearance, whereas the effect of the 388A>G variant depends on 521T>C genotype, suggesting an interaction between these two genotypes.
HOW MIGHT THIS CHANGE CLINICAL PHARMACOLOGY OR TRANSLATIONAL SCIENCE?
Incorporation of SLCO1B1 genotype into HD MTX dosing algorithms in children and young adults with hematologic malignancies could help to maintain HD MTX clearance in an optimal therapeutic range, which is expected to minimize toxicity and maximize efficacy.
Supporting information
Fig S1
Fig S2
Table S1
Table S2
Table S3
Table S4
Supplementary Material
Acknowledgments
The authors would like to thank Dr. Thomas Galletta for assistance with data extraction.
References
- 1. Larsen, E.C. et al Dexamethasone and high‐dose methotrexate improve outcome for children and young adults with high‐risk B‐acute lymphoblastic leukemia: a report from Children’s Oncology Group study AALL0232. J. Clin. Oncol. 34, 2380–2388 (2016). [DOI] [PMC free article] [PubMed] [Google Scholar]
- 2. Burkhardt, B. & Hermiston, M.L. Lymphoblastic lymphoma in children and adolescents: review of current challenges and future opportunities. Br. J. Haematol 185, 1158–1170 (2019). [DOI] [PubMed] [Google Scholar]
- 3. Termuhlen, A.M. et al Disseminated lymphoblastic lymphoma in children and adolescents: results of the COG A5971 trial: A report from the Children's Oncology Group. Br. J. Haematol. 162, 792–801 (2013). [DOI] [PubMed] [Google Scholar]
- 4. Howard, S.C. , McCormick, J. , Pui, C.H. , Buddington, R.K. & Harvey, R.D. Preventing and managing toxicities of high‐dose methotrexate. Oncologist 21, 1471–1482 (2016). [DOI] [PMC free article] [PubMed] [Google Scholar]
- 5. Seidel, H. et al Variability in methotrexate serum and cerebrospinal fluid pharmacokinetics in children with acute lymphocytic leukemia: relation to assay methodology and physiological variables. Leuk. Res. 24, 193–199 (2000). [DOI] [PubMed] [Google Scholar]
- 6. Trevino, L.R. et al Germline genetic variation in an organic anion transporter polypeptide associated with methotrexate pharmacokinetics and clinical effects. J. Clin. Oncol. 27, 5972–5978 (2009). [DOI] [PMC free article] [PubMed] [Google Scholar]
- 7. Ramsey, L.B. et al Genome‐wide study of methotrexate clearance replicates SLCO1B1. Blood 121, 898–904 (2013). [DOI] [PMC free article] [PubMed] [Google Scholar]
- 8. Lopez‐Lopez, E. et al Polymorphisms of the SLCO1B1 gene predict methotrexate‐related toxicity in childhood acute lymphoblastic leukemia. Pediatr. Blood Cancer 57, 612–619 (2011). [DOI] [PubMed] [Google Scholar]
- 9. Rask, C. , Albertioni, F. , Bentzen, S.M. , Schroeder, H. & Peterson, C. Clinical and pharmacokinetic risk factors for high‐dose methotrexate‐induced toxicity in children with acute lymphoblastic leukemia: a logistic regression analysis. Acta Oncologica 37, 277–284 (2009). [DOI] [PubMed] [Google Scholar]
- 10. Evans, W.E. et al Clinical pharmacodynamics of high‐dose methotrexate in acute lymphocytic leukemia. Identification of a relation between concentration and effect. N. Engl. J. Med. 314, 471–477 (1986). [DOI] [PubMed] [Google Scholar]
- 11. Ramsey, L.B. et al Rare versus common variants in pharmacogenetics: SLCO1B1 variation and methotrexate disposition. Genome Res. 22, 1–8 (2012). [DOI] [PMC free article] [PubMed] [Google Scholar]
- 12. Mikkelsen, T.S. et al PharmGKB summary: methotrexate pathway. Pharmacogenet. Genomics 21, 679–686 (2011). [DOI] [PMC free article] [PubMed] [Google Scholar]
- 13. Schmiegelow, K. Advances in individual prediction of methotrexate toxicity: a review. Br. J. Haematol. 146, 489–503 (2009). [DOI] [PubMed] [Google Scholar]
- 14. Walling, J. From methotrexate to pemetrexed and beyond. A review of the pharmacodynamic and clinical properties of antifolates. Invest. New Drugs 24, 37–77 (2006). [DOI] [PubMed] [Google Scholar]
- 15. Konig, J. Uptake transporters of the human OATP family: molecular characteristics, substrates, their role in drug‐drug interactions, and functional consequences of polymorphisms. Handb. Exp. Pharmacol. 201, 1–28 (2011). [DOI] [PubMed] [Google Scholar]
- 16. van de Steeg, E. , van Esch, A. , Wagenaar, E. , Kenworthy, K.E. & Schinkel, A.H. Influence of human OATP1B1, OATP1B3, and OATP1A2 on the pharmacokinetics of methotrexate and paclitaxel in humanized transgenic mice. Clin. Cancer Res. 19, 821–832 (2013). [DOI] [PubMed] [Google Scholar]
- 17. Ho, R.H. & Kim, R.B. Transporters and drug therapy: implications for drug disposition and disease. Clin. Pharmacol. Ther. 78, 260–277 (2005). [DOI] [PubMed] [Google Scholar]
- 18. Niemi, M. , Pasanen, M.K. & Neuvonen, P.J. Organic anion transporting polypeptide 1B1: a genetically polymorphic transporter of major importance for hepatic drug uptake. Pharmacol. Rev. 63, 157–181 (2011). [DOI] [PubMed] [Google Scholar]
- 19. Pasanen, M.K. , Neuvonen, P.J. & Niemi, M. Global analysis of genetic variation in SLCO1B1 . Pharmacogenomics 9, 19–33 (2008). [DOI] [PubMed] [Google Scholar]
- 20. Link, E. et al SLCO1B1 variants and statin‐induced myopathy ‐ a genomewide study. N. Engl. J. Med. 359, 789–799 (2008). [DOI] [PubMed] [Google Scholar]
- 21. Radtke, S. et al Germline genetic variations in methotrexate candidate genes are associated with pharmacokinetics, toxicity, and outcome in childhood acute lymphoblastic leukemia. Blood 121, 5145–5153 (2013). [DOI] [PubMed] [Google Scholar]
- 22. Lopez‐Lopez, E. et al Polymorphisms in the methotrexate transport pathway: a new tool for MTX plasma level prediction in pediatric acute lymphoblastic leukemia. Pharmacogenet. Genomics 23, 53–61 (2013). [DOI] [PubMed] [Google Scholar]
- 23. Borsi, J.D. & Moe, P.J. A comparative study on the pharmacokinetics of methotrexate in a dose range of 0.5 to 33.6 g/m2 in children with acute lymphoblastic leukemia. Cancer 60, 5–13 (1987). [DOI] [PubMed] [Google Scholar]
- 24. Borsi, J.D. , Sagen, E. , Romslo, I. & Moe, P.J. Comparative study on the pharmacokinetics of 7‐hydroxy‐methotrexate after administration of methotrexate in the dose range of 0.5‐33.6 g/m2 to children with acute lymphoblastic leukemia. Med. Pediat. Oncol. 18, 217–224 (1990). [DOI] [PubMed] [Google Scholar]
- 25. Wang, Z. , Zhou, Q. , Kruh, G.D. & Gallo, J.M. Dose‐dependent disposition of methotrexate in Abcc2 and Abcc3 gene knockout murine models. Drug Metab. Dispos. 39, 2155–2161 (2011). [DOI] [PMC free article] [PubMed] [Google Scholar]
- 26. Roden, D.M. et al Development of a large‐scale de‐identified DNA biobank to enable personalized medicine. Clin. Pharmacol. Ther. 84, 362–369 (2008). [DOI] [PMC free article] [PubMed] [Google Scholar]
- 27. Harris, P.A. et al Research electronic data capture (REDCap) ‐ a metadata‐driven methodology and workflow process for providing translational research informatics support. J. Biomed. Inform. 42, 377–381 (2009). [DOI] [PMC free article] [PubMed] [Google Scholar]
- 28. Beal, S. , Sheiner, L. , Boeckmnaa, A. & Bauer, R. NONMEM User's Guides. (Icon Development Solutions, Ellicott City, MD, 2009). [Google Scholar]
- 29. Beechinor, R.J. et al The population pharmacokinetics of high‐dose methotrexate in infants with acute lymphoblastic leukemia highlight the need for bedside individualized dose adjustment: a report from the Children's Oncology Group. Clin. Pharmacokinet. 58, 899–910 (2019). [DOI] [PMC free article] [PubMed] [Google Scholar]
- 30. Lui, G. et al A pharmacokinetic and pharmacogenetic analysis of osteosarcoma patients treated with high‐dose methotrexate: data from the OS2006/Sarcoma‐09 Trial. J. Clin. Pharmacol. 58, 1541–1549 (2018). [DOI] [PubMed] [Google Scholar]
- 31. Bauer, R.J. NONMEM tutorial part II: estimation methods and advanced examples. CPT Pharmacometrics Syst. Pharmacol. 8, 538–556 (2019). [DOI] [PMC free article] [PubMed] [Google Scholar]
- 32. Team, R.C . R: A Language and Environment for Statistical Computing. (R Foundation for Statistical Computing, Vienna, Austria, 2018). [Google Scholar]
- 33. Kawakatsu, S. et al Population pharmacokinetic analysis of high‐dose methotrexate in pediatric and adult oncology patients. Cancer Chemother. Pharmacol. 84, 1339–1348 (2019). [DOI] [PubMed] [Google Scholar]
- 34. Holford, N. , Heo, Y.A. & Anderson, B. A pharmacokinetic standard for babies and adults. J. Pharm. Sci. 102, 2941–2952 (2013). [DOI] [PubMed] [Google Scholar]
- 35. Holford, N.H. & Anderson, B.J. Why standards are useful for predicting doses. Br. J. Clin. Pharmacol. 83, 685–687 (2017). [DOI] [PMC free article] [PubMed] [Google Scholar]
- 36. Lee, S.H.R. & Yang, J.J. Pharmacogenomics in acute lymphoblastic leukemia. Best Pract. Res. Clin. Haematol. 30, 229–236 (2017). [DOI] [PubMed] [Google Scholar]
- 37. Mangum, R. et al Do intravenous fluid substitutions influence methotrexate clearance? An unanticipated impact of an intravenous sodium bicarbonate drug shortage. Pediatr. Blood Cancer 67, e28334 (2020). [DOI] [PubMed] [Google Scholar]
- 38. Evans, W.E. et al Conventional compared with individualized chemotherapy for childhood acute lymphoblastic leukemia. N. Engl. J. Med. 338, 499–505 (1998). [DOI] [PubMed] [Google Scholar]
- 39. Rodman, J.H. et al Clinical pharmacokinetics and pharmacodynamics of anticancer drugs in children. Semin. Oncol. 20, 18–29 (1993). [PubMed] [Google Scholar]
Associated Data
This section collects any data citations, data availability statements, or supplementary materials included in this article.
Supplementary Materials
Fig S1
Fig S2
Table S1
Table S2
Table S3
Table S4
Supplementary Material