

Abstract
Recent functional magnetic resonance imaging (fMRI) studies have reported that moment-to-moment variability in the blood oxygen-level dependent (BOLD) signal is positively associated with task performance, and thus, may reflect a behaviorally-sensitive signal. However, it is not clear whether resting-state and task-driven BOLD variability are differentially related to cognition, as they may be driven by distinct sources of variance in the BOLD signal. Moreover, other studies have suggested that age differences in resting-state BOLD variability may be particularly sensitive to individual differences in cardiovascular, rather than neural factors. In the present study, we tested relationships between measures of behavioral task performance and BOLD variability during both resting-state and task-driven runs of a Stroop and an animacy judgment task in a large, well-characterized sample of cognitively normal middle-aged to older adults. Resting-state BOLD variability was related to composite measures of global cognition and attentional control, but these relationships were eliminated after correction for age or cardiovascular estimates. In contrast, task-driven BOLD variability was related to attentional control measured both inside and outside the scanner, and importantly, these relationships persisted after correction for age and cardiovascular measures. Overall, these results suggest that BOLD variability is a behaviorally-sensitive signal. However, resting-state and task-driven estimates of BOLD variability may differ in the degree to which they are sensitive to age-related, cardiovascular, and neural mechanisms.
Keywords: BOLD variability, fMRI, attentional control, episodic memory, aging
Functional magnetic resonance imaging (fMRI) has provided a powerful tool for cognitive neuroscientists as a non-invasive index of in vivo human brain function. Traditionally, fMRI approaches have focused on mean-level changes in patterns of the blood oxygen-level dependent (BOLD) signal during task performance as a measure of task-related activity. Moreover, there has also been considerable interest in spatial correlation patterns of spontaneous BOLD fluctuation reflecting functional connectivity among brain regions (for review, see Fox & Raichle, 2007). In addition to these approaches, there is growing interest in absolute estimates of moment-to-moment variability in the BOLD signal across a run as a potential signal of interest (for review, see Garrett, Samanez-Larkin, et al., 2013; Grady & Garrett, 2014).
Interest in BOLD variability first emerged in the study of human age differences. Initial studies reported that, in comparison to younger adults, healthy older adults exhibit reduced BOLD variability during brief fixation blocks (Garrett, Kovacevic, McIntosh, & Grady, 2010), task performance (Garrett, Kovacevic, McIntosh, & Grady, 2011), and extended resting-state scans (Kielar et al., 2016). This pattern is somewhat surprising, since one early neurocognitive theory of aging predicted that neural variability or noise should increase in older adults (Crossman & Szafran, 1956) and moreover that behavioral variability appears to increase with age (for review, see Balota & Duchek, 2015) and is associated with differences in resting-state networks (Clare Kelly, Uddin, Biswal, Castellanos, & Milham, 2008; Duchek et al., 2013; Meeker et al., 2020). Although widespread patterns of age-related reductions in BOLD variability have been observed spanning multiple functional networks, some regional age-related increases in variability have been reported in the same studies. Importantly, these extreme-group (i.e., college-aged students vs. community dwelling individuals over 60 years of age) difference patterns have been replicated in large, continuous aging samples as well (Hu, Chao, Zhang, Ide, & Li, 2014; Millar et al., in press; Nomi, Bolt, Ezie, Uddin, & Heller, 2017).
In addition to age differences, other studies have examined relationships with task performance, suggesting that task-driven BOLD variability is indeed sensitive to individual differences in performance within the scanner. Specifically, in one study, BOLD variability in occipital, cingulate, angular gyrus, and medial prefrontal regions during perceptual matching, attention cuing, and delayed match-to-sample tasks was positively associated with faster and more consistent reaction time (RT) in those tasks (Garrett et al., 2011). Similar positive relationships between task performance and variability have also been reported in stop signal (Hu et al., 2014), visual working memory (Guitart-Masip et al., 2016), as well as sensorimotor control, vowel identification, and trait judgment tasks (Grady & Garrett, 2018).
Behavioral relationships have also been demonstrated with resting-state variability. Specifically, greater resting-state low-frequency fluctuations in precuneus and anterior cingulate have been associated with faster and more consistent performance, as well as smaller congruency estimates from a flanker task performed in a separate task run (Mennes et al., 2011). Further, in a larger sample of older adults, resting-state variability in widespread grey matter areas (including primary motor, frontal, cingulate, precuneus, occipital, and temporal regions) was positively associated with factor estimates of episodic memory and fluid intelligence, but negatively associated with a vocabulary factor (Burzynska et al., 2015). These resting-state findings suggest that behavioral relationships with BOLD variability might reflect relatively stable individual differences beyond associations with in-scanner task performance.
Although these studies suggest a clear behavioral sensitivity of BOLD variability in resting-state and task-driven fMRI, the precise mechanisms underlying these behavioral relationships remain uncertain. One proposal is that increased BOLD variability might emerge in a neural system that is optimized for environmental uncertainty (Garrett, Samanez-Larkin, et al., 2013). Specifically, the presence of variability in neural responses might allow neural populations to approach Bayesian optimality by representing probabilistic distributions of possible responses (Ma, Beck, Latham, & Pouget, 2006). Such a system might avoid overly deterministic responses, thus affording flexible processing of unpredictable stimuli. Alternatively, BOLD variability might reflect ongoing exploration of potential network configurations or activation states (Deco, Jirsa, & McIntosh, 2011). This mechanism would similarly predict enhanced processing of unexpected inputs, as well as more flexible responses. Support for these interpretations comes from observations that BOLD variability parametrically increases as a function of task demands. Specifically, some studies have shown that variability is (i) greater in task-driven, compared to resting-state estimates (Garrett, Kovacevic, McIntosh, & Grady, 2013), (ii) greater during tasks requiring responses to changing external stimuli (e.g., vowel judgment, visuomotor responses) vs. tasks based on fixed internal representations (e.g., trait judgments) (Grady & Garrett, 2018), and (iii) modulated by difficulty in a perceptual face-matching task (Garrett, McIntosh, & Grady, 2014). However, there are also conflicting earlier reports that variability and spontaneous activity might be reduced during task performance as compared to resting-state (Bianciardi et al., 2009; Fransson, 2006; He, 2011, 2013), and so the consistency of these effects remains unclear. Moreover, within-participant modulations in BOLD variability across task states have been shown to be less pronounced in older adults and in low task performers (Garrett, Kovacevic, et al., 2013; Garrett et al., 2014; Grady & Garrett, 2018). Hence, the capacity of the system to modulate BOLD variability in accordance with task demands may reflect the integrity of the neural signal related to task performance.
Alternatively, BOLD variability may also relate to functional connectivity or network organization. Specifically, simulation studies suggest that low-frequency BOLD fluctuations might be the outcome of spontaneous activity within a differentially connected network of nodes (Honey, Kötter, Breakspear, & Sporns, 2007). Under this framework, disruptions in the network structure might produce reductions in both the amplitude of these fluctuations (reduced BOLD variability) and the magnitude of the correlations among the fluctuations (reduced functional connectivity). Hence, structural changes in the brain might simultaneously produce differences in both variability and functional connectivity, suggesting that these two measures might be tightly linked, rather than capturing distinct signals. Indeed, at least one study has provided initial evidence for potential links between BOLD variability and functional connectivity, demonstrating that greater BOLD variability within functional networks is associated with stronger functional integration (as defined as lower dimensionality) within those networks (Garrett, Epp, Perry, & Lindenberger, 2018). Under this view, BOLD variability could be related to cognition to the extent that it captures spontaneous activity constrained by a well-connected network structure, rather than capturing ongoing processing within the network. This interpretation might predict that BOLD variability should be related to estimates of structural integrity and connectivity, and moreover, that estimates of variability and their behavioral relationships should be highly consistent within individuals, regardless of changes in states or task contexts, similar to demonstrations of within-individual stability in functional connectivity estimates (Gratton et al., 2018). Indeed, one study has reported strong correlations between resting-state and task-driven estimates of BOLD variability (Grady & Garrett, 2018), however these relationships were demonstrated in relatively small samples of 15 older and 20 younger adults. Further, estimates of BOLD variability show fair test-retest reliability over 3-year intervals, at levels comparable to or greater than estimates of functional connectivity (Millar et al., 2020)
Finally, it has also been suggested that resting-state BOLD variability might primarily reflect cardiovascular and/or neurovascular factors, especially in the context of age differences. This suggestion is supported by recent evidence that age-related differences in resting-state BOLD variability are eliminated after correcting for measures of cardiovascular health (i.e., pulse, heart rate variability, blood pressure, white matter hyperintensities [WMH], and body mass index [BMI]) and cerebral blood flow (Tsvetanov et al., 2019). However, it is worth noting that there is also evidence that the age relationships with BOLD variability remain after correcting for cardiovascular (Tsvetanov et al., 2015) or neurovascular (Garrett, Lindenberger, Hoge, & Gauthier, 2017) factors alone. In light of these age-related results, it is possible that cardiovascular factors might also contribute to behavioral relationships with BOLD variability, which would question the above theoretical interpretations of BOLD variability and task performance. Moreover, there is growing interest in potential vascular influences on age-related cognitive decline (for review, see Abdelkarim et al., 2019; O’Brien et al., 2003; Wåhlin & Nyberg, 2019). Indeed, one recent report demonstrated that relationships between resting-state BOLD variability and a global cognitive composite were eliminated after correcting for similar cardiovascular health measures (Millar et al., in press). However, these relationships have not been examined within specific cognitive domains, so it is unclear whether potential cardiovascular factors may be sensitive to domain-general or domain-specific processing. Further, although multiple studies have considered the influence of cardiovascular factors in estimates of resting-state BOLD variability (Garrett et al., 2017; Millar et al., 2020; Tsvetanov et al., 2015, 2019), we are aware of only one study that has examined these factors in a task-driven context (Garrett et al., 2015).
Some insight into factors underlying behavioral relationships with BOLD variability might be gained by comparing behavioral relationships with variability across resting-state vs. task-driven sessions. Although, as discussed above, behavioral relationships have been demonstrated with both resting-state and task-driven variability, no studies have directly compared these relationships. It is possible that these two measures might capture distinct sources of BOLD signal variance, and hence, might offer differential sensitivity to behavioral measures taken inside or outside the scanner. For instance, task-driven BOLD variability might capture unique behaviorally-relevant neural processing elicited by the task, which is not present during resting-state. In contrast, resting-state BOLD variability captures only spontaneous fluctuations in the BOLD signal, which as mentioned above, may be in part sensitive to cardiovascular sources of variance or network organization. Hence, one might predict that task-driven BOLD variability should be more sensitive than resting-state variability to behavioral measures – even those obtained outside the scanner – and that behavioral relationships with resting-state BOLD variability should be more sensitive to cardiovascular factors. Alternatively, to the extent that BOLD variability reflects underlying network organization, one might expect to see consistency in these estimates and their relationships with behavior across resting-state and task-driven contexts.
In the present study, we examined relationships between BOLD variability and cognition, using a large, well-characterized sample of cognitively normal middle-aged to older adults. We obtained composite measures of global cognition, episodic memory, and attentional control, using standard neuropsychological tests and well-established attentional control tasks. Further, we compared relationships of these cognitive composites, as well as in-scanner task performance, to estimates of BOLD variability derived from both resting-state and task-driven fMRI scans. Hence, we are able to evaluate whether behavioral relationships with BOLD variability reflect stable individual differences, and whether they are differentially sensitive to spontaneous vs. task-evoked sources of variance in the BOLD signal. Additionally, we examined the contribution of cardiovascular factors to behavioral relationships with BOLD variability by correcting for measures of cardiovascular health, including pulse, blood pressure, BMI, and WMH, and also carefully correcting for motion and global signal artifacts in BOLD variability (see Millar et al., in press). Finally, in contrast to previous studies, which most often use a voxel-based or partial least squares approach, we applied a network-based machine-learning approach to evaluate whether multivariate patterns in BOLD variability offer predictive accuracy of behavioral measures, and further, whether these relationships follow anatomically meaningful patterns at the level of functional networks (see Millar et al., in press). Specifically, if BOLD variability reflects an important property of neural processing or network organization, we should expect these relationships to exhibit meaningful anatomical patterns at the network level especially in those networks most relevant to task performance.
Methods
Participants
As described previously (Millar et al., in press), a sample of 190 older adult participants were selected from a larger set of participants enrolled in the Adult Children Study (ACS) and the Healthy Aging and Senile Dementia (HASD) cohorts at the Charles and Joanne Knight Alzheimer Disease Research Center (ADRC) at Washington University in St. Louis. The sample was selected on the basis of having a minimum value of usable resting-state fMRI data (see below), cognitive normality, as carefully assessed by trained clinicians using the Clinical Dementia Rating (CDR; Morris, 1993), absence of severe psychiatric conditions, low mean head motion (FD < .20 mm, see Millar et al., in press), availability of four estimates of cardiovascular health (see below), and availability of at least one cognitive composite measure (see below). One participant was also excluded as a potential outlier (> 4 SD from the sample mean), based on average BOLD SD across all 298 regions of interest (see “Calculation of BOLD variability”).
A subset of 72 participants from the same Adult Children Study cohort also completed a task-driven fMRI session, as previously described (Gordon et al., 2015). This subset was selected using the same criteria as the resting-state sample, as well as additional criteria including native English speaker status and minimum performance on in-scanner behavioral tasks (see below). One participant was also excluded as a potential outlier (> 4 SD from the sample mean), based on average BOLD SD across all regions of interest. Table 1 provides a descriptive summary of both resting-state and task-driven fMRI samples. Histograms displaying the distribution of the critical variables are provided in Figure 1. As shown in Table 1, the two samples were well matched in demographic variables, including age, sex, education, and race (p’s > .40, effect sizes < 0.12). All procedures were approved by the Human Research Protection Office at Washington University in St. Louis. All participants provided informed consent prior to all procedures.
Table 1.
Demographic and summary measures of the samples.
| Resting-State fMRI Sample | Task-Driven fMRI Sample | |||||||||
|---|---|---|---|---|---|---|---|---|---|---|
| Measure (units) | N | Mean (SD) | Range | N | Mean (SD) | Range | t | p | Cohen’s d | |
| Demo-graphic | Age (years) | 190 | 65.05 (8.39) | 46–88 | 72 | 64.1 (7.56) | 49–79 | 0.84 | 0.40 | 0.12 |
| Sex (N female / N male) | 190 | 116 / 74 | NA | 72 | 47 / 25 | NA | 0.40a | 0.53a | 0.04b | |
| Education (years) | 178 | 16.1 (2.42) | 12–20 | 72 | 16.03 (3.07) | 12–20 | 0.20 | 0.84 | 0.03 | |
| Race (N white / N black / N Asian) | 175 | 167 / 1 / 1 | NA | 71 | 69 / 1 / 1 | NA | 0.81a | 0.67a | 0.05b | |
| Mean Head Motion (mm FD) | 190 | 0.13 (0.03) | 0.06–0.2 | 72 | 0.14 (0.03) | 0.07–0.2 | −2.28 | 0.02 | −0.32 | |
| Psycho-metric | MMSE (score) | 156 | 29.29 (1.01) | 26–30 | 63 | 29.43 (0.78) | 27–30 | −0.94 | 0.35 | −0.14 |
| FCSR: Free Recall (score) | 185 | 32.19 (5.12) | 18–46 | 71 | 33 (5.93) | 21–48 | −1.09 | 0.28 | −0.15 | |
| WMS Associate Learning (score) | 97 | 14.65 (3.79) | 0–21 | 17 | 15.74 (3.58) | 7–21 | −1.09 | 0.28 | −0.29 | |
| WMS-R Logical Memory Delayed Recall (score) | 97 | 12.92 (3.95) | 5–21 | 18 | 13.61 (4.45) | 6–21 | −0.67 | 0.50 | −0.17 | |
| WMS-III Logical Memory Delayed Recall (score) | 69 | 26.94 (7.29) | 4–42 | 45 | 27.49 (5.4) | 12–38 | −0.43 | 0.67 | −0.08 | |
| Animal Naming (score) | 185 | 22.72 (5.75) | 9–41 | 71 | 23.44 (5.83) | 12–39 | −0.88 | 0.38 | −0.12 | |
| Trail Making A (score) | 185 | 29.11 (10.64) | 12–75 | 71 | 27.2 (9.6) | 13–57 | 1.32 | 0.19 | 0.19 | |
| Trail Making B (score) | 184 | 71.51 (29.82) | 28–210 | 71 | 60.61 (19.98) | 28–139 | 2.84 | 0.005 | 0.40 | |
| Cardio-vascular | Pulse (BPM) | 190 | 68.02 (10.38) | 41–108 | 72 | 67.67 (10.25) | 44–96 | 0.25 | 0.81 | 0.03 |
| Systolic Blood Pressure (mmHg) | 190 | 124.55 (15.66) | 88–168 | 72 | 122.94 (14.26) | 88–160 | 0.76 | 0.45 | 0.11 | |
| BMI (kg/m2) | 190 | 26.43 (4.43) | 17–41 | 72 | 26.42 (4.59) | 17–40 | 0.02 | 0.99 | 0.002 | |
| WMH volume (mm3) | 190 | 10760.25 (11530.16) | 48–61263 | 72 | 7848.07 (8312.75) | 651–37890 | 1.96 | 0.05 | 0.27 | |
T and p values are from independent-samples t-tests between the resting-state and task-driven samples, except for categorical variables tested by chi-square test (χ2), as noted by.
Effect sizes are reported as Cohen’s d, except for categorical variables reported as Cramer’s V, as noted by.
FD = framewise displacement, MMSE = Mini Mental State Examination, FCSR = Free and Cued Selective Reminding test, BPM = beats per minute, BMI = body mass index, WMH = white matter hyperintensities.
Figure 1.
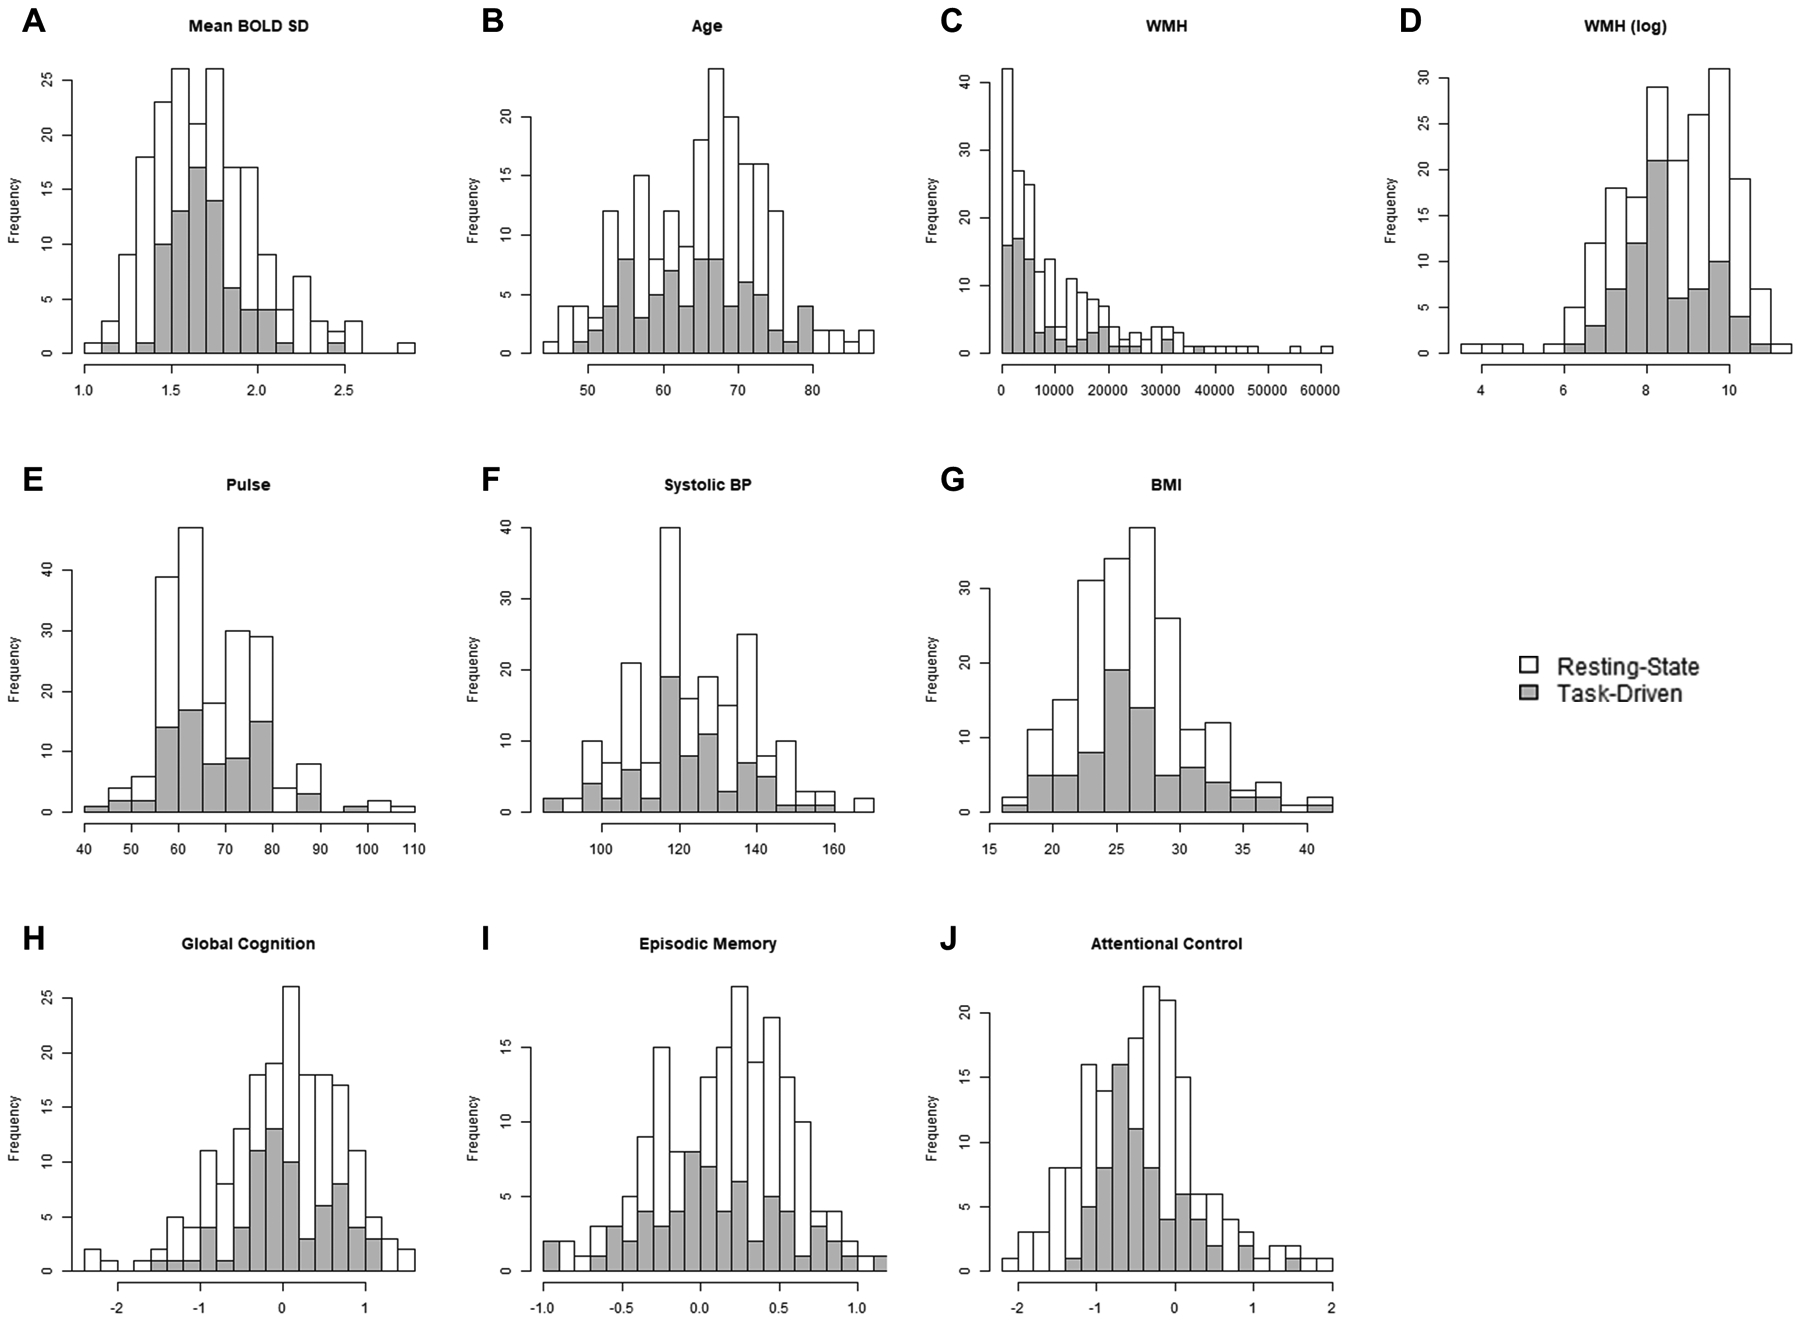
Histograms of critical measures used in the present analyses including mean BOLD SD across all ROIs (A), age (B), cardiovascular health measures (C – G), and cognitive composite scores (H – J). Distributions of each variable are presented separately for the resting-state (white) and task-driven (grey) samples.
Psychometric Composites of Global Cognition and Episodic Memory Tasks
Each participant completed a 2-hour battery of neuropsychological tests. In order to investigate relationships between BOLD variability, episodic memory, and global cognitive function, we examined performance on a subset of tasks across multiple cognitive domains. Measures of episodic memory included the Free and Cued Selective Reminding Test (FCSR) free recall score (Grober, Buschke, Crystal, Bang, & Dresner, 1988), the Associate Learning subtest from the Wechsler Memory Scale (WMS; Wechsler & Stone, 1973), and delayed recall scores from two versions of the Logical Memory test (WMS-R; Wechsler, 1987, WAIS-III; 1997), which differed across the ACS and HASD cohorts. An episodic memory composite was calculated as the average of standardized FCSR free recall, Associate Learning, and Logical Memory delayed recall, as this composite has been previously used as a sensitive individual difference measure (Aschenbrenner et al., 2015). As shown in Table 2, we observed strong positive relationships between all measures in the episodic memory composite (Pearson’s r’s from .48 to .75). Due to missing data in several of the behavioral tasks, we allowed for up to one missing value in the calculation of each cognitive composite.
Table 2.
Correlations among neuropsychological and cognitive test measures in the resting-state fMRI sample.
| FCSR: Free Recall | Associate Learning | Logical Memory | Animal Naming | Trails A | Trails B | Stroop effect | Simon effect | Global switch | |
|---|---|---|---|---|---|---|---|---|---|
| FCSR: Free Recall | 0.75*** | 0.72*** | 0.22^ | −0.32** | −0.16 | −0.28* | −0.06 | −0.28* | |
| Associate Learning | 0.53*** | 0.63** | 0.21 | −0.69*** | −0.51* | −0.4 | −0.14 | −0.54* | |
| Logical Memory | 0.48*** | 0.54*** | 0.11 | −0.35 | −0.18 | −0.17 | −0.28 | −0.11 | |
| Animal Naming | 0.41*** | 0.24** | 0.37*** | −0.15 | −0.17 | −0.22 | 0.12 | −0.16 | |
| Trails A | −0.25*** | −0.21** | −0.05 | −0.29*** | 0.5*** | 0.3* | 0.21^ | 0.11 | |
| Trails B | −0.28*** | −0.28*** | −0.2** | −0.3*** | 0.57*** | 0.31* | 0.05 | 0.28* | |
| Stroop effect | −0.26** | −0.23^ | −0.24* | −0.09 | 0.33*** | 0.37*** | 0.27* | 0.39** | |
| Simon effect | −0.17** | −0.12 | −0.08 | −0.18** | 0.45*** | 0.23*** | 0.27** | 0.01 | |
| Global switch | −0.33*** | −0.24** | −0.24** | −0.36*** | 0.35*** | 0.32*** | 0.19* | 0.21*** |
Correlations in the resting-state sample are presented in the lower triangle. Correlations in the task-driven sample are presented in the upper triangle. Bold values reflect correlations between measures assigned to a common a priori cognitive composite.
p < .10;
p < .05;
p < .01;
p < .001
We also examined a global cognitive composite, which included measures of semantic fluency (Animal Naming; Goodglass & Kaplan, 1983), processing speed (Trail Making A, Armitage, 1946), executive function (Trail Making B, Armitage, 1946), as well as FCSR free recall. The global cognitive composite was calculated as the average of standardized FCSR free recall, Animal Naming, and reverse-scored Trail Making A & B, and has also been previously used as a sensitive individual difference measure (Aschenbrenner, Gordon, Benzinger, Morris, & Hassenstab, 2018). As shown in Table 2, we observed moderate relationships in the expected directions between all measures in the global composite (absolute r’s from .15 to .57).
Attentional Control Composite Tasks
In addition to the neuropsychological test batteries, participants also completed a battery of computerized attentional control tasks. Participants completed a Stroop color-naming task (Spieler, Balota, & Faust, 1996; Stroop, 1935), a Simon spatial interference task (Castel, Balota, Hutchison, Logan, & Yap, 2007; Simon, 1969), and a consonant-vowel/odd-even (CVOE) task-switching task (Huff, Balota, Minear, Aschenbrenner, & Duchek, 2015).
Briefly, in the Stroop task, participants viewed 36 congruent color words (“blue”, “green”, “red”, or “yellow” presented in the corresponding color), 36 incongruent color words (the same 4 color words presented in a non-matching color), and 32 neutral words (“poor”, “deep”, “bad”, or “legal” presented in one of the 4 colors). Participants were instructed to vocally name the color of each word into a microphone. Accuracy of each trial was coded by an experimenter as correct, incorrect, or microphone error.
In the Simon task, participants viewed 40 congruent horizontal arrows (facing left or right and appearing on the corresponding side of the screen), 40 incongruent arrows (appearing on the opposite side of the screen as the direction of the arrow), and 40 neutral arrows (appearing in the center of the screen). Participants were instructed to manually report the direction of the arrow (left or right) by button press.
The CVOE task consisted of two task-pure blocks and a task-switching block. During each pure block, participants viewed 48 letter-number pairs (e.g., “D 06”) and were instructed to manually classify either the letter (consonant or vowel) or the number (odd or even) by button press. During the switch block, participants were cued to make letter or number classifications in alternating runs of 2 trials for each classification type, resulting in a total of 30 switch trials (in which participants switched from one dimension to the other) and 30 non-switch trials (in which participants repeated the same response dimension).
In each task, performance was assessed using the difference score of reaction times (RT) between two conditions of interest. In all tasks, we examined only RTs from accurate trials. In order to limit the influence of extreme outliers, we excluded individual trials with RTs less than 200 ms or greater than 3 SDs above or below the individual participant’s mean RT on each task. The Stroop and Simon effects (difference between incongruent and congruent trials) are established indices of selective attention or interference, while the global switch effect (difference between non-switch trials in CVOE switch blocks and pure block trials) is thought to reflect the cost of maintaining multiple task sets. Hence, we calculated an attentional control composite as the average of the standardized Stroop effect, Simon effect, and global CVOE switch cost measures. We have previously used a similar composite of estimates from these same tasks as a sensitive individual difference marker (Aschenbrenner et al., 2015). As shown in Table 2, we observed moderate, significant correlations between most of the attentional control difference scores (r’s from .19 to .39), except for the relationship between Simon effect and global CVOE switch cost in the smaller task-driven fMRI sample.1
It is possible that individual differences in processing speed might contribute to RT differences in the attentional composite tasks. Hence, we used a standard estimate of processing speed (performance on Trails A) as a covariate to control for the influence of processing speed on RT difference scores (see Wolf et al., 2014). We present relationships with attentional control before and after residualizing the composite for Trails A performance in order to examine whether relationships with attentional control are observed after correcting for processing speed.
Cardiovascular Health Measures
Based on recent demonstrations that BOLD variability may be sensitive to individual differences in cardiovascular health (CVH) (Millar et al., in press; Tsvetanov et al., 2019), we examined available measures of CVH, including resting pulse, systolic blood pressure, body mass index (BMI), and white matter hyperintensity (WMH) lesion volume. WMH volumes were assessed with a fluid-attenuated inversion recovery (FLAIR) sequence, after segmentation using the Lesion Segmentation Tool (LST; Schmidt et al., 2012) for SPM 8. We used estimates of pulse, systolic blood pressure, BMI, and WMH as CVH covariates in the analyses where indicated below.2
Structural, Resting-State, and Task-Driven Scanning Protocols
MRI data were obtained using two separate Siemens Trio 3T scanners with a standard 12-channel head coil. In order to examine the possibility that behavioral relationships with resting-state BOLD variability might be confounded by differences in the scanners, we also tested the results with each composite after controlling for scanner as a factor of non-interest. The observed relationships were consistent after controlling for the scanner. Structural and functional scans were acquired using methods described previously (Brier et al., 2012; Millar et al., in press). Structural scans were acquired with a sagittal T1-weighted magnetization-prepared rapid gradient echo sequence (MPRAGE; TR = 2400 ms, TE = 3.16 ms, flip angle = 8°, field of view = 256 mm, 1-mm isotropic voxels), as well as an oblique T2-weighted fast spin echo sequence (FSE; TR = 3200 ms, TE = 455 ms, 256 × 256 acquisition matrix, 1-mm isotropic voxels).
Resting-state functional scans were acquired with an interleaved whole-brain echo planar imaging sequence (EPI; TR = 2200 ms, TE = 27 ms, flip angle = 90°, field of view = 256 mm, 4-mm isotropic voxels). Participants completed two consecutive runs of resting-state functional imaging (6 minutes,164 volumes each), during which they were instructed to stay awake and fixate on a visual crosshair.
As described previously (Gordon et al., 2015), task-driven functional scans were acquired in a separate session with an interleaved whole-brain EPI sequence (TR = 2000 ms, TE = 25 ms, flip angle = 90°, field of view = 256 mm, 4-mm isotropic voxels). Participants completed two runs of an animacy judgment task (10 minutes and 6 seconds, 303 volumes each), followed by two runs of a Stroop color-naming task (9 minutes and 50 seconds, 295 volumes each).
Briefly, during each task run, participants alternated between 5 blocks of rest (30 seconds each) and 4 blocks of task performance (114 seconds each for animacy; 110 seconds for Stroop). During rest intervals, participants fixated on a visual crosshair. During each animacy task block, participants viewed a randomly intermixed sequence of 24 words (12 living and 12 nonliving), which were balanced for length, frequency, and orthographic neighborhood. On each trial, participants were instructed to manually report via a keypress whether the word represented a living or a nonliving thing by button press. During each Stroop task block, participants viewed a randomly intermixed sequence of 12 congruent color words (e.g., “red” in red), 12 incongruent color words (e.g., “blue” in red), and 12 neutral words (e.g., “deep” in red). On each trial, participants were instructed to manually report via a keypress whether the word was presented in a red or blue color by button press. In both tasks, each word appeared for 1 second, followed by a jittered inter-trial interval of 1, 3, 5, or 9 seconds. Participants completed practice trials of both tasks before entering the scanner.
Functional Preprocessing
Since we have previously demonstrated that estimates of BOLD variability are influenced by differences in head motion (Millar et al., in press), we conservatively controlled for artifact-related influences in the current dataset using global signal regression (GSR), censoring of high-motion frames, and exclusion of individuals with high mean head motion. Initial preprocessing for both resting-state and task-driven fMRI data followed conventional methods, as described previously (Brier et al., 2012; Millar et al., in press; Shulman et al., 2010). Briefly, these steps included frame alignment, debanding, rigid body transformation, bias field correction, and mode 1000 normalization. Transformation to an age-appropriate atlas template in 711–2B space was performed using a composition of affine transforms connecting the functional volumes with the T2-weighted and MPRAGE images. Head movement correction was included in a single resampling that generated a volumetric timeseries in isotropic 3-mm atlas space.
As described previously (Fox et al., 2009; Millar et al., in press), additional processing was performed to allow for nuisance variable regression. First, masks of whole brain, grey matter, white matter, and CSF were generated from T1 images in FreeSurfer 5.3 (Fischl, 2012). Second, two indices of framewise motion were calculated across the BOLD timeseries, including framewise displacement (FD; Power, Barnes, Snyder, Schlaggar, & Petersen, 2012) and derivative of RMS variance over voxels (DVARS). Third, BOLD data were subjected to a temporal band-pass filter (0.005 Hz < f < 0.1 Hz). Fourth, BOLD data were subjected to nuisance variable regression, including 6 motion parameters, timeseries from the whole brain (global signal), CSF, ventricle, and white matter masks, as well as the derivatives of these signals. Task-driven fMRI data was subjected to additional nuisance regressors of the task block design within runs (Fair et al., 2007). Finally, BOLD data were spatially blurred (6 mm full width at half maximum).
Preprocessed BOLD data were subjected to framewise censoring based on motion estimates. Specifically, volumes were censored if FD exceeded 0.2 mm or if DVARS exceeded 2.5 SD from the participant’s mean. Motion-related differences in the number of censored frames might confound the magnitude and/or reliability of BOLD variability estimates. Moreover, differences in the number of usable frames may bias BOLD variability estimates between the resting-state and task-driven scans, which were of different lengths. Thus, we analyzed BOLD variability during resting-state within a subset of 200 randomly-selected usable frames from either resting-state run for each participant. Participants with fewer than 200 usable frames were excluded. Similarly, we analyzed task-driven BOLD variability within a subset of 200 randomly-selected usable task block frames for each participant (100 from animacy task blocks, 100 from Stroop task blocks).3 Finally, we analyzed BOLD variability during fixation blocks between task blocks within a subset of 100 randomly-selected usable frames. In order to control for mean differences across blocks, we subtracted the voxelwise block means from the timeseries data before concatenating task or fixation blocks (Garrett et al., 2010). We also examined variability estimates from each task separately (using 200 randomly-selected frames per task), but found evidence of multivariate relationships between BOLD variability and head motion in both tasks even after applying global signal regression and framewise censoring (R2’s from SVR models prediction head motion = .162, .117, p’s ≤ .003) (cf., Millar et al., 2020)4. Hence, to minimize the potential confounding influence of motion, we focus on variability from the concatenated task blocks including both animacy and Stroop performance, in which the multivariate sensitivity was eliminated (R2 = .016, p = .276). BOLD variability estimates in 298 regions of interest (see “Calculation of BOLD Variability”) during Stroop and animacy tasks were highly correlated (average r = .78, range = .53 to .95).
Calculation of BOLD Variability
As described previously (Millar et al., in press), final BOLD timeseries data were averaged across voxels within 298 ROIs from an expanded version of a previously defined atlas (Power et al., 2011; Seitzman et al., 2020), including 243 10-mm cortical spheres, 28 8-mm subcortical spheres, and 27 8-mm spheres in the cerebellum (see Seitzman et al., 2020 for a figure). Importantly, each ROI was assigned to one of 13 networks, including: somatomotor (SM), lateral somatomotor (SML), cingulo-opercular (CO), auditory (AUD), default mode (DMN), parietal memory (PMN), visual (VIS), fronto-parietal (FPN), salience (SAL), subcortical (SUB), ventral attention (VAN), dorsal attention (DAN), and cerebellum (CER). In each ROI, we calculated the SD of the BOLD signal over the 200 selected usable resting-state frames, 200 usable task-driven frames, or 100 fixation frames in the residualized timeseries data after applying nuisance regression and framewise censoring. These SD values served as our regional estimates of BOLD variability.5
Support Vector Regression
Support vector regression (SVR) analyses were conducted using the e1071 package in R (Meyer et al., 2017). Briefly, SVR is a supervised machine learning technique in which a model is trained to identify multivariate relationships between a set of features (i.e., resting-state or task-driven BOLD SDs in the 298 ROIs) and a continuous label (e.g., composites of global cognition, episodic memory, or attentional control). We performed epsilon-insensitive SVR, as described previously (Dosenbach et al., 2010; Millar et al., in press; Nielsen et al., 2018). Briefly, in each training fold, a regression line is fit in multivariate space between the feature set values and the label values. A tube of width epsilon is defined around the regression line. Data points outside this tube are penalized, while points inside the tube are not. The penalty factor C determines the trade-off between training error and model complexity. All SVR analyses were performed with epsilon = 0.00001 and C = infinity, based on previous reports predicting age from functional connectivity (Dosenbach et al., 2010; Nielsen, Greene, et al., 2019) and BOLD variability (Millar et al., in press).
Importantly, the SVR model is trained on a subset of cases (the training set), allowing for the assessment of model prediction in an unseen set of cases (the testing set). Specifically, we evaluated predictive accuracy using 10-fold cross-validation. For each of the 10 folds, a non-overlapping set of 10% of the sample served as the testing set. The remaining 90% served as the training set. Thus, across the 10 folds, the SVR model predicted a label value for each participant. We quantified predictive accuracy as R2 between the model-predicted and the true label values for each participant. We tested the predictive accuracy of SVR models trained on the full feature set of BOLD SD values from all 298 ROIs. Specifically, we tested the performance of these models to predict cognitive composites and measures of in-scanner behavioral performance as labels of interest. Thus, the SVR approach evaluates the predictive sensitivity of BOLD SD for domain-specific cognitive estimates in untrained observations, which has not been assessed in previous studies of BOLD variability.
Assessment of Network Specificity of Relationships
Network specificity of relationships with BOLD SD was assessed in two ways. First, univariate regional correlations were calculated between the measure of interest and BOLD SD within each of the 298 ROIs. Significance of network-level relationships was tested using a bootstrap approach with 10,000 samples by resampling the dataset with replacement. In each bootstrap sample, we calculated the correlation with the measure of interest in each ROI, then averaged the correlation values across ROIs within each network. Across bootstrap samples, we then calculated the empirical 95% confidence interval for each network-level correlation.
Second, we assessed the multivariate predictive accuracy of networks using feature selection. Specifically, SVR models predicted a measure of interest from a limited feature set of regions restricted to a single network. Since larger networks should perform better simply due to a greater number of features, which might capture a related signal by chance, we compared SVR performance for network-specific feature sets to a bootstrapped distribution of 10,000 randomly selected feature sets (i.e., random regions from any network), which were matched in the number of features. Hence, this distribution is an appropriate null model to test whether signals are localized to specific networks or instead broadly distributed throughout the brain (Nielsen, Barch, Petersen, Schlaggar, & Greene, 2019).
Results
Comparison of Resting-State and Task-Driven BOLD Variability Estimates
In order to examine BOLD variability estimates resting-state vs. task-driven scans, we first compared estimates of BOLD SD within each network as a function of scan type (resting-state vs. task-driven) using a subset of 40 participants who had usable scans of both types collected on the same day. We tested for main effects of scan type and network, as well as the scan × network interaction using a repeated-measures analysis of variance (ANOVA). Overall, we observed a main effect of scan type (F = 9.05, p = .005, η2p = 0.19), such that on average resting-state BOLD SD (M = 1.79) was greater than task-driven BOLD SD (M = 1.61). This main effect was further characterized by a significant scan × network interaction (F = 31.60, p < .001 η2p = 0.44). As shown in Figure 2A, resting-state BOLD SD was significantly greater than task-driven BOLD SD in most networks (Somatomotor, Lateral Somatomotor, Default Mode, Parietal Memory, Visual, Frontoparietal, Salience, Subcortical, Ventral Attention, and Dorsal Attention Networks; p’s ≤ .021, Cohen’s d’s from 0.38 to 1.38), although task-driven BOLD SD was significantly greater in the Cerebellum network (p < .001, Cohen’s d = 1.19).
Figure 2.

Network-level BOLD SD as a function of scan type (A; resting-state vs. task-driven) and block type within the task-driven scan (B; fixation vs. animacy vs. Stroop). Error bars display standard error of the mean.
We also compared estimates of BOLD SD in each network as a function of block type (fixation vs. animacy vs. Stroop) using a subset of 71 participants who had usable SD estimates for each block (100 concatenated usable frames per block type). We tested the main effects and interaction of block type and network, using a repeated-measures ANOVA. We observed a main effect of block type (F = 72.68, p < .001, η2p = 0.51). Post-hoc comparisons revealed that on average BOLD SD during fixation (M = 1.81) was significantly greater than BOLD SD during the animacy task (M = 1.62, t = 9.17, p < .001, Cohen’s d = 1.09) and also greater than BOLD SD during Stroop (M = 1.62, t = 11.03, p < .001, Cohen’s d = 1.31). This main effect was also characterized by a significant block × network interaction (F = 9.31, p < .001, η2p = 0.12). As shown in Figure 2B, BOLD SD in each network was significantly greater during fixation than during the animacy blocks (p’s < .001, Cohen’s d’s from 0.69 to 1.40) or during the Stroop blocks (p’s < .001, Cohen’s d’s from 0.68 to 1.73). In contrast, differences in network estimates of BOLD SD between the animacy and Stroop blocks were smaller and in no consistent direction. Specifically, variability was significantly greater during animacy than Stroop in the ventral attention network (p = .02, Cohen’s d = 0.28), but other networks were at most marginally different between tasks (p’s ≥ .08, Cohen’s d’s from 0.04 to 0.21).
Additionally, we assessed the consistency of BOLD variability estimates across scans by calculating the regional correlations between resting-state and task-driven BOLD variability within the same subset of participants. The correlations between resting-state and task-driven BOLD SD estimates were surprisingly low (average r = .30, range = −.19 to .80). Of course, this low correlation could be due to low reliability of the task-driven or the resting-state BOLD SD estimates. As noted, BOLD variability estimates during Stroop and animacy tasks were highly correlated with each other (average r = .78, range = .53 to .95). Hence, it appears that the task-driven BOLD SD is stable, at least between runs within one session. In addition, as reported in an overlapping subset of the current sample by Millar and colleagues (in press), the test-retest reliabilities of the resting-state BOLD SD estimates are quite stable, as reflected by moderate correlations over a 3-year longitudinal follow-up (average r = .46, range = .18 to .71), and indeed were comparable to intra-network connectivity estimates in this same sample (average r = .45, range = .30 to .60).
Relationships with Cognitive Composite Measures
Global Cognition.
As shown in Table 2, SVR models were able to successfully predict global cognition scores from the full feature set of resting-state BOLD SD using all 298 ROIs (R2 = .045, p = .004). We evaluated the multivariate relationship between global cognition and resting-state BOLD SD in terms of specific networks using network-driven feature selection. As shown in Figure 3A, BOLD SD estimates within the dorsal attention (DAN; R2 = .014) and default mode networks (DMN; R2 = .011) were relatively successful in predicting global cognition, compared to other networks. This level of performance might be expected in the DMN, since it includes a large number of individual ROIs and may capture related signal by chance. Hence, we tested the specificity of these network relationships by comparing SVR performance from the DAN and DMN to bootstrapped distributions of 10,000 randomly selected regions of equal set size from any network. SVR performance from the DAN did not outperform the matched bootstrapped distribution (empirical p = .232), nor did the DMN (empirical p = .619). Indeed, SVR performance from all networks fell within the range expected by randomly selected regions. Hence, the multivariate relationship between BOLD SD and global cognition is likely spread throughout networks with little anatomical specificity.
Figure 3.

Performance of SVR models predicting global cognition (A), attentional control (B & C), and in-scanner incongruent Stroop ZRT (D) across a range of feature sets (from 5 to 295). Models in A & B use resting-state BOLD SD as inputs, while models in C & D use task-driven BOLD SD. Colored diamonds denote anatomical feature selection schemes, in which features included only ROIs from a specific network. Each network-specific model was compared to 10,000 simulated models using randomly selected feature sets from any functional network. For simplicity, only 25 of the simulated models are plotted for each feature set size (black dots). E. Color key for network identities.
However, global cognition did not relate to BOLD SD in the task-driven fMRI sample. As shown in Table 2, SVR models were not able to predict global cognitive scores from task-driven BOLD SD (R2 = .025, p = .188). Thus, the global cognitive relationships observed during resting-state do not replicate in estimates of task-driven BOLD SD.6
Episodic Memory.
As shown in Table 2, SVR models were not able to predict episodic memory scores from resting-state BOLD SD (R2 = .007, p = .279). In the task-driven fMRI sample, the slope between true episodic memory composite scores and values predicted by the SVR model was significantly negative (r = −.395, R2 = .156, p = .001, see Table 2), suggesting that the model was not able to accurately predict episodic memory based on estimates of task-driven BOLD SD.
Attentional Control.
As shown in Table 2, SVR models were able to successfully predict attentional control from resting-state BOLD SD using all 298 ROIs (R2 = .106, p < .001). We evaluated the multivariate relationship between the attention composite and resting-state BOLD SD in terms of specific networks using network-driven feature selection. As shown in Figure 3B, BOLD SD estimates within the visual network (R2 = .060) were relatively successful in predicting the attention composite, compared to other networks, and marginally outperformed a matched bootstrapped distribution (empirical p = .062). Hence, the multivariate relationship between BOLD SD and attentional control may be particularly strong in the visual network.
As noted, raw RT difference scores in the attentional control tasks may be influenced by individual differences in processing speed. Hence, we sought to test BOLD SD relationships with the attentional control composite after residualizing performance on Trails A to control for processing speed. SVR models were marginally successful in predicting the corrected attentional control scores from resting-state BOLD SD (R2 = .020, p = .067, see Table 2). Hence, after correcting for processing speed, resting-state BOLD SD may still capture a small portion of variance in estimates of attentional control.
Turning now to task-driven BOLD SD, we found that the attentional control composite was again related to BOLD SD. As shown in Table 2, SVR models were able to successfully predict attentional control from task-driven BOLD SD (R2 = .135, p = .002). Again, we evaluated the multivariate relationship between attention and task-driven BOLD SD in terms of specific networks using network-driven feature selection. As shown in Figure 3C, BOLD SD estimates within the cingulo-opercular network (R2 = .201) were particularly successful in predicting attentional control, compared to other networks, and significantly outperformed a matched bootstrapped distribution (empirical p = .036). SVR performance from other networks fell within the range expected by randomly selected regions. (empirical p’s ≥ .222). Hence, the multivariate relationship between task-driven BOLD SD and attentional control may be particularly strong in the cingulo-opercular network.
As shown in Table 2, SVR models were also able to predict attentional control from task-driven BOLD SD after correcting for processing speed in estimates residualized for Trails A performance (R2 = .141, p = .002). Hence, relationships with attentional control observed in the resting-state estimates were generally consistent in task-driven BOLD SD.
Age-Related Influences on Cognitive Relationships
Although the observed behavioral relationships with resting-state and task-driven BOLD variability are consistent with previous studies (e.g., Garrett et al., 2011), it is possible that these relationships might be sensitive to age-related variability. As noted, we and others have demonstrated that BOLD variability is associated with age (e.g., Garrett et al., 2010), including within a mostly overlapping sample (see Millar et al., in press). Moreover, there were indeed significant age relationships with the global (r = −.42, p < .001) and attentional (r = .36, p < .001) composite measures. Thus, in the current sample, BOLD variability might only relate to cognition to the extent it is sensitive to age in general. Hence, we sought to test the observed relationships between cognitive composite scores and residual BOLD SD estimates during both resting-state and task-driven runs after controlling for age as a continuous covariate using a regression approach.
As shown in Table 2 and Figure 4 (left column), most relationships between cognitive composites and resting-state BOLD SD were eliminated after controlling for age. Specifically, global cognition was not associated with BOLD SD in any network (See Figure 4A), nor were SVR models successful in predicting global cognition from corrected resting-state BOLD SD estimates (R2 < .001, see Table 2). Additionally, episodic memory was not associated with resting-state BOLD SD in any network, (see Figure 4C), nor were SVR models successful in predicting episodic memory (R2 = .018, see Table 2).
Figure 4.

Boxplots of the distribution of bootstrapped distributions of network average Pearson correlations between BOLD SD and global cognition (A & B), episodic memory (C & D), attentional control (E & F), and attentional control corrected for Trails A (G & H) after controlling for age. Relationships are shown for both resting-state (left column; A, C, E, & G) and task-driven fMRI sessions (right column; B, D, F & H). Distributions in which the 95% confidence interval (red lines) excludes 0 (dotted black line) reflect significant network-level relationships.
Turning to the attentional control composite, negative relationships with resting-state BOLD SD were eliminated in all networks after correcting for age (See Figure 4E & G). SVR models were unsuccessful in predicting attentional control after correcting for age (R2s ≤ .002, see Table 2).
In contrast to the resting-state results, correction for age had a much smaller influence on cognitive relationships with task-driven BOLD SD. Estimates of task-driven BOLD SD were largely unrelated to global cognition (Figure 4B) and episodic memory (Figure 4D) after correcting for age, see Table 2. However, as noted above, minimal relationships were observed with these measures in the uncorrected task-driven BOLD SD estimates, and thus, no relationships should be expected in the age-corrected estimates.
Most importantly, as shown in Figure 4F & H, we continued to observe marginal to significant negative relationships between the attentional control composite and task-driven BOLD SD after correcting for age. Specifically, greater task-driven BOLD SD estimates in several networks (including cingulo-opercular, default mode, parietal memory, visual, fronto-parietal, salience, ventral attention, dorsal attention, and cerebellum) were associated with reduced attentional control costs. Additionally, these relationships were consistent even after further correcting for individual differences in processing speed. Further, SVR prediction was still successful for the attention composite both before (R2 = .141, p = .002) and after correcting for processing speed (R2 = .139, p = .002), see Table 2. Hence, although cognitive relationships with resting-state BOLD variability may be influenced by age-related variability, relationships with task-driven variability remain after correcting for age, and thus, may be sensitive to distinct sources of variance.
Cardiovascular Influences on Cognitive Relationships
One potential mechanism through which age may influence cognitive relationships with BOLD variability is cardiovascular health. Recent studies have demonstrated that age relationships with BOLD variability are attenuated after correcting for individual differences in cardiovascular health (CVH) and/or cerebral blood flow (Millar et al., in press; Tsvetanov et al., 2019). However, it is unclear whether cardiovascular mechanisms might contribute to domain-specific cognitive relationships with BOLD variability. Hence, we sought to test the observed relationships between cognitive composite scores and residual BOLD SD estimates after controlling for cardiovascular factors. As noted above, we used individual estimates of pulse, systolic blood pressure, BMI, and WMH as covariates to control for individual differences in CVH.
As shown in Figure 5 (left column) and Table 2, most relationships between cognitive composites and resting-state BOLD SD were eliminated after controlling for CVH measures, similar to the effect of controlling for age. Specifically, global cognition was not associated with BOLD SD in any network (See Figure 5A), nor were SVR models successful in predicting global cognition from corrected resting-state BOLD SD estimates (R2 = .005, see Table 2), consistent with a previous report from a mostly overlapping sample (Millar et al., in press). Additionally, episodic memory was not associated with resting-state BOLD SD in any network after controlling for CVH (see Figure 5C & D), nor were SVR models successful in predicting episodic memory (R2 = .021, see Table 2).
Figure 5.

Boxplots of the distribution and 95% confidence interval (red lines) of bootstrapped distributions of network average Pearson correlations between BOLD SD and global cognition (A & B), episodic memory (C & D), attentional control (E & F), and attentional control corrected for Trails A (G & H) after controlling for CVH measures. Relationships are shown for both resting-state (left column; A, C, E, & G) and task-driven fMRI sessions (right column; B, D, F & H). Distributions in which the 95% confidence interval (red lines) excludes 0 (dotted black line) reflect significant network-level relationships.
Turning to the attentional control composite, negative relationships with resting-state BOLD SD were eliminated in all networks after correcting for CVH (See Figure 5E & G). Further, SVR models were unsuccessful in predicting the attention composite after correcting for CVH (R2’s ≤ .007, see Table 2)
Similar to the age corrections, however, correction for CVH had a much smaller influence on cognitive relationships with task-driven BOLD SD. Estimates of task-driven BOLD SD were largely unrelated to global cognition (Figure 5B) and episodic memory (Figure 5D) after correcting for CVH, see Table 2. However, as noted above, minimal relationships were observed with these measures in the uncorrected task-driven BOLD SD estimates, and thus, no relationships should be expected in the cardiovascular-corrected estimates.
Most importantly, as shown in Figure 5F & H, marginal to significant negative relationships between the attentional control composite and task-driven BOLD SD were again consistently observed in similar networks after correcting for CVH. Specifically, greater task-driven BOLD SD estimates in cingulo-opercular, default mode, parietal memory, visual, fronto-parietal, salience, dorsal attention, and cerebellum networks were associated with reduced attentional control costs. Again, these relationships were also consistent after controlling for Trails A performance. Further, SVR prediction of the attention composite was consistently successful, although somewhat reduced, after correcting for CVH both before (R2 = .062, p = .041) and after additionally correcting for processing speed (R2 = .093, p = .012), see Table 2. Hence, although cognitive relationships with resting-state BOLD variability may be influenced by CVH, attentional control relationships with task-driven variability remain after correcting for these measures, and thus, may be sensitive to distinct sources of variance.
Relationships with In-Scanner Task Performance
Moving beyond the cognitive composite estimates, which were collected in a separate session from the resting-state and task-driven fMRI sessions, we also evaluated whether BOLD SD was sensitive to behavioral performance in tasks completed within the fMRI scanner. Since the attentional control composite (which notably included a different Stroop task) was particularly related to BOLD SD during both resting-state and task-driven blocks, we focused on relationships with Stroop performance in the task-driven fMRI session. Although the composite measures operationalized attentional control using difference score costs in RT, as noted, these estimates are less reliable than simpler point estimates (Lord, 1956). The composite score approach we used might successfully compensate for the low reliability of difference score estimates when multiple attentional control tasks are available, but this approach is limited in the case of in-scanner task performance, since participants only completed a single Stroop task and an animacy judgment task. Hence, to improve the reliability of our in-scanner behavioral estimate, we focused on the average standardized RT (ZRT) of incongruent Stroop trials only. By standardizing incongruent RT in SD units above or below a participant’s overall mean RT, this measure also corrects for individual differences in overall processing speed (Faust, Balota, Spieler, & Ferraro, 1999).
Indeed, as shown in Figure 6A, we observed negative relationships such that greater task-driven BOLD SD was associated with less relative slowing on incongruent Stroop trials (i.e., faster Stroop incongruent ZRT). Specifically, marginal negative relationships were observed in somatomotor, visual, and dorsal attention networks. These relationships in the visual and dorsal attention networks are consistent with the networks in which task-driven BOLD SD was found to relate to attentional composite estimates. Further, as shown in Figure 6B, SVR models were marginally successful in predicting incongruent Stroop ZRT from task-driven BOLD SD (R2 = .051, p = .057).
Figure 6.

Relationships between task-driven BOLD SD and in-scanner incongruent Stroop ZRT. Boxplots (left column; A, C, & E) display the distribution and empirical 95% confidence interval (red lines) of bootstrapped distributions of network average Pearson correlations. Scatterplots (right column; B, D, & F) display in-scanner behavioral measures predicted by SVR model as a function of true score. Relationships are shown for uncorrected BOLD SD (A & B), as well as after controlling for age (C & D) and cardiovascular health estimates composite (CVH; E & F).
Again, we evaluated the multivariate relationship between incongruent Stroop ZRT and task-driven BOLD SD in terms of specific networks using network-driven feature selection. As shown in Figure 3D, BOLD SD estimates within the visual network (R2 = .172), were particularly successful in predicting incongruent ZRT, compared to other networks, and significantly outperformed a matched bootstrapped distribution (empirical p = .014). SVR performance from other networks fell within the range expected by randomly selected regions (empirical p’s ≥ .251). Hence, the multivariate relationship between task-driven BOLD SD and incongruent Stroop ZRT might be particularly strong in the visual network, but is otherwise widely distributed throughout networks.7
Importantly, the correlations with incongruent Stroop ZRT also remain after correction for age or CVH. As shown in Figure 6C &E, marginal negative relationships with Stroop performance were observed in consistent networks after controlling for age and CVH. Further, SVR models were marginally successful in predicting incongruent Stroop ZRT after correcting for age (R2 = .052, p = .054), although they were unsuccessful after controlling for CVH (R2 = .019, p = .246).
Finally, one possible interpretation of task-driven BOLD SD is that these estimates might largely capture task event-related modulations in the BOLD signal evoked by the task stimuli and performance. Thus, it is unclear whether task-driven BOLD SD might capture distinct fluctuations that are not captured in a traditional contrast comparison or event-related model of task activation. In order to examine this possibility, we tested the relationships between incongruent Stroop ZRT and task-driven BOLD variability after regressing the task event model from the BOLD timeseries data. Specifically, we included timing parameters for the event-related design of each trial type as nuisance regressors during BOLD preprocessing.
As shown in Figure 7A, negative relationships between incongruent Stroop ZRT and BOLD SD were observed in consistent networks after controlling for the task event model. SVR models were still able to marginally predict Stroop performance (R2 = .047, p = .069, see Figure 7B). Moreover, the network-level correlations and SVR performance were largely unchanged in estimates of task-driven BOLD SD corrected for age (see Figure 7C & D) and CVH (see Figure 7E & F). Hence, task-driven BOLD SD may capture task-relevant fluctuations in the BOLD signal that are distinct from task-related events.
Figure 7.

Relationships between task-driven BOLD SD and in-scanner incongruent Stroop ZRT after regressing out the model of task-related events. Boxplots (left column; A, C, & E) display the distribution and empirical 95% confidence interval (red lines) of bootstrapped distributions of network average Pearson correlations. Scatterplots (right column; B, D, & F) display in-scanner behavioral measures predicted by SVR model as a function of true score. Relationships are shown for uncorrected BOLD SD (A & B), as well as after controlling for age (C & D) and cardiovascular health estimates (CVH; E & F).
Discussion
The present study offers several noteworthy findings. First, we demonstrated that BOLD variability was greater during resting-state than during task-driven scans. Second, resting-state BOLD variability (but not task-driven BOLD variability) was related to better performance on a global cognitive composite measured outside the scanner. Third, BOLD variability estimates during both resting-state and task-driven runs were related with composite estimates of costs of attentional control demands. Fourth, task-driven BOLD variability was similarly related with less attentional control on in-scanner Stroop performance. Finally, the attentional relationships with task-driven BOLD variability remained after correction for age or CVH, while attentional and global cognitive relationships with resting-state variability did not. We now discuss each of these findings in turn, as we focus on interpretations of BOLD variability as a potential signal in relation to cognition, as well as how these findings extend upon previous reports in the literature.
Comparison of Resting-State vs. Task-Driven BOLD Variability
We observed significant modulations in BOLD variability estimates, such that variability was greater during resting-state than during task-driven runs. Additionally, BOLD variability during brief fixation blocks was significantly greater than variability during task performance. Thus, the present results consistently suggest that variability is elevated in off-task states during both relatively short (30 s) and long (360 s) timescales. These results conflict with recent reports that task-driven BOLD variability is increased in comparison to resting-state (Garrett, Kovacevic, et al., 2013; Grady & Garrett, 2018). Rather, the direction of the present result is more consistent with earlier demonstrations that task-driven BOLD variability and spontaneous activity is reduced during task performance (Bianciardi et al., 2009; Fransson, 2006; He, 2011). The direction of this effect might be explained by negative interaction between spontaneous and task-evoked activity (He, 2013). However, this effect might also be influenced by other factors, including the type of behavioral task performed, the timing of task-related events, and the sequential ordering of resting-state, task-driven, and fixation blocks. Hence, additional studies should further examine the influence of task performance on regional estimates of BOLD variability. Further, we also found that BOLD variability estimates were highly correlated across different tasks, but correlations were surprisingly low between task-driven and resting-state estimates. Together, these patterns suggest that task-driven BOLD variability estimates may be sensitive to distinct sources of variance from resting-state estimates, and that these signals may be relatively consistent across tasks.
Behavioral Sensitivity of BOLD Variability
Global Cognition.
Consistent with recent findings in a mostly-overlapping sample (Millar et al., in press), performance on a global cognitive composite of episodic memory (FSCR free recall), semantic fluency (Animal Naming), processing speed (Trail Making A), and executive function (Trail Making B) was associated with resting-state BOLD variability. The multivariate pattern of variability across networks captured a small, but significant, portion of variance in global cognition. Importantly, however, multivariate prediction of global cognition from individual networks did not outperform matched randomly-selected regions. Hence, associations between resting-state BOLD variability and global cognition are likely supported by a mechanism spread diffusely across functional networks.
However, relationships with global cognition did not replicate in a task-driven fMRI subsample. This difference was consistent after quantifying and controlling for differences in the time interval between behavioral task batteries and the resting-state and task-driven fMRI sessions (see Footnote 6). It is possible that BOLD variability during resting-state and task-driven runs might reflect qualitatively different signals. The presence of sensory input, demands of task performance, and motor responses likely elicit distinct sources of variance in the BOLD signal, which could augment or suppress spontaneous fluctuations observed during resting-state. Under this view, the cognitive sensitivity of a BOLD variability estimate might change depending upon the nature of the task being performed, as suggested by previous demonstrations of state-dependent modulations in BOLD variability (e.g., Grady & Garrett, 2018).
Episodic Memory.
In comparison to measures of global cognition and attentional control, we found very little support for associations between BOLD variability and episodic memory. This result was surprising considering a prior demonstration that resting-state BOLD variability was positively associated with a factor estimate of similar episodic memory measures (including Logical Memory, free recall, and paired associate tasks) in a similar, large sample of cognitively normal older adults (Burzynska et al., 2015). However, it is noteworthy that the emphasis in this study was on voxel-level variability as opposed to network-level variability.
Attentional Control.
The strongest behavioral relationships with BOLD variability were observed in measures of attentional control. Specifically, we found that smaller RT costs on a composite of attentional control tasks were associated with greater BOLD variability during both resting-state and task-driven runs in several sensory and association networks. Interestingly, some of the most consistent and robust relationships with attentional control were observed in the visual network. Notably, our composite measures of attentional control included all visually-presented stimuli. Hence, greater variability in visual areas (either during resting-state or task-driven runs) may reflect more flexible or efficient processing of randomly presented visual inputs (e.g., color processing of Stroop trials). This finding is consistent with several other associations between resting-state or task-driven BOLD variability in visual areas and performance on visually-mediated tasks (Burzynska et al., 2015; Garrett et al., 2011, 2014; Grady & Garrett, 2018; Guitart-Masip et al., 2016). Together, these results suggest that BOLD variability in visual areas is associated with more efficient processing of visual inputs, although it is unclear whether this relationship may be sensitive to mechanisms related to neural populating coding of Bayesian optimal probability distributions (Ma et al., 2006), exploration of possible activation states (Deco et al., 2011), dynamic range of processing areas, or some other potential mechanism.
Interestingly, although the attentional control composite was associated with BOLD variability in many of the same networks during resting-state and task-driven fMRI sessions, there were additional networks that only showed attentional relationships during task-driven runs: specifically cingulo-opercular, default mode, dorsal and ventral attention, as well as cerebellum networks. Notably, many of these networks are associated with the initiation and maintenance of goal-directed attentional control, as well as the detection of and orienting to salient stimuli (Corbetta & Shulman, 2002; Dosenbach, Fair, Cohen, Schlaggar, & Petersen, 2008). It is possible that variability in these networks might reflect modulation driven by control-related signals that were not elicited during the resting-state. Under this interpretation, task-driven BOLD variability may offer qualitatively different insights into behaviorally-relevant, network-level neural processing, compared to resting-state variability.
After correcting for individual differences in processing speed based on Trails A performance, relationships with task-driven BOLD variability estimates are highly consistent, although relationships with resting-state BOLD variability were clearly reduced. Specifically, the SVR prediction of attentional control was reduced by over 80% in comparison to the raw RT difference scores. Hence, multivariate relationships between resting-state BOLD variability and performance costs on the attentional control tasks may be sensitive in part to individual differences in processing speed (see Faust et al., 1999; Myerson, Hale, Wagstaff, Poon, & Smith, 1990; Salthouse, 1996). In contrast, relationships between attentional control and task-driven BOLD variability were robust to correction for processing speed. Thus, these task-driven estimates appear to be relatively sensitive to attentional selection processes above and beyond overall processing speed.
Beyond the attentional composite measures, greater task-driven BOLD variability was also associated with less slowing on incongruent Stroop trials completed in the scanner. These relationships were observed in similar networks that were related to the attentional composite estimates, including visual and dorsal attention networks, but with additional relationships in the somatomotor network. As noted, we used a ZRT estimate of performance that expresses incongruent RT in SD units above or below the participant’s mean RT, and thus, corrects for individual differences in processing speed. Hence, these associations with BOLD variability might be attributable to attentional control processes, beyond simple processing speed.
Sources of Variance in the BOLD Signal
Critically, we found that cognitive relationships with BOLD variability during resting-state were eliminated after correcting for age or CVH, but in contrast, relationships with task-driven variability remained after correction for these factors. This inconsistency might suggest a qualitative distinction between the sources of variance captured by resting-state vs. task-driven BOLD variability. Specifically, although resting-state BOLD variability indeed appears to be a behaviorally-sensitive signal, this relationship might be limited to more general influences on cognition. For instance, resting-state BOLD variability may only be sensitive to global cognition or attentional control insofar as it is sensitive to age or CVH rather than neural processing. This interpretation would be consistent with recent demonstrations that age differences in resting-state BOLD variability may be sensitive, at least in part, to cardiovascular and neurovascular factors (Millar et al., in press; Tsvetanov et al., 2015, 2019; but see Garrett et al., 2017). Moreover, these findings are also in line with proposals that vascular influences are an important factor in age-related cognitive decline (for review, see Abdelkarim et al., 2019; O’Brien et al., 2003; Wåhlin & Nyberg, 2019).
In contrast, task-driven BOLD variability appears to be sensitive to additional sources of variance in the BOLD signal above and beyond age and CVH. Since the task-driven fMRI session included a Stroop task and an animacy judgment task, which both required a degree of sustained attention, it is possible that task-driven estimates of variability might capture functional neural processing specifically relevant for the engagement and maintenance of attentional control. Thus, estimates of BOLD variability during attentional task performance may be particularly sensitive to measures of attentional control both inside and outside the scanner, and further, should be robust to individual differences in age and CVH. As noted, this interpretation also leads to the prediction that behavioral relationships with estimates of BOLD variability might vary depending on the cognitive demands of the task performed in the scanner, which is consistent with the present and previous demonstrations that BOLD variability may modulate as a function of task demands (Garrett et al., 2014; Grady & Garrett, 2018).
Finally, we observed that relationships between task-driven BOLD variability and in-scanner Stroop performance were largely consistent after regressing out the task event model from BOLD timeseries data. This result is consistent with the proposal that BOLD variability estimates capture distinct aspects of brain function from traditional mean-based task activation (Zhang et al., 2018). Further, these correlations also remained after correction for age and CVH. Hence, task-driven BOLD variability, particularly in somatomotor, visual, and dorsal attention networks, might be sensitive to behaviorally-relevant sources of BOLD variance above and beyond task event-related responses and age-related or vascular factors.
Limitations & Future Directions
As noted, our results suggest that the behavioral relevance of BOLD variability estimates might vary depending on the nature of the task performed in the scanner. However, we examined a limited task-driven dataset, which included only an animacy judgement and a Stroop task. Future studies should explore these relationships using fMRI tasks that engage a broader range of cognitive domains. BOLD variability during these tasks might yield different patterns of behavioral sensitivity to measures of performance both inside and outside the scanner.
Additionally, although resting-state and task-driven fMRI sessions were run (in most cases) on the same scanner and were processed through a matching pipeline, these sessions used different (but similar) functional imaging sequence parameters. Moreover, task-driven fMRI sessions were only run on a relatively small subset of the full resting-state fMRI cohort. Thus, direct comparison between the resting-state and task-driven BOLD variability estimates derived from these samples should be interpreted with caution and should be further examined in matched datasets.
In contrast to the present study, many other studies of BOLD variability have controlled for artifacts using independent component analysis (ICA) denoising. However, comparisons of processing pipelines have demonstrated that ICA is insufficient for removing motion-related artifact in functional connectivity estimates, unless combined with GSR (Ciric et al., 2017). We have previously demonstrated that GSR is effective in minimizing motion relationships with BOLD SD estimates (Millar et al., 2020). However, no studies have directly compared the impact of ICA and GSR on estimates of BOLD variability (cf., Ciric et al., 2017). Hence, it is unclear whether behavioral relationships may be influenced by the choice of denoising procedures.
Finally, although we demonstrated that controlling for age or CVH eliminates behavioral relationships with resting-state BOLD variability, these analyses were limited to cross-sectional relationships among these variables. Thus, although the results are consistent with proposals that vascular influences may contribute age-related cognitive decline (for review, see Abdelkarim et al., 2019; O’Brien et al., 2003; Wåhlin & Nyberg, 2019), we cannot assume that they reflect causal contributions to cognitive relationships, as they may be simply driven by accounting for shared variance among the measures. For instance, cross-sectionally controlling for other age-related variables, such as bone density, might similarly reduce the relationships. Hence, the sensitivity of these brain-behavior relationships to broader age- and vascular-related mechanisms should be further examined in longitudinal samples.
Conclusions
In summary, this study supports the proposal that BOLD variability is a behaviorally-sensitive signal. In particular, BOLD variability throughout a wide range of functional networks, including sensory, motor, and control networks, appears to be sensitive to performance on established measures of attentional control, and to some extent global cognitive measures as well. However, our results also suggest important dissociations between resting-state and task-driven BOLD variability. Specifically, behavioral relationships with resting-state BOLD variability were not maintained after correcting for age or estimates of CVH, suggesting that these relationships may be sensitive to more general mechanisms. In contrast, behavioral relationships with task-driven BOLD variability remained after correction for these factors, suggesting that variability during task performance might be uniquely sensitive to distinct sources of variance above and beyond age and/or CVH. Of course, we can only draw limited interpretations regarding the contributions of age and CVH given the cross-sectional design (Lindenberger, von Oertzen, Ghisletta, & Hertzog, 2011), but future longitudinal designs might test these contributions more formally.
Table 3.
Performance of SVR models (R2 statistic) predicting cognitive composite measures.
| Dataset | Cognitive Composite | SVR R2 (Uncorrected) | SVR R2 (Partial Age) | SVR R2 (Partial CVH) |
|---|---|---|---|---|
| Resting-State fMRI | Global | .045** | <.001 | .005 |
| Episodic Memory | .007 | .018 | .021 | |
| Attentional Control | .106*** | .002 | .007 | |
| Attentional Control (Corrected for Trails A) | .020^ | <.001 | <.001 | |
| Task-Driven fMRI | Global | .025 | .024 | .002 |
| Episodic Memory | .156 | .133 | .178 | |
| Attentional Control | .135** | .141** | .062* | |
| Attentional Control (Corrected for Trails A) | .141** | .139** | .093* |
Performance is presented for uncorrected models, as well as after statistically controlling for age and cardiovascular health (CVH) variables as covariates in BOLD SD estimates.
p < .05;
p < .01;
p < .001
Acknowledgements
This research was funded by grants from the National Institutes of Health (P01-AG026276, P01-AG03991, P50-AG05681, R01-MH118031, R01-AG052550, R01-AG057680, T32-AG000030-41, 1S10RR022984-01A1, 1S10OD018091-01, K01 AG053474), with generous support from the Paula and Rodger O. Riney Fund and the Daniel J. Brennan MD Fund. We thank the participants for their dedication to this project; the Knight ADRC Psychometric Core for data collection; Jan Duchek, Doug Garrett, Denise Head, and Steve Petersen for helpful comments; Jo Etzel for consultation on support vector regression analyses; Dimitre Tomov for technical and programming support; and Julie Wisch for data curation support.
Footnotes
Declaration of Interests
Similar analyses of relationships between resting-state BOLD SD and the global cognitive composite in a mostly-overlapping sample were recently reported in a manuscript in press at Cerebral Cortex (Millar et al., in press).
Although the correlations among attentional control estimates were relatively low compared to the global and episodic memory measures, this pattern is unsurprising since the attentional control tasks are based on difference scores, which are less reliable than point estimates (Lord, 1956). Thus, there should be a lower limit of expected correlations among the attentional control estimates than among the global or episodic memory measures, which were based on point estimates.
Visual examination of the CVH measures revealed that WMH estimates were highly skewed (see Figure 1C), and thus, cases in the tail of the distribution may disproportionately influence results when using WMH as a covariate. Thus, in addition to using the raw WMH volumes, we repeated the analyses using log-transformed WMH (Figure 1D) along with the other CVH covariates. Associations between BOLD variability and the cognitive composites were consistent for both the raw and log-transformed approaches (data not shown).
There were very strong correlations between estimates of BOLD SD derived from the complete usable timeseries and randomly selected frames (resting-state r’s ≥ .989; task-driven r’s ≥ .952) and between different random samples of frames (resting-state r’s ≥ .978; task-driven r’s ≥ .911). Thus, these randomly sampled frames are representative of variability present in the full timeseries.
The increased sensitivity of the task-driven variability estimates to head motion might be attributable to the ordering of the functional scans. Specifically, in most cases when resting-state and task-driven scans were performed in the same session, the resting-state scan preceded the task-driven scan. Thus, motion and its related artifacts might be more prominent in the task-driven scans due to greater participant fatigue.
By averaging the BOLD timeseries across voxels within each ROI, it is possible that variability in voxels that are out of phase will cancel each other out. Thus, in addition to the mean-based ROI approach, we also estimated variability in a concatenated timeseries of each individual voxel within the given ROIs. Regional variability estimates of the concatenated voxelwise ROI timeseries were very strongly correlated with variability estimates of the mean ROI timeseries for both resting-state (mean r = .979, range = .940 to .996) and task-driven estimates (mean r = .949, range = .874 to .990). Hence, variability captured in the averaged ROI timeseries is largely representative of variability in the individual voxels.
One possible reason for the inconsistency between the resting-state and task-driven relationships is a difference in the time intervals between the global cognitive composite measures and the separate fMRI sessions. Indeed, the interval between the psychometric battery and fMRI session was greater for the task session than it was for the resting-state session (t = 2.234, p = .026). Thus, the larger interval might introduce greater measurement error in any relationships between behavior and BOLD variability. Hence, for all cognitive composites, we additionally corrected for the signed interval between behavioral and fMRI sessions, which was standardized across resting-state and task-driven sessions, as a regressor of non-interest. All reliable behavioral relationships with resting-state and task-driven BOLD variability were consistent after controlling for the time interval.
Since we examined cognitive relationships with BOLD variability at the level of functional networks, it is possible that our results might be influenced by the set of ROIs and network assignment scheme. Thus, we additionally analyzed relationships with variability using an independent set of ROIs and network assignments (Shirer, Ryali, Rykhlevskaia, Menon, & Greicius, 2012). These results suggested that (i) correlations with cognitive measures were observed in corresponding networks between the two parcellations; (ii) SVR models identified consistent multivariate relationships with cognitive measures after controlling for age and CVH; and (iii) although there were some subtle differences in the multivariate network-level relationships identified using the two parcellation schemes, there was overall agreement that BOLD SD estimates in visual and visuospatial networks were particularly sensitive to attentional control estimates (data not shown). Hence, our primary conclusions from these analyses are supported by results using two independent network assignment schemes.
References
- Abdelkarim D, Zhao Y, Turner MP, Sivakolundu DK, Lu H, & Rypma B (2019). A neural-vascular complex of age-related changes in the human brain: Anatomy, physiology, and implications for neurocognitive aging. Neuroscience and Biobehavioral Reviews, 107(September), 927–944. 10.1016/j.neubiorev.2019.09.005 [DOI] [PubMed] [Google Scholar]
- Armitage SG (1946). An Analysis of Certain Psychological Tests Use for the Evaluation of Brain Injury. Psychological Monographs, 60(1), 1–48. [Google Scholar]
- Aschenbrenner AJ, Balota DA, Fagan AM, Duchek JM, Benzinger TLS, & Morris JC (2015). Alzheimer Disease Cerebrospinal Fluid Biomarkers Moderate Baseline Differences and Predict Longitudinal Change in Attentional Control and Episodic Memory Composites in the Adult Children Study. Journal of the International Neuropsychological Society, 21(08), 573–583. 10.1017/S1355617715000776 [DOI] [PMC free article] [PubMed] [Google Scholar]
- Aschenbrenner AJ, Gordon BA, Benzinger TLS, Morris JC, & Hassenstab JJ (2018). Influence of tau PET, amyloid PET, and hippocampal volume on cognition in Alzheimer disease. Neurology, 91(9), e859–e866. 10.1212/WNL.0000000000006075 [DOI] [PMC free article] [PubMed] [Google Scholar]
- Balota DA, & Duchek JM (2015). Attention, Variability, and Biomarkers in Alzheimer’s Disease In Remembering: Attributions, Processes, and Control in Human Memory (pp. 285–303). New York: Psychology Press. [Google Scholar]
- Bianciardi M, Fukunaga M, van Gelderen P, Horovitz SG, de Zwart JA, & Duyn JH (2009). Modulation of spontaneous fMRI activity in human visual cortex by behavioral state. NeuroImage, 45(1), 160–168. 10.1016/j.neuroimage.2008.10.034 [DOI] [PMC free article] [PubMed] [Google Scholar]
- Brier MR, Thomas JB, Snyder AZ, Benzinger TLS, Zhang D, Raichle ME, … Ances BM (2012). Loss of intranetwork and internetwork resting state functional connections with Alzheimer’s disease progression. The Journal of Neuroscience : The Official Journal of the Society for Neuroscience, 32(26), 8890–8899. 10.1523/JNEUROSCI.5698-11.2012 [DOI] [PMC free article] [PubMed] [Google Scholar]
- Burzynska AZ, Wong CN, Voss MW, Cooke GE, McAuley E, & Kramer AF (2015). White matter integrity supports BOLD signal variability and cognitive performance in the aging human brain. PLoS ONE, 10(4), 1–17. 10.1371/journal.pone.0120315 [DOI] [PMC free article] [PubMed] [Google Scholar]
- Castel AD, Balota DA, Hutchison KA, Logan JM, & Yap MJ (2007). Spatial attention and response control in healthy younger and older adults and individuals with Alzheimer’s disease: Evidence for disproportionate selection impairments in the simon task. Neuropsychology, 21(2), 170–182. 10.1037/0894-4105.21.2.170 [DOI] [PubMed] [Google Scholar]
- Ciric R, Wolf DH, Power JD, Roalf DR, Baum GL, Ruparel K, … Satterthwaite TD (2017). Benchmarking of participant-level confound regression strategies for the control of motion artifact in studies of functional connectivity. NeuroImage, 154(March), 174–187. 10.1016/j.neuroimage.2017.03.020 [DOI] [PMC free article] [PubMed] [Google Scholar]
- Clare Kelly AM, Uddin LQ, Biswal BB, Castellanos FX, & Milham MP (2008). Competition between functional brain networks mediates behavioral variability. NeuroImage, 39(1), 527–537. 10.1016/j.neuroimage.2007.08.008 [DOI] [PubMed] [Google Scholar]
- Corbetta M, & Shulman GL (2002). Control of Goal-Directed and Stimulus-Driven Attention in the Brain. Nature Reviews Neuroscience, 3(3), 215–229. 10.1038/nrn755 [DOI] [PubMed] [Google Scholar]
- Crossman ER, & Szafran J (1956). Changes with age in the speed of information-intake and discrimination. Experientia, (suppl 4), 128–134. [PubMed] [Google Scholar]
- Deco G, Jirsa VK, & McIntosh AR (2011). Emerging concepts for the dynamical organization of resting-state activity in the brain. Nature Reviews. Neuroscience, 12(1), 43–56. 10.1038/nrn2961 [DOI] [PubMed] [Google Scholar]
- Dosenbach NUF, Fair DA, Cohen AL, Schlaggar BL, & Petersen SE (2008). A dual-networks architecture of top-down control. Trends in Cognitive Sciences, 12(3), 99–105. 10.1016/j.tics.2008.01.001 [DOI] [PMC free article] [PubMed] [Google Scholar]
- Dosenbach NUF, Nardos B, Cohen AL, Fair DA, Power JD, Church J. a, … Schlaggar BL (2010). Prediction of Individual Brain Maturity Using fMRI. Science, 329(5997), 1358–1361. 10.1126/science.1194144.Prediction [DOI] [PMC free article] [PubMed] [Google Scholar]
- Duchek JM, Balota DA, Thomas JB, Snyder AZ, Rich P, Benzinger TLS, … Ances BM (2013). Relationship between Stroop performance and resting state functional connectivity in cognitively normal older adults. Neuropsychology, 27(5), 516–528. 10.1037/a0033402 [DOI] [PMC free article] [PubMed] [Google Scholar]
- Fair DA, Schlaggar BL, Cohen AL, Miezin FM, Dosenbach NUF, Wenger KK, … Petersen SE (2007). A method for using blocked and event-related fMRI data to study “resting state” functional connectivity. NeuroImage, 35(1), 396–405. 10.1016/j.neuroimage.2006.11.051 [DOI] [PMC free article] [PubMed] [Google Scholar]
- Faust ME, Balota DA, Spieler DH, & Ferraro FR (1999). Individual differences in information-processing rate and amount: implications for group differences in response latency. Psychological Bulletin, 125(6), 777–799. 10.1037/0033-2909.125.6.777 [DOI] [PubMed] [Google Scholar]
- Fischl B (2012). FreeSurfer. Neuroimage2, 62(2), 774–781. 10.1016/j.neuroimage.2012.01.021.FreeSurfer [DOI] [PMC free article] [PubMed] [Google Scholar]
- Fox MD, & Raichle ME (2007). Spontaneous fluctuations in brain activity observed with functional magnetic resonance imaging. Nat Rev Neurosci, 8(9), 700–711. 10.1038/nrn2201 [DOI] [PubMed] [Google Scholar]
- Fox MD, Zhang D, Snyder AZ, & Raichle ME (2009). The global signal and observed anticorrelated resting state brain networks. Journal of Neurophysiology, 101(6), 3270–3283. 10.1152/jn.90777.2008 [DOI] [PMC free article] [PubMed] [Google Scholar]
- Fransson P (2006). How default is the default mode of brain function?. Further evidence from intrinsic BOLD signal fluctuations. Neuropsychologia, 44(14), 2836–2845. 10.1016/j.neuropsychologia.2006.06.017 [DOI] [PubMed] [Google Scholar]
- Garrett DD, Epp SM, Perry A, & Lindenberger U (2018). Local temporal variability reflects functional integration in the human brain. NeuroImage, 183(March), 776–787. 10.1016/j.neuroimage.2018.08.019 [DOI] [PubMed] [Google Scholar]
- Garrett DD, Kovacevic N, McIntosh AR, & Grady CL (2010). Blood oxygen level-dependent signal variability is more than just noise. The Journal of Neuroscience : The Official Journal of the Society for Neuroscience, 30(14), 4914–4921. 10.1523/JNEUROSCI.5166-09.2010 [DOI] [PMC free article] [PubMed] [Google Scholar]
- Garrett DD, Kovacevic N, McIntosh AR, & Grady CL (2011). The importance of being variable. The Journal of Neuroscience, 31(12), 4496–4503. 10.1523/JNEUROSCI.5641-10.2011 [DOI] [PMC free article] [PubMed] [Google Scholar]
- Garrett DD, Kovacevic N, McIntosh AR, & Grady CL (2013). The modulation of BOLD variability between cognitive states varies by age and processing speed. Cerebral Cortex, 23(3), 684–693. 10.1093/cercor/bhs055 [DOI] [PMC free article] [PubMed] [Google Scholar]
- Garrett DD, Lindenberger U, Hoge RD, & Gauthier CJ (2017). Age differences in brain signal variability are robust to multiple vascular controls. Scientific Reports, 7(1), 1–13. 10.1038/s41598-017-09752-7 [DOI] [PMC free article] [PubMed] [Google Scholar]
- Garrett DD, McIntosh AR, & Grady CL (2014). Brain signal variability is parametrically modifiable. Cerebral Cortex, 24(11), 2931–2940. 10.1093/cercor/bht150 [DOI] [PMC free article] [PubMed] [Google Scholar]
- Garrett DD, Nagel IE, Preuschhof C, Burzynska AZ, Marchner J, Wiegert S, … Lindenberger U (2015). Amphetamine modulates brain signal variability and working memory in younger and older adults. Proceedings of the National Academy of Sciences of the United States of America, 112(24), 7593–7598. 10.1073/pnas.1504090112 [DOI] [PMC free article] [PubMed] [Google Scholar]
- Garrett DD, Samanez-Larkin GR, MacDonald SWS, Lindenberger U, McIntosh AR, & Grady CL (2013). Moment-to-moment brain signal variability: A next frontier in human brain mapping? Neuroscience and Biobehavioral Reviews, 37(4), 610–624. 10.1016/j.neubiorev.2013.02.015 [DOI] [PMC free article] [PubMed] [Google Scholar]
- Goodglass H, & Kaplan E (1983). Boston Diagnostic Aphasia Examination Booklet, III: Oral Expression: Animal Naming (Fluency in Controlled Association). Philadelphia: Lea & Febiger. [Google Scholar]
- Gordon BA, Zacks JM, Blazey T, Benzinger TLS, Morris JC, Fagan AM, … Balota DA (2015). Task-evoked fMRI changes in attention networks are associated with preclinical Alzheimer’s disease biomarkers. Neurobiology of Aging, 36(5), 1771–1779. 10.1016/j.neurobiolaging.2015.01.019 [DOI] [PMC free article] [PubMed] [Google Scholar]
- Grady CL, & Garrett DD (2014). Understanding variability in the BOLD signal and why it matters for aging. Brain Imaging and Behavior, 8(2), 274–283. 10.1007/s11682-013-9253-0 [DOI] [PMC free article] [PubMed] [Google Scholar]
- Grady CL, & Garrett DD (2018). Accepted Manuscript: Brain signal variability is modulated as a function of internal and external demand in younger and older adults. NeuroImage, 169, 510–523. 10.1016/j.neuroimage.2017.12.031 [DOI] [PubMed] [Google Scholar]
- Gratton C, Laumann TO, Nielsen AN, Greene DJ, Gordon EM, Gilmore AW, … Petersen SE (2018). Functional Brain Networks Are Dominated by Stable Group and Individual Factors, Not Cognitive or Daily Variation. Neuron, 98(2), 439–452.e5. 10.1016/j.neuron.2018.03.035 [DOI] [PMC free article] [PubMed] [Google Scholar]
- Grober E, Buschke H, Crystal H, Bang S, & Dresner R (1988). Screening for dementia by memory testing. Neurology, 38(June), 900–903. 10.1212/WNL.38.6.900 [DOI] [PubMed] [Google Scholar]
- Guitart-Masip M, Salami A, Garrett DD, Rieckmann A, Lindenberger U, & Bäckman L (2016). BOLD Variability is Related to Dopaminergic Neurotransmission and Cognitive Aging. Cerebral Cortex, 26(5), 2074–2083. 10.1093/cercor/bhv029 [DOI] [PubMed] [Google Scholar]
- He BJ (2011). Scale-Free Properties of the Functional Magnetic Resonance Imaging Signal during Rest and Task. Journal of Neuroscience, 31(39), 13786–13795. 10.1523/JNEUROSCI.2111-11.2011 [DOI] [PMC free article] [PubMed] [Google Scholar]
- He BJ (2013). Spontaneous and Task-Evoked Brain Activity Negatively Interact. Journal of Neuroscience, 33(11), 4672–4682. 10.1523/JNEUROSCI.2922-12.2013 [DOI] [PMC free article] [PubMed] [Google Scholar]
- Honey CJ, Kötter R, Breakspear M, & Sporns O (2007). Network structure of cerebral cortex shapes functional connectivity on multiple time scales. Proceedings of the National Academy of Sciences, 104(24), 10240–10245. 10.1073/pnas.0701519104 [DOI] [PMC free article] [PubMed] [Google Scholar]
- Hu S, Chao HHA, Zhang S, Ide JS, & Li CSR (2014). Changes in cerebral morphometry and amplitude of low-frequency fluctuations of BOLD signals during healthy aging: Correlation with inhibitory control. Brain Structure and Function, 219(3), 983–994. 10.1007/s00429-013-0548-0 [DOI] [PMC free article] [PubMed] [Google Scholar]
- Huff MJ, Balota DA, Minear M, Aschenbrenner AJ, & Duchek JM (2015). Dissociative Global and Local Task-Switching Costs Across Younger Adults , Middle-Aged Adults , Older Adults , and Very Mild Alzheimer ‘s Disease Individuals. Psychology and Aging, 30(4), 727–739. [DOI] [PMC free article] [PubMed] [Google Scholar]
- Kielar A, Deschamps T, Chu RKO, Jokel R, Khatamian YB, Chen JJ, & Meltzer JA (2016). Identifying dysfunctional cortex: Dissociable effects of stroke and aging on resting state dynamics in MEG and fmri. Frontiers in Aging Neuroscience, 8(MAR), 1–22. 10.3389/fnagi.2016.00040 [DOI] [PMC free article] [PubMed] [Google Scholar]
- Lindenberger U, von Oertzen T, Ghisletta P, & Hertzog C (2011). Cross-Sectional Age Variance Extraction: What’s Change Got To Do With It? Psychology and Aging, 26(1), 34–47. 10.1037/a0020525 [DOI] [PubMed] [Google Scholar]
- Lord FM (1956). The Measurement of Growth. ETS Research Bulletin series. [Google Scholar]
- Ma WJ, Beck JM, Latham PE, & Pouget A (2006). Bayesian inference with probabilistic population codes. Nature Neuroscience, 9(11), 1432–1438. 10.1038/nn1790 [DOI] [PubMed] [Google Scholar]
- Meeker KL, Ances BM, Gordon BA, Rudolph CW, Luckett P, Balota DA, … Waring JD (2020). Effects of CSF Aβ42 on Brain Functional Network Dynamics and Cognitive Intra-Individual Variability. Manuscript under Revision. [Google Scholar]
- Mennes M, Zuo X-N, Clare Kelly AM, Di Martino A, Zang YF, Biswal BB, … Milham MP (2011). Linking inter-individual differences in neural activation and behavior to intrinsic brain dynamics. NeuroImage, 54(4), 2950–2959. 10.1016/j.neuroimage.2010.10.046 [DOI] [PMC free article] [PubMed] [Google Scholar]
- Meyer D, Dimitriadou E, Hornik K, Weingessel A, Leisch F, Chang C-C, & Lin C-C (2017). Misc Functions of the Department of Statistics, Probability Theory Group (E1071), TUWien. The Comprehensive R Archive Network. Retrieved from https://cran.r-project.org/web/packages/e1071/e1071.pdf [Google Scholar]
- Millar PR, Petersen SE, Ances BM, Gordon BA, Benzinger TLS, Morris JC, & Balota DA (2020). Evaluating the sensitivity of resting-state BOLD variability to age and cognition after controlling for motion and cardiovascular influences: A network-based approach. Cerebral Cortex, (00), 1–16. 10.1093/cercor/bhaa138 [DOI] [PMC free article] [PubMed] [Google Scholar]
- Morris JC (1993). The Clinical Dementia Rating (CDR): current version and scoring rules. Neurology, 43(11), 2412–2414. [DOI] [PubMed] [Google Scholar]
- Myerson J, Hale S, Wagstaff D, Poon LW, & Smith GA (1990). The Information-Loss Model: A Mathematical Theory of Age-Related Cognitive Slowing. Psychological Review, 97(4), 475–487. 10.1037/0033-295X.97.4.475 [DOI] [PubMed] [Google Scholar]
- Nielsen AN, Barch DM, Petersen SE, Schlaggar BL, & Greene DJ (2019). Machine Learning with Neuroimaging: Evaluating its Applications in Psychiatry. Biological Psychiatry: Cognitive Neuroscience and Neuroimaging. 10.1016/j.bpsc.2019.11.007 [DOI] [PMC free article] [PubMed] [Google Scholar]
- Nielsen AN, Greene DJ, Gratton C, Dosenbach NUF, Petersen SE, & Schlaggar BL (2019). Evaluating the Prediction of Brain Maturity From Functional Connectivity After Motion Artifact Denoising. Cerebral Cortex, 29(6), 2455–2469. 10.1093/cercor/bhy117 [DOI] [PMC free article] [PubMed] [Google Scholar]
- Nomi JS, Bolt TS, Ezie CEC, Uddin LQ, & Heller AS (2017). Moment-to-Moment BOLD Signal Variability Reflects Regional Changes in Neural Flexibility across the Lifespan. The Journal of Neuroscience, 37(22), 5539–5548. 10.1523/JNEUROSCI.3408-16.2017 [DOI] [PMC free article] [PubMed] [Google Scholar]
- O’Brien JT, Erkinjuntti T, Reisberg B, Roman G, Sawada T, Pantoni L, … DeKosky ST (2003). Vascular cognitive impairment. Lancet Neurology, 2(2), 89–98. 10.1016/S1474-4422(03)00305-3 [DOI] [PubMed] [Google Scholar]
- Power JD, Barnes KA, Snyder AZ, Schlaggar BL, & Petersen SE (2012). Spurious but systematic correlations in functional connectivity MRI networks arise from subject motion. NeuroImage, 59(3), 2142–2154. 10.1016/j.neuroimage.2011.10.018 [DOI] [PMC free article] [PubMed] [Google Scholar]
- Power JD, Cohen AL, Nelson SM, Wig GS, Barnes KA, Church J. a., … Petersen SE (2011). Functional Network Organization of the Human Brain. Neuron, 72(4), 665–678. 10.1016/j.neuron.2011.09.006 [DOI] [PMC free article] [PubMed] [Google Scholar]
- Salthouse TA (1996). The processing-speed theory of adult age differences in cognition. Psychological Review, 103(3), 403–428. 10.1037/0033-295X.103.3.403 [DOI] [PubMed] [Google Scholar]
- Schmidt P, Gaser C, Arsic M, Buck D, Förschler A, Berthele A, … Mühlau M (2012). An automated tool for detection of FLAIR-hyperintense white-matter lesions in Multiple Sclerosis. NeuroImage, 59(4), 3774–3783. 10.1016/j.neuroimage.2011.11.032 [DOI] [PubMed] [Google Scholar]
- Seitzman BA, Gratton C, Marek S, Raut RV, Dosenbach NUF, Schlaggar BL, … Greene DJ (2020). A set of functionally-defined brain regions with improved representation of the subcortex and cerebellum. NeuroImage, 206(116290), 1–17. 10.1016/j.neuroimage.2019.116290 [DOI] [PMC free article] [PubMed] [Google Scholar]
- Shirer WR, Ryali S, Rykhlevskaia E, Menon V, & Greicius MD (2012). Decoding subject-driven cognitive states with whole-brain connectivity patterns. Cerebral Cortex, 22(1), 158–165. 10.1093/cercor/bhr099 [DOI] [PMC free article] [PubMed] [Google Scholar]
- Shulman GL, Pope DLW, Astafiev SV, McAvoy MP, Snyder AZ, & Corbetta M (2010). Right hemisphere dominance during spatial selective attention and target detection occurs outside the dorsal frontoparietal network. Journal of Neuroscience, 30(10), 3640–3651. 10.1523/JNEUROSCI.4085-09.2010 [DOI] [PMC free article] [PubMed] [Google Scholar]
- Simon JR (1969). Reactions toward the source of stimulation. Journal of Experimental Psychology, 81(1), 174–176. 10.1037/h0027448 [DOI] [PubMed] [Google Scholar]
- Spieler DH, Balota DA, & Faust ME (1996). Stroop Performance in Healthy Younger and Older Adults and in Individuals With Dementia of the Alzheimer’s Type. Journal of Experimental Psychology: Human Perception and Performancestroop, 22(2), 461–479. [DOI] [PubMed] [Google Scholar]
- Stroop JR (1935). Studies of interference in serial verbal reactions. Journal of Experimental Psychology, 18(6), 643–662. 10.1037/h0054651 [DOI] [Google Scholar]
- Tsvetanov KA, Henson RNA, Tyler LK, Davis SW, Shafto MA, Taylor JR, … Rowe JB (2015). The effect of ageing on fMRI: Correction for the confounding effects of vascular reactivity evaluated by joint fMRI and MEG in 335 adults. Human Brain Mapping, 36(6), 2248–2269. 10.1002/hbm.22768 [DOI] [PMC free article] [PubMed] [Google Scholar]
- Tsvetanov KA, Henson RN, Jones PS, Mutsaerts H-J, Fuhrmann D, Tyler LK, … Rowe JB (2019). The effects of age on resting-state BOLD signal variability is explained by cardiovascular and neurovascular factors. BioRxiv, 836619. [DOI] [PMC free article] [PubMed] [Google Scholar]
- Wåhlin A, & Nyberg LH (2019). At the Heart of Cognitive Functioning in Aging. Trends in Cognitive Sciences, 23(9), 717–720. 10.1016/j.tics.2019.06.004 [DOI] [PubMed] [Google Scholar]
- Wechsler D (1987). WMS-R: Wechler Memory Scale-Revised: Manual. Psychological Corporation. [Google Scholar]
- Wechsler D (1997). WAIS-III: Administration and Scoring Manual: Wechsler Adult Intelligence Scale. Psychological Corporation. [Google Scholar]
- Wechsler D, & Stone CP (1973). Manual: Wechsler memory scale. New York: Psychological Corporation. [Google Scholar]
- Wolf D, Zschutschke L, Scheurich A, Schmitz F, Lieb K, Tüscher O, & Fellgiebel A (2014). Age-related increases in stroop interference: Delineation of general slowing based on behavioral and white matter analyses. Human Brain Mapping, 35(5), 2448–2458. 10.1002/hbm.22340 [DOI] [PMC free article] [PubMed] [Google Scholar]
- Zhang P-W, Qu X-J, Qian S-F, Wang X-B, Wang R-D, Li Q-Y, … Liu D-Q (2018). Distinction Between Variability-Based Modulation and Mean-Based Activation Revealed by BOLD-fMRI and Eyes-Open/Eyes-Closed Contrast. Frontiers in Neuroscience, 12(July), 1–9. 10.3389/fnins.2018.00516 [DOI] [PMC free article] [PubMed] [Google Scholar]