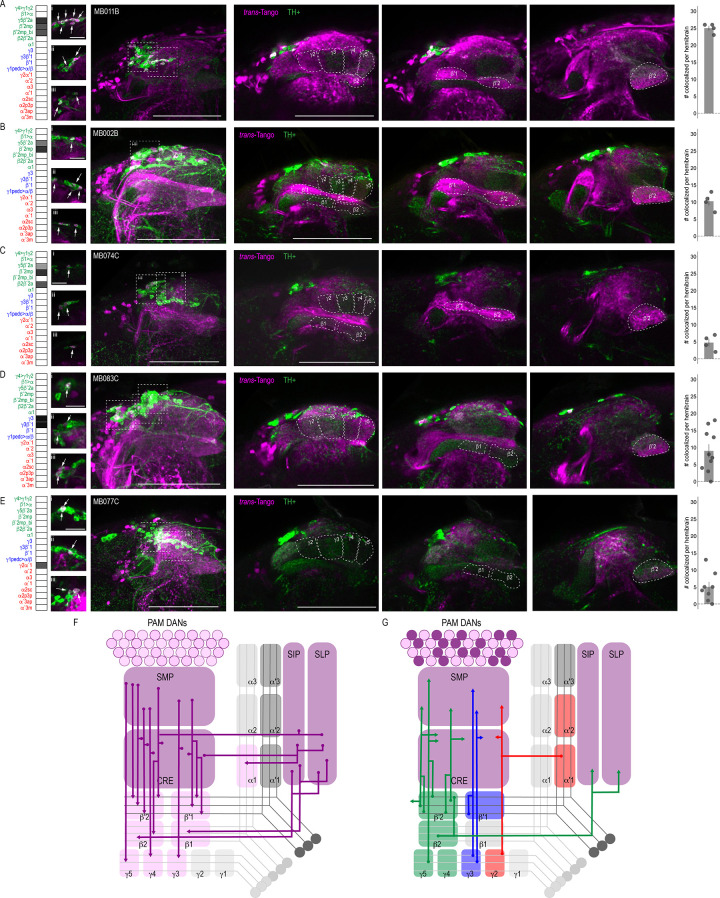
Figure 3. DANs postsynaptic to MBONs.
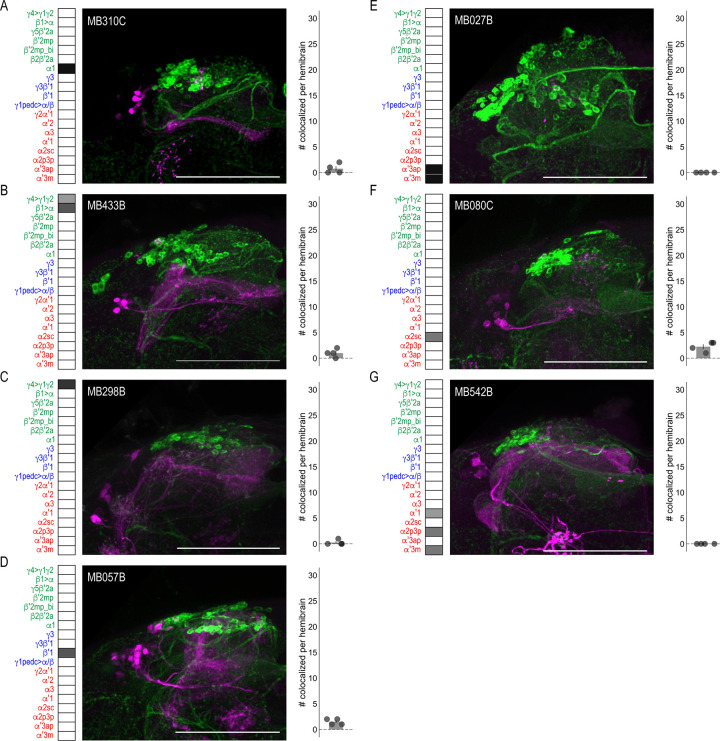
Exemplar max-stacks of MBON lines in which TH+ cells overlapped with postsynaptic signal of glutamatergic (A) MBON γ5β′2a, β′2mp, β′2mp_bilateral (MB011B), (B) MBON γ5β′2a, β′2mp (MB002B), (C) MBON γ5β′2a, β′2mp, β2β′2a (MB074C), (D) GABAergic MBONs γ3, γ3β′1 (MB083C) and (E) cholinergic MBONs γ2α′1 (MB077C). Overlapping TH+ and trans-Tango cell bodies are highlighted in insets, scale bar = 10 μm. Max stacks of MB are included (Column I), scale bar = 50 μm. Column II-IV depict single optical planes from anterior to posterior outlining MB compartments. Bar graphs indicate the average number of co-localized cells per hemibrain (mean +/- standard error). Green, TH-positive cells; magenta, postsynaptic trans-Tango signal. MBON maps are organized by neurotransmitter type: green=glutamatergic, blue=GABAergic, red=cholinergic. (F) Schematic depicting the MB innervation by PAM DANs. PAM DANs extend dendrites to SMP, CRE, SIP, and SLP. (G) Schematic depicting the MBONs that synapse on TH+ cells.


