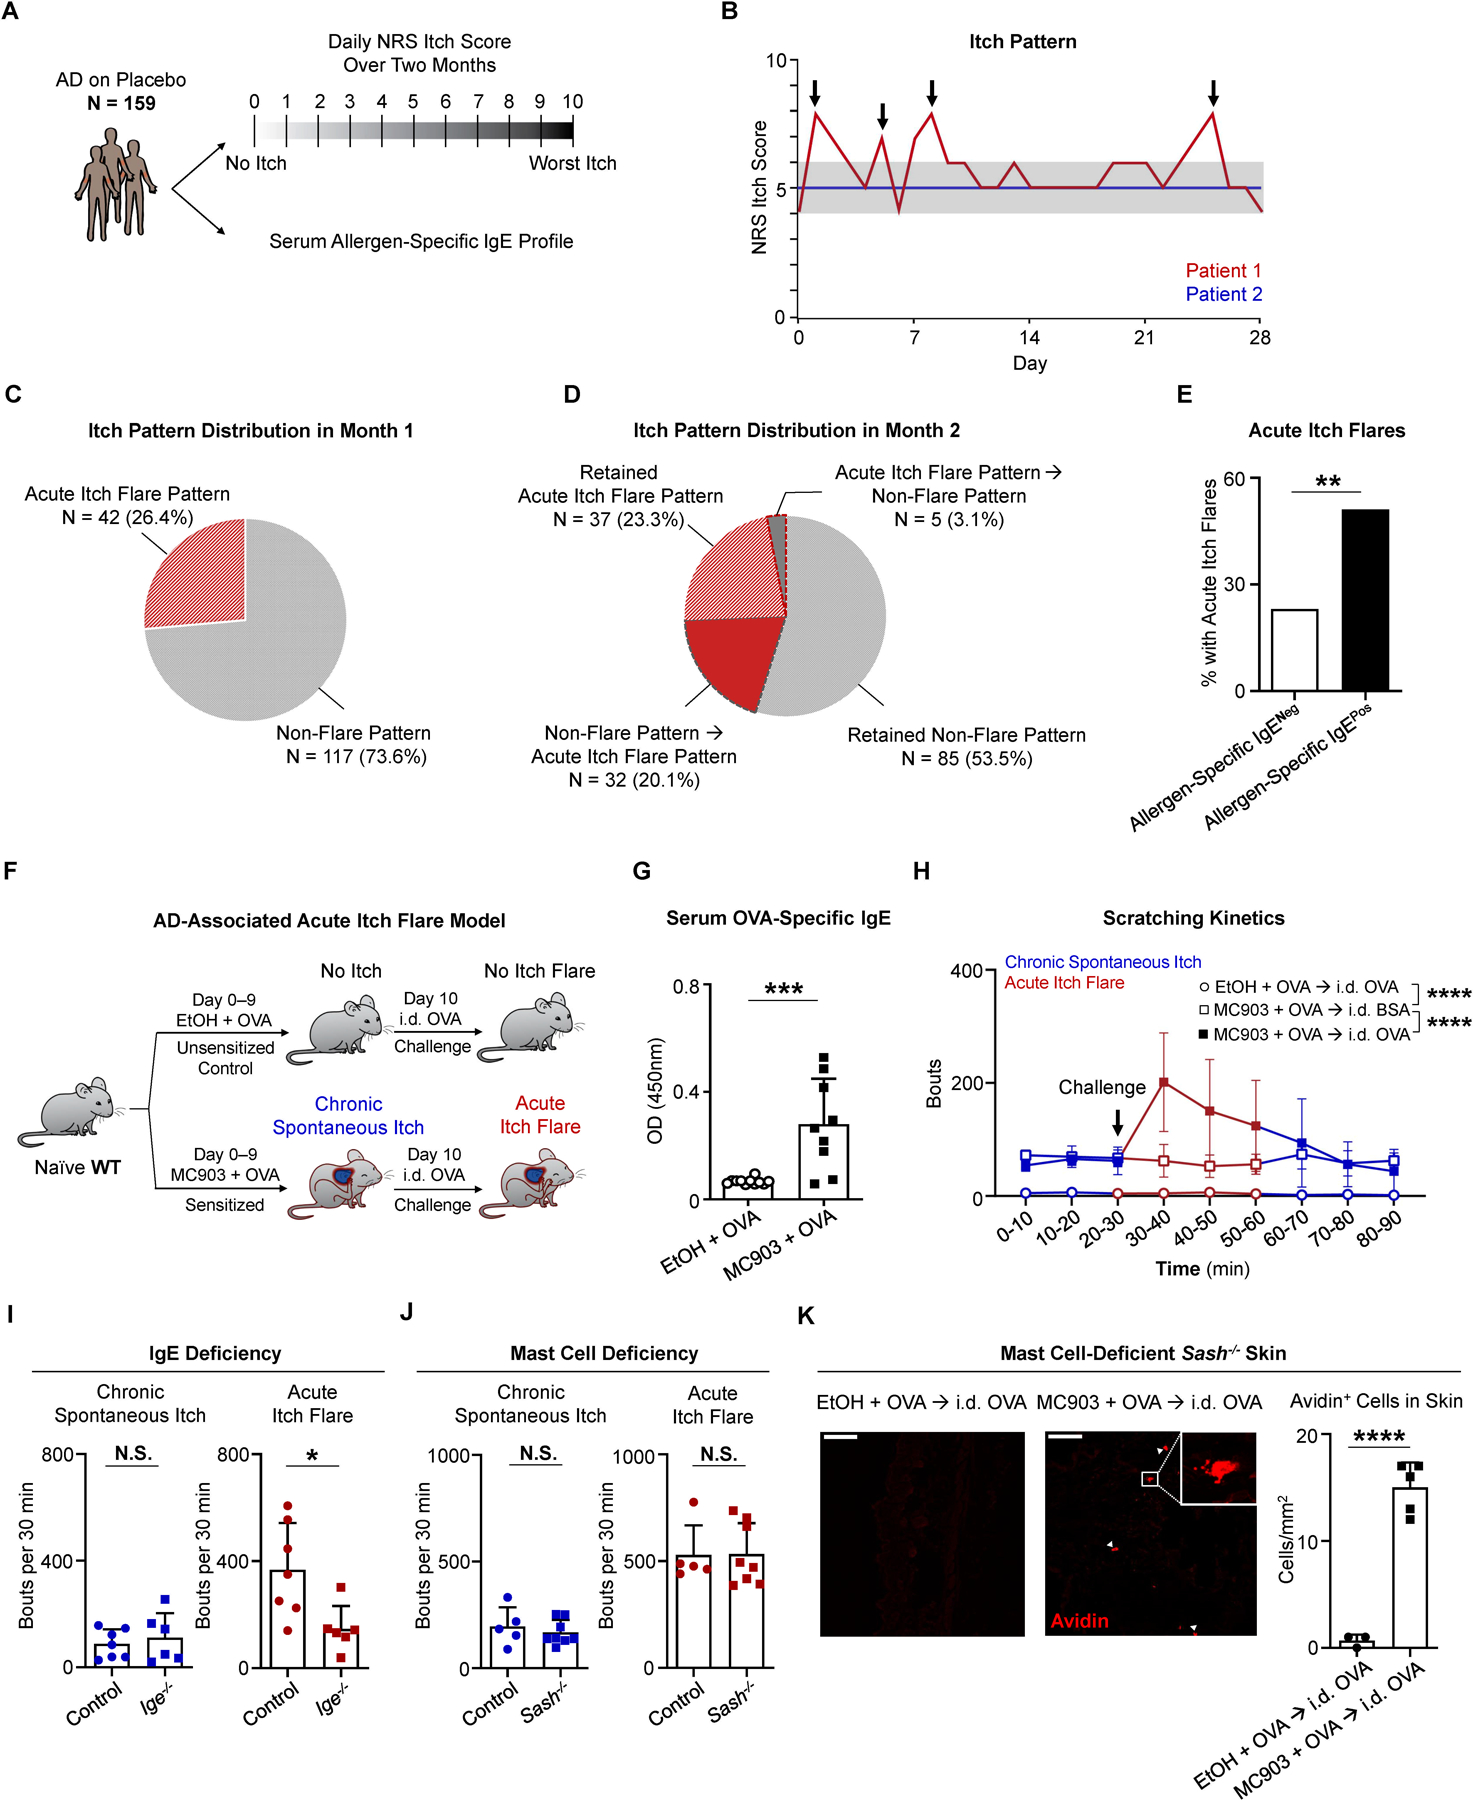
Figure 1. Acute Itch Flares Are Associated with Allergen-Specific IgE in Human AD and Mast Cell-Independent in Murine AD-Like Disease.

(A) Schematic of post hoc analysis of phase 3 clinical trial data from a cohort of placebo-treated patients with atopic dermatitis (AD, N = 159). For each patient, the daily numerical rating scale (NRS) itch scores over a two-month period and the serum allergen-specific IgE repertoire were assessed.
(B) Itch patterns from two representative individuals. Patient 1 (red line) has an acute itch flare pattern due to the presence of at least one acute itch flare (indicated by arrows). Patient 2 (blue line) has a non-flare itch pattern due to a lack of apparent itch flares. Gray shading highlights 2-point threshold above baseline for patient 1.
(C) Pie chart depicting the percentage (%) of patients with an acute itch flare or non-flare pattern in the first month.
(D) Pie chart depicting the percentage (%) of patients with various itch patterns in month 2. Wedges outlined by dotted lines represent patients whose itch pattern changed from month 1 to month 2.
(E) Frequency of patients who exhibited acute itch flares over the 2-month observation period out of all patients that tested positive for allergen-specific IgE (black bar, N = 68/133) and out of all patients that tested negative (White bar, N = 6/26). **p < 0.01 by Chi-square test.
(F) Schematic of the AD-associated acute itch flare model. Calcipotriol (MC903) + ovalbumin (OVA)-treated (sensitized; from day 0 to day 9) or ethanol (EtOH) + OVA-treated (unsensitized control; from day 0 to day 9) wild-type (WT) mice received an intradermal (i.d.) injection of OVA into adjacent non-lesional cheek skin on day 10. Prior to and following i.d. OVA challenge, chronic spontaneous itch and acute itch flares were recorded, respectively.
(G) ELISA quantification of OVA-specific IgE in the serum of MC903 + OVA-treated and EtOH + OVA-treated WT mice on day 10 of the AD-associated acute itch flare model. n = 9–11 mice per group. ***p < 0.001 by unpaired Student’s t-test.
(H) Number of scratching bouts in 10-minute (min) intervals prior to and following i.d. allergen (OVA or bovine serum albumin [BSA]) challenge on day 10 of the AD-associated acute itch flare model. Unsensitized (EtOH + OVA) mice were challenged with i.d. OVA (open circle) and sensitized (MC903 + OVA) mice were challenged with i.d. OVA (closed square) or i.d. BSA (open square). Blue line indicates chronic spontaneous itch and red line indicates acute itch flares. n = 7 mice per group. ****p < 0.0001 by Two-way ANOVA test.
(I) Number of scratching bouts in littermate control and Ige−/− mice prior to i.d. OVA challenge (chronic spontaneous itch; left) and following i.d. OVA challenge (acute itch flares; right) on day 10 of the AD-associated acute itch flare model. n = 6–7 mice per group. N.S., not significant, *p < 0.05 by unpaired Student’s t-test.
(J) Number of scratching bouts in littermate control and mast cell-deficient Sash−/− mice prior to i.d. OVA challenge (chronic spontaneous itch; left) and following i.d. OVA challenge (acute itch flares; right) on day 10 of the AD-associated acute itch flare model. n = 5–8 mice per group. N.S., not significant by unpaired Student’s t-test.
(K) Representative images of i.d. OVA-challenged skin sections stained with avidin-Texas Red (TRITC) in unsensitized (EtOH + OVA) or sensitized (MC903 + OVA) mast cell-deficient Sash−/− mice and the number of avidin positive cells quantified per square millimeter from each treatment group. White arrows indicate positively stained cells. White square indicates zoomed view of an avidin positive cell. Scale bar, 50µm. n = 3–5 mice per group. ****p < 0.0001 by unpaired Student’s t-test.
Data are represented as mean ± SD.
See also Figure S1.
