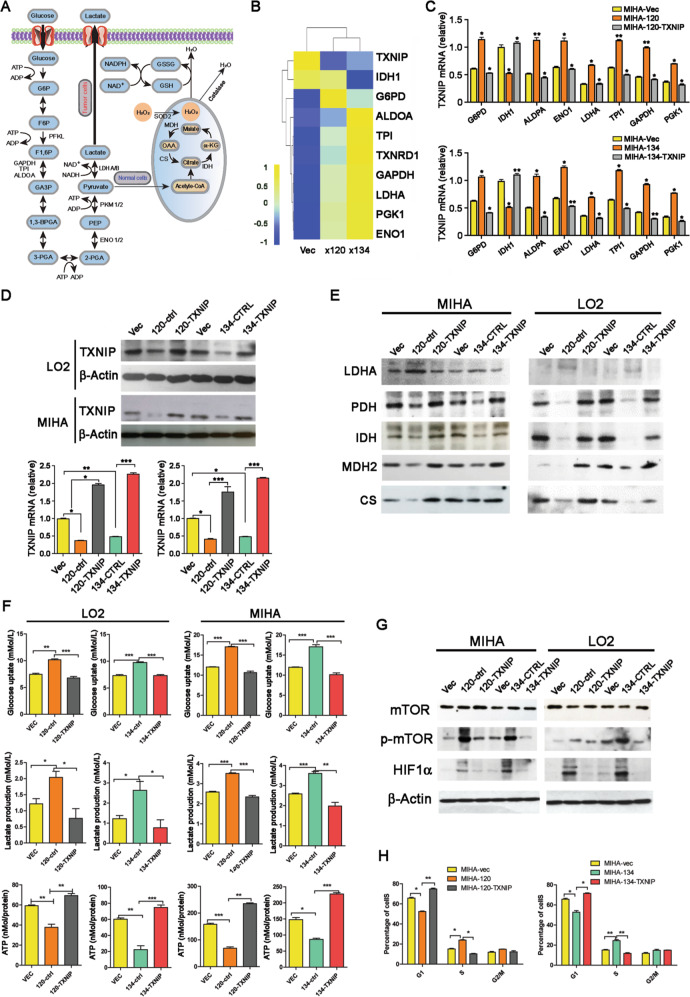
Fig. 5. TXNIP induced glucose metabolism reprogramming from glycolysis to mitochondrial respiration.
A Schematic representation of the biological process of glucose metabolism in normal cells and cancer cells. B Heatmap showing the relative expression level of several genes involved in glucose metabolism in Ct-HBx and vectors containing samples as indicated by RNA sequencing, each matrix representing the relative expression level of an individual gene, high and low expression are indicated by yellow and blue color. C The expression level of the gene panel indicated above was validated by qRT-PCR in MIHA cells transduced with truncated HBx mutants compared with vector group, also the expression was further compared after re-introduction of TXNIP into Ct-HBx expressing cells. D Re-introduction of TXNIP into Ct-HBx (HBx-120, HBx-134) expressing cells was confirmed at the protein and genomic level by western blotting and qRT-PCR. E The expression level of several key enzymes and molecules participated in glycolysis and Krebs cycle are determined by western blotting. The expression of internal reference ß-actin can be referred to in Fig. 5d. F Level of glucose uptake, lactate secretion, and relative ATP production activity were compared among vector, Ct-HBx as well as TXNIP overexpression samples. G The activation of the mTOR-HIF1α axis was detected by western blotting, ß-actin was used as an internal reference. H Analysis of cell distribution in each stage of the cell cycle in each transfected MIHA cells.

