Abstract
Activation of nociceptor sensory neurons by noxious stimuli both triggers pain and increases capillary permeability and blood flow to produce neurogenic inflammation1,2, but whether nociceptors also interact with the immune system remains poorly understood. Here we report a neurotechnology for selective epineural optogenetic neuromodulation of nociceptors and demonstrate that nociceptor activation drives both protective pain behavior and inflammation. The wireless optoelectronic system consists of sub-millimeter-scale light-emitting diodes embedded in a soft, circumneural sciatic nerve implant, powered and driven by a miniaturized head-mounted control unit. Photostimulation of axons in freely moving mice that express channelrhodopsin only in nociceptors resulted in behaviors characteristic of pain, reflecting orthodromic input to the spinal cord. It also led to immune reactions in the skin in the absence of inflammation and potentiation of established inflammation, a consequence of the antidromic activation of nociceptor peripheral terminals. These results reveal a link between nociceptors and immune cells, which may have implications for the treatment of inflammation.
There are multiple and distinct highly specialized sets of sensory neurons in the peripheral nervous system (PNS) that provide information on the stimuli impinging on and within the body3. We can now assess exactly what functional role each class of sensory neurons has by directing light to selectively activate or inhibit neurons genetically targeted with a light sensitive protein4,5.
In the past decade, multiple approaches for optical stimulation of neurons have been proposed, mainly focused on the brain7. Optogenetic activation of peripheral axons has specific challenges, related to the nerve’s anatomy, softness, local motion and opacity. However, progress in both miniaturization7 and mechanically soft materials8–10 support development of implantable optical and optoelectronic systems for the PNS. Current interfaces rely either on optic fibers11 or light-emitting diodes12 (LEDs), with either tethered or radio-frequency (RF) power and control10,13. Wireless and closed-loop designs also open opportunities for integration of optical stimulation with a second neuromodulation modality (e.g. pharmacological)9 or recording capability10.
Wireless modulation of neural activity is paramount to enable long-term and optimal behavioral studies in unrestrained animal models14. There are two main approaches, either battery-based or battery-free systems, which are head-mounted or fully implantable, respectively. Their selection arises from the nature of the experimental conditions under study and the tradeoff between greater power and data transmission efficiency to and out of the implantable system and enabling the most natural environment for the animal under study. Battery-based systems wire-connect the neural transducers to supporting electronics and a battery in an ultracompact head-stage. This leverages advances in system-on-chip electronics, constant power supply via an on-board battery and meter-wide wireless communication via e.g. Bluetooth protocols, but imposes the need for an external device on the head of the animal15,16. Battery-less, fully implantable systems rely on delivery of both power and control signals by inductive coupling through the skin. This attractive solution allows for minimal manipulation of the animal model post-surgery and over time8,13. A receiving antenna and energy storing capacitors are required to harvest and store power, both with geometrical constraints related to electrical demands and the animal size. Battery-free, fully implantable systems are therefore limited by the size of the implantable components and available cages with integrated transmitting antennas13, operating distances, and potential dead spots that impose a time limit before stored energy is depleted.
Physiological pain is a protective mechanism that informs us of the presence of potentially tissue damaging or noxious stimuli as an early warning system. Pain arises from the activation of nociceptors, which are widely distributed in the skin and other organs17. If tissue injury or infection occurs, the immune system is activated and produces innate and adaptive inflammatory responses to restore homeostasis. Cytokines and chemokines produced by immune cells during inflammation act on nociceptors to reduce their threshold and increase their sensitivity to stimuli, contributing to inflammatory pain hypersensitivity18,19. Whether a reciprocal interaction occurs, with nociceptors acting on immune cells such that noxious stimulation leads to immune activation is not known. Peptidergic nociceptors have a “motor” role mediated by the release, when activated, of neuropeptides from their peripheral terminals in a calcium influx dependent manner20. The effects of calcitonin gene related peptide and substance P release from peripheral terminals was long thought to be restricted to vasodilation and increased capillary permeability, producing the erythema and edema characteristic of neurogenic inflammation2,21. However, neuropeptide mediated signaling from sensory neurons to immune cells constitutes a potential means for the nervous system to also modify immune function, both suppressing pathogen-induced and activating allergic/psoriasiform immune activity22–24.
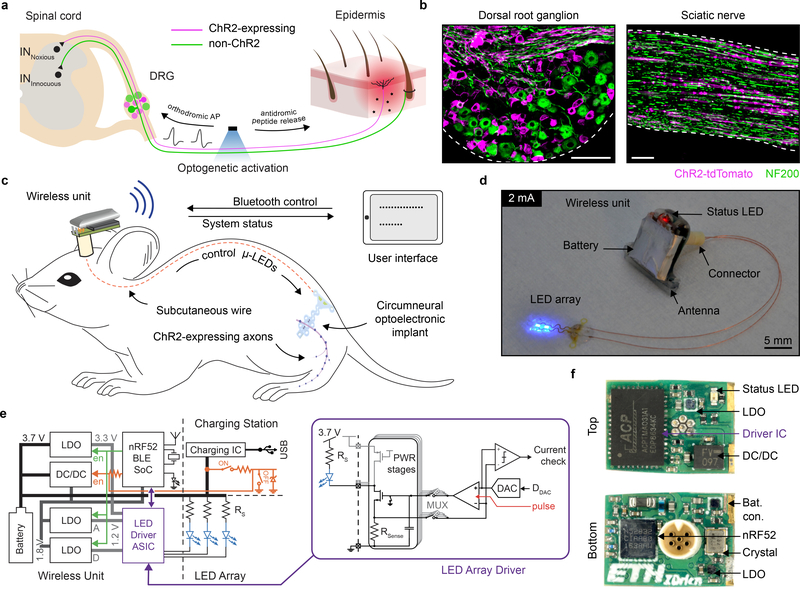
To tease out if activity evoked in nociceptors is sufficient by itself to induce inflammation, we needed a neurotechnology that incorporates nociceptor gene targeted expression of a light sensitive protein and an implantable light delivery system to selectively only activate nociceptor axons in peripheral nerves (Fig. 1a). To enable wireless, programmable and chronic modulation of these peripheral nerve fibers in awake, freely moving animals, we developed a miniaturized optoelectronic system. We target channelrhodopsin (ChR2) expression to TRPV1-lineage primary afferent neurons using a TRPV1-cre+ mouse line which include A and C fiber peptidergic neurons25, and which is expressed in their axons in the sciatic nerve (Fig. 1b). Although TRPV1-cre+ drives expression in epithelial26 and smooth muscle27 cells, and according to some reports immune cells28, an epineural light delivery strategy restricts photostimulation to axons.
Fig. 1 |. A wireless optoelectronic system for epineural photostimulation of TRPV1-lineage neurons.
a, Schematic illustration of optical stimulation of peptidergic, ChR2-expressing nociceptors at the peripheral nerve level. Optogenetic activation results in generation of orthodromic action potentials (AP) and antidromic release of peptides at the peripheral terminals. b, Targeted expression of ChR2-tdTomato in the dorsal root ganglion (DRG) and sciatic nerve of TRPV1-Cre::ChR2 mice. Scale bar: 100 μm. c, Schematic illustration of the wireless optoelectronic system enabling epineural delivery of light for optogenetic modulation in freely behaving mice. The system comprises an ultra-miniaturized wireless headstage that powers a soft, circumneural optoelectronic implant placed around the sciatic nerve. A handheld tablet interfaces bidirectionally with the wireless unit through Bluetooth communication, sending finite optical stimulation protocols and receiving information about the system status. d, Photograph of the wireless optoelectronic system emphasizing the low footprint of the wireless unit and micro-LED array (ILED = 2 mA). e, Block diagram of the wireless optoelectronic system, including the external circuitry that enables or disables the device. Circuit schematics of the micro-LED array driver (purple) for fine and reproducible driving of the micro-LED array and monitoring (current check) thereof. f, Detailed photographs of both sides of the assembled wireless unit printed circuit board (PCB).
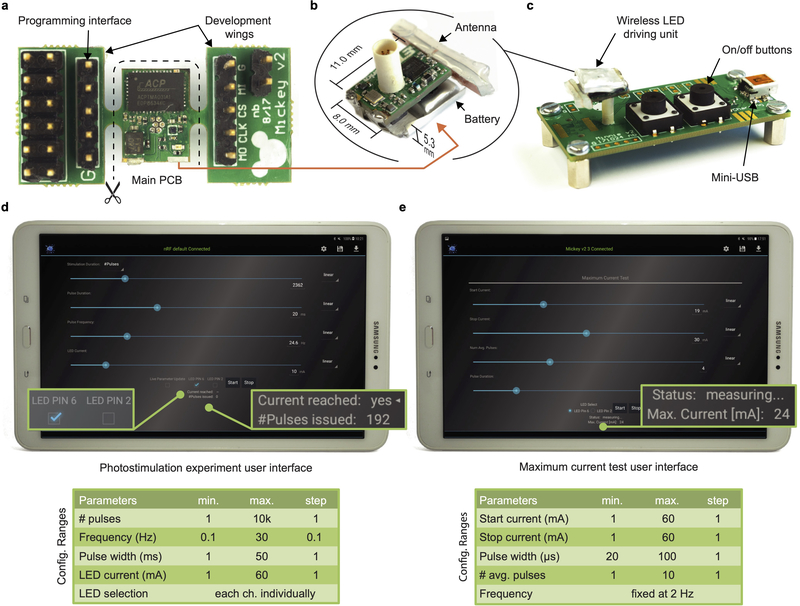
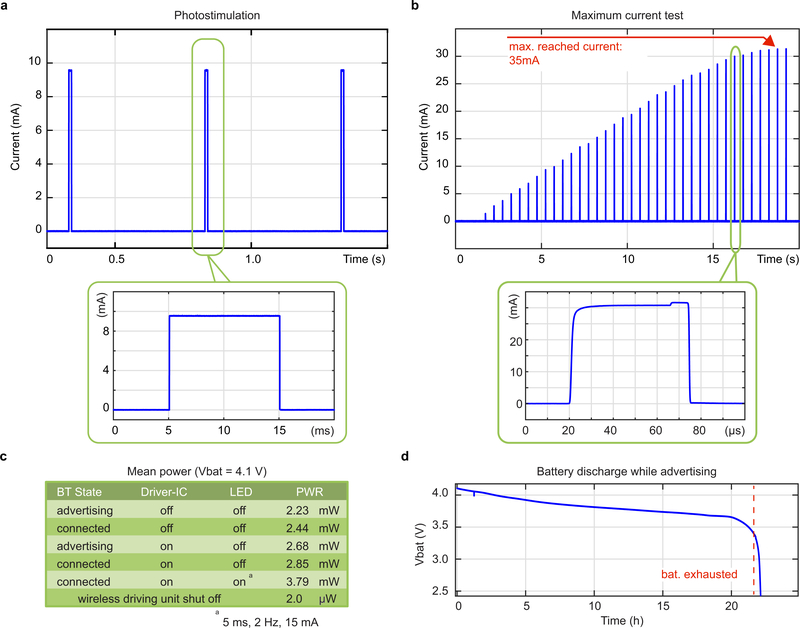
To address the need for a wireless and programmable system for chronic optogenetic modulation of peripheral nerves we combined advances in materials science, electrical engineering and neuroscience (Fig. 1c, d). We engineered the system to deliver repeated precise photostimulation of selective peripheral axons in freely behaving animals, independent of their position and activity. The system consists of four components: (1) a compliant circumneural array of high efficiency microscale LEDs that folds around the sciatic nerve, (2) stretchable interconnects that join the micro-LEDs to a subcutaneous cable and dampens the effects of local motion, (3) a two-wire cable threaded subcutaneously to a head-mounted connector, and (4) a lightweight (1.1 g), compact (0.5 cm3) electronic headstage system that incorporates multi-channel stimulation capabilities, meter-range wireless communication to a tablet or smartphone, and a Li-ion battery. This small and high efficiency battery permits up to 20 h long experiments. For battery recharging or switching the device on/off, its USB charging station can be interfaced with a 6-pin connector (Fig.1e, f, Extended Data Fig.1). Control, status and configuration of the miniaturized system are enabled wirelessly through a Bluetooth Low-Energy System-on-Chip (BLE SoC), a custom antenna design (Extended Data Fig. 2) and an Android application with firmware upgrade (DFU) capabilities. A customized29 LED driver application specific integrated circuit (ASIC) with 4 stimulation channels emits current pulses with programmable amplitude (1–60 mA), frequency (0.1–30 Hz) and pulse width (1–50 ms), in fine steps (1 mA, 0.1 Hz, 1 ms) (Extended Data Fig. 3). The low voltage headroom between the Li-Ion battery (3.5–4.2 V) and the forward voltage of the blue micro-LEDs (3.1 V at 20 mA) means that the set current may not be reached if the battery is exhausted or the series wiring resistance Rs in the implant is too high. The ASIC includes, therefore, a comparator so that actual current measured over Rsense can be compared to the set value. This current-check function gives precise real-time feedback on implant condition, in the Android application. A special operation mode automatically determines maximum achievable current by emission of 20–100 μs pulses at 2 Hz with a stepwise increasing current (Extended Data Fig. 3b), a testing protocol that does not activate ChR230.
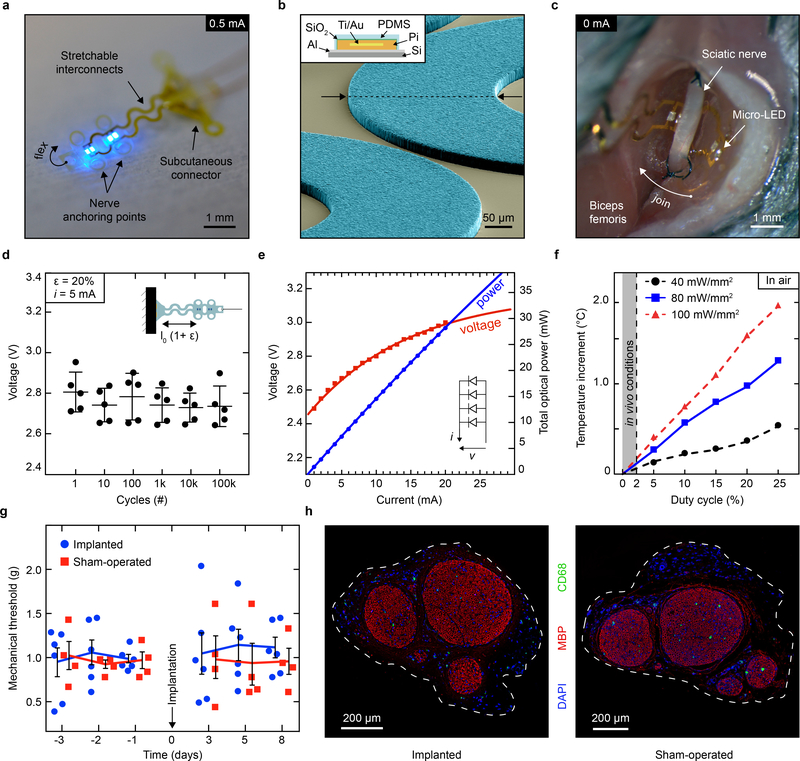
The optoelectronic implant integrates four 320 μm x 240 μm micro-LEDs (Fig. 2a) on a thin polyimide substrate (4 μm in thickness), wired to wavy gold interconnects (300 nm in thickness), further encapsulated in a low-modulus (1 MPa) silicone layer (Fig. 2b, Extended Data Fig. 4). Anchoring holes to facilitate stable surgical position are patterned within the polyimide and silicone layers. The engineered polyimide implant conforms with the ∼ 0.6 mm diameter of the sciatic nerve of the mouse and reliably accommodates local movement of the nerve. The wavy interconnects ensure that minimal deformation occurs at the site of the micro-LEDs and the connector (Fig. 2c). Following 100k stretch cycles to 20% uni-axial strain under a 5 mA bias, the micro-LEDs display a stable Vf (Fig. 2d).
Fig. 2 |. Characterization of the soft micro-LED array and bio-integration.
a, Photograph of the optoelectronic implant that hosts four micro-LEDs mounted on flexible polyimide strips designed to fold transversally to the sciatic nerve. Anchoring points secure circumneural positioning; stretchable interconnects accommodate physiological motion of the nerve in vivo. b, Colorized scanning electron micrograph (60° titled view) of the array’s interconnects, highlighting the patterning of the PDMS encapsulation layer (light blue). Schematic cross-section of the interconnect, top left inset. c, Intraoperative photograph of the micro-LED array implanted around the sciatic nerve. The interconnects allow for the subcutaneous connector to be decoupled from nerve interfacing. d, Micro-LED voltage under 5 mA bias and uni-axial, cycling to 20% strain. n = 5 devices; mean ± s.d. e, Optoelectronic characterization of the micro-LED array under incremental bias (λ = 470 nm). f, Temperature increment measured in air at the surface of an operating micro-LED array as a function of irradiance and activation duty cycle. Grey area: representative in vivo experimental conditions showing minimal temperature increase. g, Mechanical sensitivity of the ipsilateral-operated hindpaw prior and after surgical procedure (micro-LED implanted and sham). n = 6 implants, n = 4 sham; mean ± s.e.m. h, Representative transverse sections and immunochemistry of sciatic nerve at the site of implantation,1-month post-surgery.
Light is delivered to the nerve via two pairs of micro-LEDs mounted in parallel on two pliable panels transverse to the sciatic nerve (Fig. 2a, c, Extended Data Fig. 5). This redundant micro-LED distribution was selected to achieve a homogenous irradiation of the whole nerve (compared to a single localized light source). Under a 20 mA bias and 3.1 V forward voltage Vf operating conditions in air, the optoelectronic system delivers 28 mW (91 mW/mm2) of optical power (λ = 470 nm) (Fig. 2e), compliant both with activation of ChR2-expressing axons and the powering capacity of the wireless head-stage unit. Next, we monitored temperature increments at the surface of the implant (with dissipation restricted to air) as a function of light pulse duty cycle and irradiance. Under our in vivo operating conditions (< 2% duty cycle), only limited surface heating (below 0.5 °C) was observed, as compared to the 1.86°C temperature increase reached with pulsed light with a 25% duty cycle at 100 mW/mm2 irradiance (Fig. 2f).
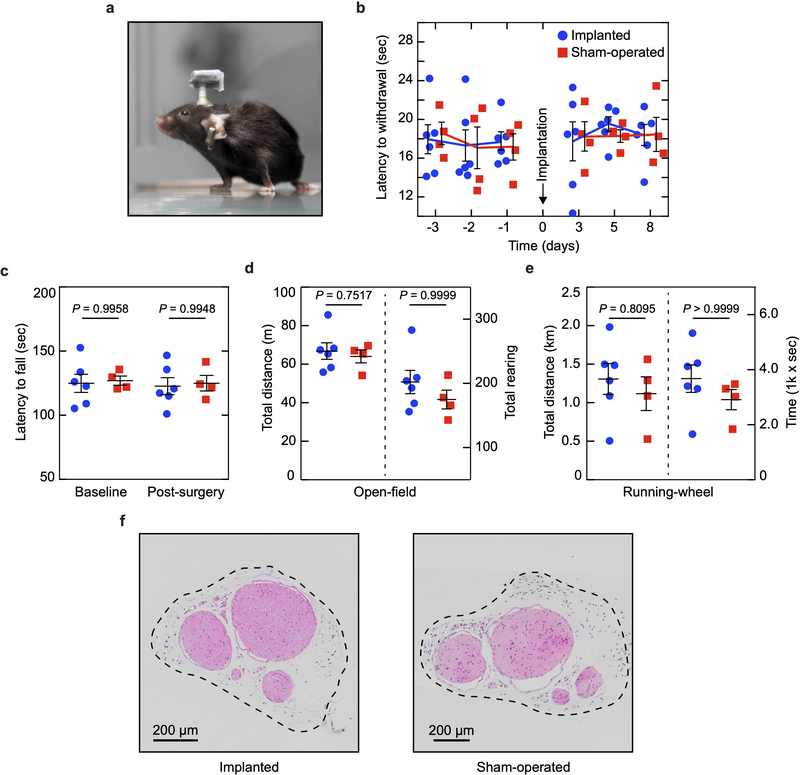
Next, we tested if the soft optoelectronic implant damaged the sciatic nerve or changed its function over time. Implantation of the micro-LED array did not impact mechanical (Fig. 2g) or thermal (Extended Data Fig. 6b) pain-related hindpaw behavioural assays 3 days post-surgery, compared to mice with a sham implantation. Sensorimotor coordination, exploratory and voluntarily behaviors were also not affected when tested 1-week post-implantation (Extended Data Fig. 6c–e). The absence of behavioural and motor deficits supports the system’s biocompatibility31 and utility for standard neurobiological research tasks. Histological cross-sections of the sciatic nerve did not reveal mechanical deformation, demyelination or immune cell infiltration (including myeloid and non-myeloid cells) one-month post-surgery (Fig. 2h, Extended Data Fig. 6f).
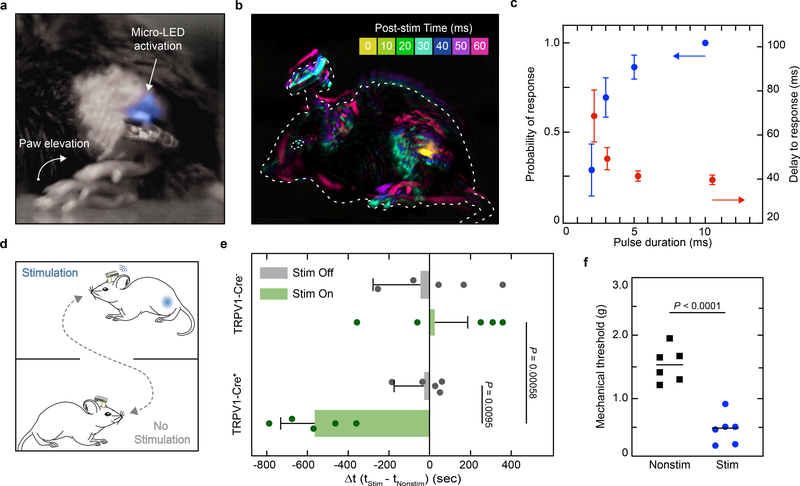
We implemented this soft neurotechnology to activate TRPV1-cre+ lineage neurons in the sciatic nerve in vivo by implanting TRPV1-Cre::ChR2 mice with the micro-LED array and assessing the orthodromic effects of epineural activation of ChR2 in awake, freely behaving animals, with high-temporal resolution (0.5–1.0 kHz) video recordings. A single, short (3–10 ms duration) pulse of blue light caused hind paw elevation characteristic of nociceptive flexion reflexes (Fig. 3a, b). The delay for the evoked response was stable for pulse durations > 3 ms (41.37 ± 2.38 ms delay, 5 ms pulse duration) (Fig. 3c), consistent with recruitment of thinly myelinated sensory axons (Aδ fibers32). The probability of the behavioral response positively correlated with single pulse duration. Absence of any behavioral response in littermate control mice with no ChR2 expression emphasizes that the effects of photostimulation are specific to ChR2 activation and are not the consequence of tissue heating, which we estimate to be minimal (Extended Data Fig. 7). To test whether epineural activation of TRPV1-cre+ axons produces an aversive state, we used the real-time place preference paradigm (Fig. 3d). TRPV1-cre::ChR2 mice showed no place preference in the absence of photostimulation while its activation triggered marked aversion of the stimulation-paired area (p = 0.00058), with a corresponding increase in time spent in the non-stimulation-paired area compared with control mice (p = 0.0095) (Fig. 3e). Furthermore, repeated activation of TRPV1-lineage neurons produced a persistent increase in mechanical sensitivity 24 hours post-stimulation (p < 0.0001) (Fig. 3f), a change that may be attributed either to nociceptor sensitization33 as a potential consequence of the antidromic pro-inflammatory effects of the stimulation or to changes induced in the spinal cord.
Fig. 3 |. Remote, epineural optogenetic activation of TRPV1-lineage neurons in freely behaving mice.
a, Representative chronophotograph of the mouse paw following photostimulation with the wireless optoelectronic system in a TRPV1-Cre::ChR2 mouse (45 mW/mm2 irradiance, 3 ms single-pulse duration). b, Global motion detection of the whole animal resulting from a single-pulse epineural stimulation and a 10 ms-bin of behavioural recording analysis. Dashed line: animal’s initial position. c, Probability of response and its delay depending on single light pulse duration (10–20 trials per condition; mean ± s.e.m.). d, Illustration of the real-time place preference setup. A mouse carrying the wireless optoelectronic system is freely moving in a box containing two distinct areas. e, Changes in the time spent in the stimulation-paired area compared to the non-stimulation-paired area, for mice expressing ChR2 in TRPV1-lineage fibers and control littermates. Photostimulation frequency of 0 and 0.5 Hz for Stim Off and Stim On, respectively. n = 5 animals per group; two-sided unpaired t-test; mean ± s.d. f, Mechanical sensitivity in the micro-LED array ipsilateral paw following repeated epineural stimulation; two-sided unpaired t-test; n = 6 per group; mean.
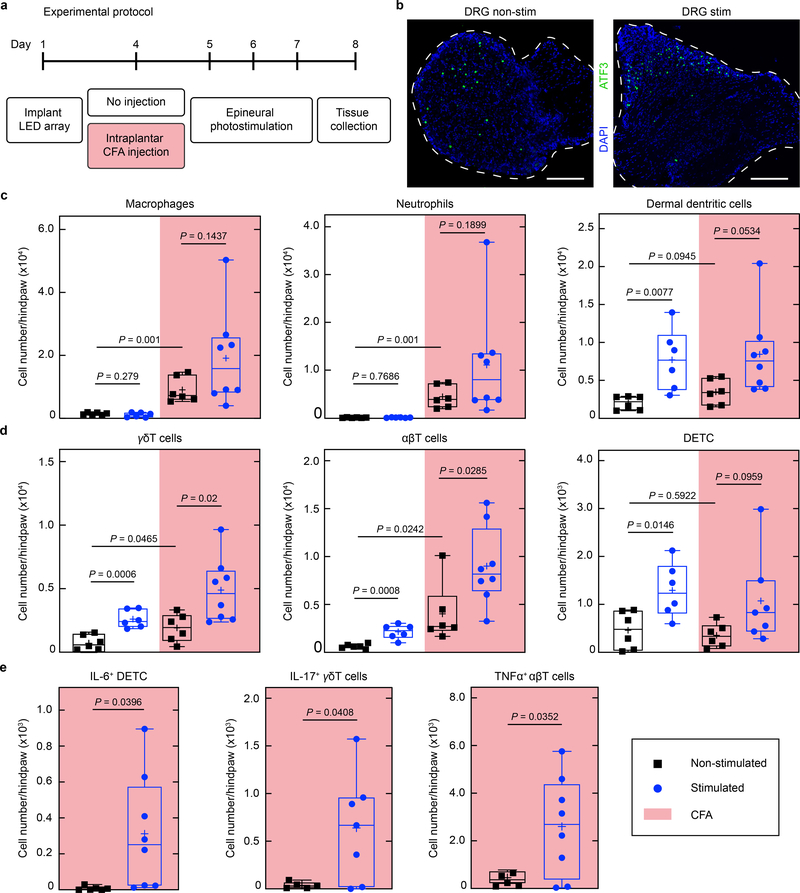
To determine if nociceptor peripheral terminals can trigger immune cell mobilization, we optically stimulated the sciatic nerve of TRPV1-Cre::ChR2 mice at 2 Hz (which is within the physiological firing rate of C-fibers) for 30 minutes on three consecutive days in freely behaving conditions, at an intensity producing minimal discomfort (without biting, licking or vocalization; Fig. 4a). In pilot studies, the optogenetic activation in non-inflamed, freely moving animals produced a post stimulation mild redness of the ipsilateral hindpaw, indicating the erythematous component of neurogenic inflammation (data not shown). This was not observed, however, in isoflurane-anesthetized mice. We presume that the concomitant activation of TRPV1+ cells by isoflurane may hinder the neurogenic erythematous response34. Therefore, we conducted all our subsequent experiments in awake mice. Repeated optical stimulation did not induce expression of the stress-induced transcription factor ATF3 in the lumbar dorsal root ganglia beyond the low levels produced by the implantation. This suggests that the optical stimulation incurred no axonal injury response (Fig. 4b). Paw skin was removed one day after three consecutive days of stimulation, the tissue dissociated, and flow cytometry performed for lineage defining immune markers to assess cellularity in the innervating tissue (Extended Data Fig. 8). Levels of subsets of immune cells from both the innate and adaptive system (dermal dendritic cells, γδ, αβ, and dendritic epidermal T cells) increased in the skin following optogenetic stimulation in naïve mice (Fig 4c, d, white area), indicating that antidromic nociceptor activation alone is sufficient to induce inflammation. Transdermal activation of TRPV1-cre::Ai32 mice is reported to elicit a local type 17 immune response22, which likely reflects nociceptor activation, although the Ai32 line has leaky expression of CHR235
Fig. 4 |. Recurrent optogenetic activation of TRPV1-cre+ neurons produces immune changes.
a, Timeline of the experimental protocol. All mice were implanted with the micro-LED array and randomly assigned to an experimental cohort. The stimulated group received photostimulation (60 mW/mm2, 10 ms, 2 Hz, 30 minutes) for 3 consecutive days following CFA treatment or not. b, Representative cross-section images of the lumbar DRG. Immunostaining reveals minimal expression of ATF3 in mice, independently of the photostimulation protocol. Scale bar: 200 μm c, Cell numbers of myeloid populations (CD45+Thy-1.2-) in the micro-LED array ipsilateral hindpaw skin. d, Cell numbers of lymphoid populations (CD45+Thy-1.2+) in the micro-LED array ipsilateral hindpaw skin. e, Immune cell populations in the skin expressing distinct cytokines following CFA treatment coupled with epineural photostimulation. n = 6–8 animals per group; two-sided unpaired t-test. Symbols represent individual mice analyzed independently. The box plots display the median and interquartile range, ‘+’ denotes the mean, and the extending whiskers, the largest and lowest observations.
, and TRPV1 is expressed in immune and epithelial cells28. Direct stimulation of axons in the nerve overcomes these peripheral expression problems. We performed the same stimulation protocol on control ROSA-ChR2+/+::TRPV1-CRE–/– animals (Extended Data Fig. 9). Here, we did not observe a change in immune cell mobilization indicating that optical stimulation of the nerve by the implant in the absence of ChR2 expression has no effect on immune activation, and conclude that it is the antidromic generation of activity in nociceptors from the site of stimulation in the nerve to their peripheral terminals that activates the immune system.
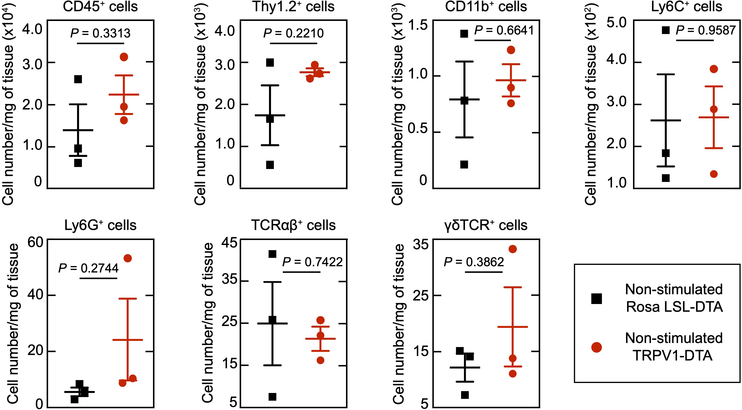
A low dose of complete Freund’s adjuvant (CFA) was injected intraplantarly to induce minimal levels of ongoing inflammation, resulting in small increases in macrophages, neutrophils, dermal dendritic, and T cells (Fig. 4c, d, non-stimulated naïve vs non stimulated CFA treated). Optogenetic stimulation in the CFA treated mice induced significant further increases in the numbers of γδ, αβ T cells in the inflamed skin (Fig. 4c, d, pink area) and expression in T cells of cytokines associated with inflammatory responses (IL6, IL-17 and TNFα) (Fig. 4e) compared to non-stimulated CFA treated mice (Fig. 4c, d, white area). Since activation of nociceptors induces an increase in cell type-specific immune response to CFA, we wondered if nociceptor ablation would have an opposite effect on immune cell mobilization. To test this, we injected CFA into the hind paw of TRPV1-Cre+/+::DTA+/+ mice that express diphtheria toxin under the control of the Trpv1 promoter resulting in the ablation of nociceptors36, but did not observe any changes in immune cell numbers when compared to CFA injected TRPV1-Cre–/–::DTA+/+ littermates, indicating that in this context a gain of nociceptor function is necessary to elicit immune cell changes (Extended Data Fig. 10). Stimulation of TRV1-cre+ lineage nociceptors in awake mice is, therefore, sufficient to both induce and amplify changes in immune cells in the skin.
Optogenetic stimulation of peripheral nerves in freely moving animals is technically challenging because of the movement of the nerve during locomotion6. Conducting experiments in anesthetized animals eliminates behavioral responses, impedes the capacity to modulate the nervous system repeatedly, and appears to impact the extent of neurogenic inflammation. Although implantable optic fibers can reliably deliver light to peripheral axons31, tethering the animal to an external light source hinders naturalistic behavior. Implantation of LEDs in close proximity with the nerve alleviates mechanical load9, and coupling this with a battery-powered stimulator enables wireless photostimulation. Using this “soft neurotechnology” in awake mice we have not only confirmed the aversive behavioral consequences of nociceptor activation8,32,33 but also demonstrated that such stimulation alters immune cell numbers and cytokine production in the skin. The rapid detection of danger by the nervous system translates then not only into pain but also into concurrent immune activation. The functional advantages and pathological effects of this neuroimmune interaction now need to be teased out.
We opted for a battery-operated electronic and head-mounted system; ultimately such system can become fully implantable, with, for example, an ultra-compact rechargeable battery37. Advances in soft implantable neurotechnology now offer reliable solutions for the neuromodulation of specific peripheral neurons9,10. Simple changes to the micro-LED array could be used to target opsins outside of the blue spectrum and permit multi-site38 and multi-opsin targeting39. Further functionalities such as control of multiple neurostimulation modalities, recording of physiological data40 and close-loop control10, can also be added to a customized system-on-chip headstage. The combination of compliant design microtechnology, miniaturized electronics and optogenetics will enable, therefore, multiple further systems neurobiological applications.
Methods
Fabrication of the wireless micro-LED-driving unit
The custom micro-LED-driver integrated circuit (IC) was fabricated in an industrial 130 nm 1P8M CMOS technology with metal-insulator-metal (MIM) capacitor and salicide block (SAB) resistor options for analog circuitry. The chip-die (2270 × 1180 μm2) was bonded with copper wires (Ø = 20 μm) in a 0.4 mm pitch QFN46 package (6.5 × 4.5 mm2). The printed circuit board (PCB) of the micro-LED-driving unit (Fig. 1f) was manufactured in a standard industrial technology: FR4, 6 layers, 1.0 mm overall thickness, > 100 μm features/clearance, > 100 μm drill. In addition to the wireless unit itself, the board includes two ‘wings’ with programming and debug interfaces (Extended Data Fig. 1a). All commercial components were selected with minimal footprint: the BLE SoC (nRF52832, Nordic Semiconductor) and the linear voltage regulators (LD39130S series, ST Microelectronics) come in chip-scale packages (CSP), the DC/DC converter (LXDC2HN series, Murata) has passives and actives co-integrated in a single package, and passive (LRC) components. Solder paste and components were manually placed and soldered in a reflow oven (5 min, 230 °C). Afterwards, the 6-pin connector (A79109, Omnetics) was soldered manually with solder paste and hot air. The BLE SoC was programmed via its wired connection on one ‘wing’, then the ‘wings’ were cut-off. A 12 mAh rechargeable Li-Ion battery (GMB031009, Guangzhou Markyn Battery Co., Ltd) and antenna were manually soldered and glued to the remaining 8 × 11mm2 PCB. For high mechanical endurance, the bond between PCB and connector base as well as the battery were reinforced with epoxy. Finally, the whole device was encapsulated in silicone (730, Dow Corning).
Design and fabrication of the antenna
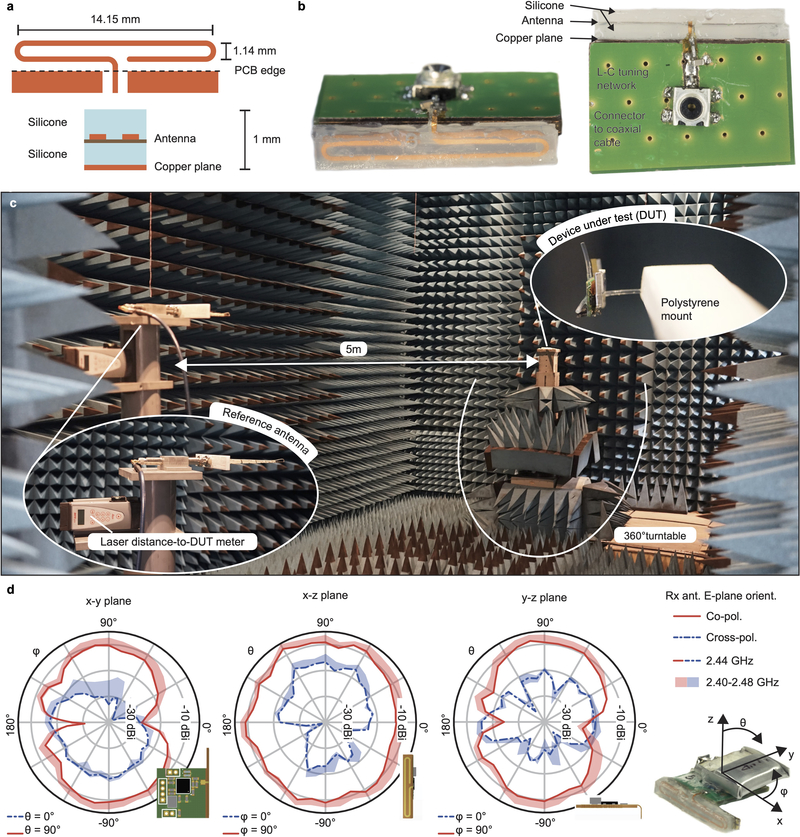
A λ/4-antenna folded into a paper-clip shape (Extended Data Fig. 2a) was etched from standard single-layer flex-PCB (100 μm-thick substrate) material and encapsulated in silicone (730, Dow Corning). A solid-copper plane added to the bottom of the stack detunes the resonant frequency in a controlled way, and shields the antenna from device-specific influence. The copper-silicone-antenna-silicone stack was next mounted sidewise on the main PCB. The exact values for antenna-length and π matching network components were found in a series of return loss measurements (S11) on a dummy PCB (Extended Data Fig. 2b). In-air performance was characterized in an anechoic chamber for the final antenna design in combination with its matching network and the BLE SoC on a battery-operated dummy device with PCB size matching the LED-driving unit. The transmitter was configured to constantly emit a carrier with known power while the absolute receive power was measured with a calibrated antenna positioned in 5 m distance. The measured radiation patterns are given in Extended Data Fig. 2d.
Fabrication of the micro-LED array
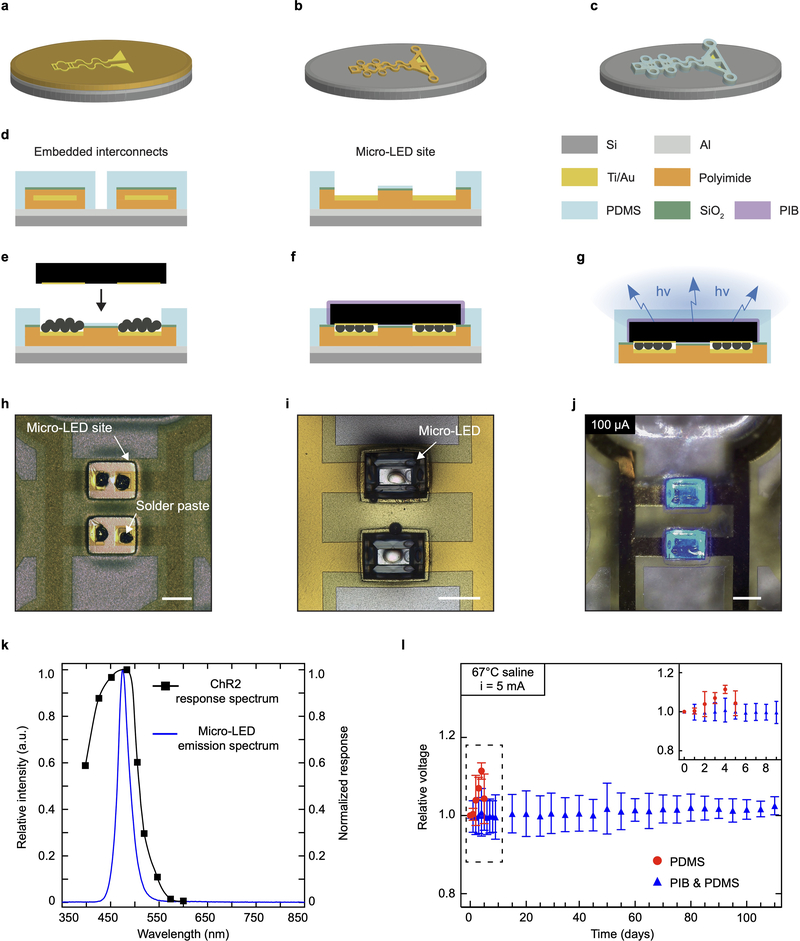
The complete process flow is illustrated Extended Data Fig. 4. A layer of titanium/aluminum Ti/Al (20/200 nm in thickness) was deposited on a 4-inch silicon wafer by e-beam evaporation (EVA760, Alliance Concept). Then, a 4 μm thick layer of polyimide (PI2611, HD Microsystems GmbH) was spin-coated and cured (2 hours at 300°C in a N2 oven). A layer of titanium/gold Ti/Au (20/300 nm in thickness) was sputtered after O2 plasma surface activation (AC450, Alliance Concept). The film was patterned to the array interconnects by photolithography (photoresist AZ 1512, 2 μm-thick spin-coating, baking on a hot plate at 110°C for 2 minutes, 110 mJ.cm−2 exposure at 405 nm and development in AZ 726 developer for 1 minute), Au wet etching (MicroChemicals GmbH) and Ti dry etching (Reactive-Ion Etching, 20 sccm Cl2, 30 sccm Ar, 10 mTorr, 50W RF, 800W LF, 45 s, 201RL, Corial). Next, the film was encapsulated with a 3.5 μm-thick layer of PI. The stack was patterned by photolithography (AZ 9260, 8 μm-thick spin-coating, baking on a hot plate at 110°C for 5 minutes, 350 mJ.cm−2 exposure at 405 nm and development with developer AZ 400 in deionized water,1:5 volume ratio, for 6 minutes) and RIE (50 sccm O2, 5 mTorr, 150W RF, 500W LF, 300 s). Prior to the spin-coating and curing of a 20 μm-thick layer of PDMS (Sylgard 184, Dow Corning), a thin film of SiO2 (20 nm) was sputtered on the PI structures, followed by plasma O2 surface activation. An hybrid etching mask, comprised a layer of sputtered Al (600 nm) and a succeeding layer of 14 μm-thick photoresist (AZ 9260), was patterned by photolithography (520 mJ.cm−2 exposure at 405 nm and development with AZ 400 in DI, for ~15 minutes). The PDMS was patterned via RIE (75 sccm CHF3, 25 sccm O2, 10 mTorr, 150W RF, 800W LF, 1,400 s) to the implant external shape, revealing die integration sites. The process of micro-LEDs integration is illustrated Extended Data Fig. 5. The micro-LED bare dies (320 × 240 × 140 μm3, DA2432, Cree Inc.) were precisely positioned using a pick-and-place equipment (JFP Microtechnic) and the reflow of a solder paste (SMDLTLFP10T5, Chipquik) ensured mechanical and electrical connections. Following this integration step, a 12% by weight ratio solution of polyisobutylene (PIB, Oppanol, BASF) in cyclohexane (Sigma-Aldrich) was printed on the micro-LEDs using a pneumatic dispenser (KDG 1000, Abatech) and was dried thermally. Next, the array was encapsulated with a drop of PDMS after O2 plasma surface activation, resulting in a total thickness ~70 μm at the interconnects. The latter were soldered to copper wires (CZ 1103, Cooner Wire) and the connections were sealed with silicone (734, Down Corning. Finally, the μ-ILED array was released from the wafer by anodic dissolution of the Al layer (2 V bias in saturated NaCl solution).
Functionality of the micro-LED array under stretch
The optoelectronic devices were mounted on a custom-built uni-axial stretcher with the connector clamped in fixed position. Strain was applied by connecting the micro-LED array distal part to a moving clamp using a suture thread (1 stretching cycle to maximal strain per second). Voltage was measured while applying constant current with a sourcemeter (2400, Keithley). For data acquisition, a custom-made software based on LabVIEW 2013 was used.
Optical measurements
The total optical power was measured with the micro-LED array laminated on a photodiode (S170C, Thorlabs), and read on a power meter console (PM100D, Thorlabs). The micro-LED spectral flux was recorded with a spectrometer (CCS200/M, Thorlabs) and a dedicated software (Thorlabs OSA).
Experimental subjects
Healthy, adult (C57BL/6j background strain, 3–6 months old, 18–32 g) male and female mice were used during these experiments. Specific expression of ChR2 in the TRPV1-cre afferents was previously described27,32. Briefly, ChR2-tdTomato was expressed in nociceptive afferents by breeding heterozygous Rosa-CAG-LSL-hChR2(H134R)-tdTomato-WPRE (Ai27D) mice with heterozygous mice with Cre recombinase inserted downstream of the TRPV1 gene. Resultant mice were heterozygous for both transgenes (i.e. TRPV1::ChR2) and were housed with control littermates. Mice were given ad libitum access to food and water and were housed in 22°C ± 1°C, 50% relative humidity, and a 12 hr light:12 hr dark cycle. All experiments were carried out at Boston Children’s Hospital and Harvard Medical School according to institutional animal care and safety guidelines and with Institutional Animal Care and Use Committee (IACUC) approval.
Surgical implantation of the micro-LED array
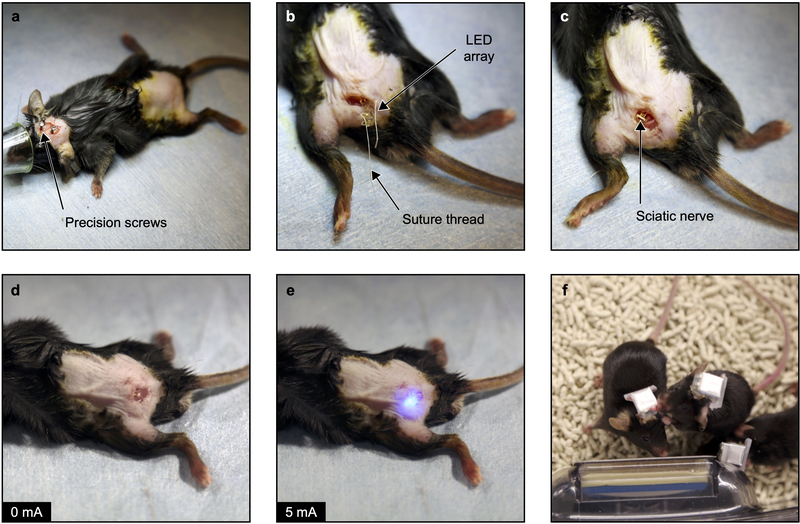
The surgical protocol is illustrated on Extended Data Fig. 5. Mice were anesthetized under isoflurane (1.5%) and body temperature was maintained with a heated surgical table. Under sterile conditions, a skin incision exposed the skull, where 3 precision screws were drilled. The left sciatic nerve was exposed at the mid-thigh level (proximal to nerve’s trifurcation) following a skin incision and blunt muscles separation. The amphenol connector and the wires were threaded subcutaneously to the skull. Then, the micro-LED array was carefully pulled below the nerve in order to place micro-LEDs on both of its sides. Parallel suture threads (Vicryl 6–0, Ethicon) passing through array’s anchoring sites were knotted to bend the light-emitting structures around the nerve. Next, the subcutaneous connector was attached to the biceps femoris muscle with sutures (Silk 6–0, Ethicon). Care was taken to adjust the subcutaneous connector position in order to minimize strain in the interconnects. The hindlimb muscles were sewed back together and the skin incision was closed with surgical clips. Finally, the head connector was cemented to the skull and to the screws. Full surgical procedure took on average 45 minutes. The sham surgery protocol was analogous, without micro-LED array implantation. A bare connector (Omnetics) was mounted to the skull so blinded experimenters could not differentiate experimental groups during biocompatibility testing. Mice were allowed to recover in single housed cage and were injected subcutaneously the 2 consecutive days with post-operative meloxicam analgesic (Loxicom, Norbrook).
Opsin expression and biocompatibility immunohistochemistry
Mice were anesthetized with pentobarbital (100 mg·kg°1 intraperioneal) and fixed by transcardial perfusion with 4% paraformaldehyde dissolved in 1 X phosphate buffered saline (PBS). Sciatic nerves and DRGs (L3-L5) were dissected, postfixed, washed, cryoprotected with sucrose in PBS (30% w/v) for 2–3 d. and either embedded in paraffin blocks (4 μm-thick cross-sections) or frozen (10 μm-thick nerve longitudinal sections and DRG sections). Hematoxylin and Eosin (H&E) staining of nerve cross-sections was performed with an automated equipment (ST5020, Leica) and imaged with a virtual slide scanner and 20X objective (VS120, Olympus). For immunostaining, slides were rehydrated with 3 washes of 1 X PBS for 5 min. each, and then blocked for one hour with blocking media (1% bovine albumin serum, 0.1% triton X-100 in 1 X PBS). Sections were incubated with primary antibodies, chicken anti-Neurofilament 200 (NF200, 1:2000, Millipore), mouse anti-Cluster of Differentiation 68 (CD68, 1:200, Abcam) and rabbit anti-Myelin Basic Protein (MBP; 1:100, Abcam) in blocking solution overnight at 4°C and washed 3 times. Slides were then incubated with fluorescence secondary antibodies, Alexa 488 (green, 1:500, Thermofisher) and Alexa 555 (red, 1:500, Thermofisher), in blocking solution for one hour, washed 3 times and mounted (Vectashield). A nuclear stain was also performed with 4’,6’-diamidino-2-phenylindole dihydrochloride (DAPI; 2 ng/ml, Molecular Probes). Sections were cover slipped using ProLong Gold anti-fade reagent (InVitrogen). Nerve cross-sections were examined and photographed using deconvolution fluorescence microscopy and scanning confocal laser microscopy (LSM 880, Zeiss). Tiled scans of individual whole sections were prepared using a 20X objective and the post-processing was conducted with Zen software (Zeiss). Nerve longitudinal sections and DRG sections were imaged using an inverted microscope (Nikon Eclipse 80i) with a Nikon 20X objective and 10X objective respectively. In DRGs and sciatic nerve longitudinal sections, fluorescence corresponding to tdTomato was absent in tissues from littermate mice that did not express ChR2-tdTomato or that did not express the Cre recombinase.
Mechanical sensitivity assessment
Mice were habituated, single housed in a small transparent chamber (7.5 × 7.5 × 15 cm3) elevated on a wire grid. Mechanical sensitivity was measured by applying an increasing perpendicular force to the lateral plantar surface of the left hindpaw using graded series of six von Frey filaments (with bending force of 0.04, 0.07, 0.16, 0.4, 0.6, 1, 1.4, 2.0 g) and counting the number of withdrawal responses across ten applications. The pain mechanical threshold was defined as the minimal force triggering at least five withdrawals.
Thermal sensitivity assessment
Each mouse was habituated on a warmed (29°C) glass platform of a Hargreave’s apparatus (IITC Life Science). Thermal sensitivity was determined by applying a radiant heat source to the plantar hindpaw while measuring the duration before hindpaw withdrawal. The latency for the onset of nocifensive behavior was timed. This latency was determined three times per animal, per session, with a 5 minutes interval to prevent thermal sensitization.
Sensorimotor coordination
To investigate sensorimotor coordination following the micro-LED array implantation, mice were first trained on the accelerating rotarod (Omnitech Electronics). For training, mice were placed on a rotarod moving at 4 rpm for 10 min. Training took place on three consecutive days. For behavioural testing, the mice ran on the accelerating rotarod at 4 rpm + 0.1 rpm.s−1. The time to fall was automatically recorded. The test was repeated 3 times with 10 min intervals.
Physical performance and endurance assessment
Mice were single-housed in a cage containing a stainless-steel running wheel (23 cm in diameter) with a ball-bearing axle (BIO-ACTIVW-M, Bioseb). The wheel could be turned in either direction. The wheels were connected to a computer that automatically recorded the distance travelled by each animal. No experimenters were present in the room during the recording sessions. As mice run more during the active dark light cycle, the running wheel activity was monitored from 10 pm to 6 am. The distance and the time spent actively in the wheels were acquired with the Activw-Soft software (Bioseb).
Exploratory activity monitoring
The mouse exploratory activity was assessed with the open-field test. The open-field (SmartFrame, Kinderscientific) contained a 40 × 40 cm2 floor and 38 cm high walls. Horizontal exploratory activity was recorded by infrared detectors with 2.5 cm interval distance in the horizontal plane at a height of 1 cm. Vertical activity (e.g. rearing) was recorded by a second row of sensors at a height of 5 cm. The mice were placed in the middle of the field and monitored for 10 minutes. No experimenters were present in the room during the recording sessions.
Thermal finite element model
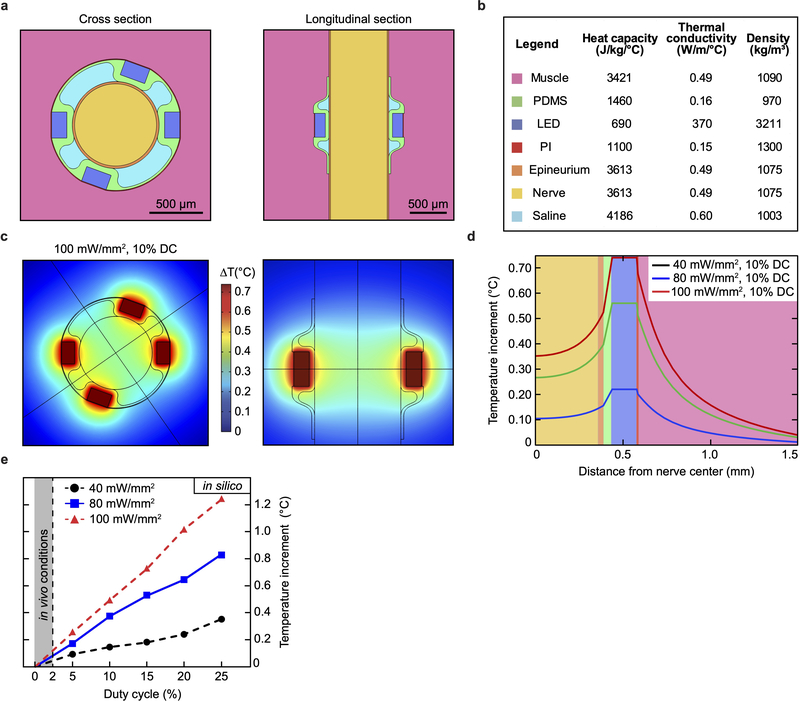
We developed a thermal finite element model (FEM) to analyze the temperature distribution in the nerve and surrounding tissues during operation of the micro-LED array using COMSOL Multiphysics (Extended Data Fig. 7). The elements of the 3D model were the main constituents of the optoelectronic device (polyimide layer, micro-LEDs, PDMS encapsulation), the mouse sciatic nerve and the surrounding biological tissues (muscles). We extracted from the literature the thermal coefficients, heat capacitances and densities for each material41,42. While we assumed the same thermal properties for the nerve and the epineurium, the micro-LEDs were modelled as a SiC solid. For heat dissipation simulation, the outer boundary was set to the standard body temperature, i.e. 310 K. We performed a parametric study by varying the temperature at the surface of the micro-LEDs and then analyzed the temperature distribution along a cutline passing through the center of one micro-LED and the nerve.
Single-pulse, epineural optogenetic activation
Mice were connected with the wireless head-stage and single-housed in small transparent chambers for 30 minutes prior to the start of the experiment. High-speed video recordings were performed during simultaneous single-pulse epineural optogenetic stimulation. The wireless system was controlled via an Android tablet (Galaxy Tab A, Samsung) where stimulations parameters (i.e. pulse duration, current) were set. Behaviour was sampled at 500/1000 frames per second using a high-speed camera (SC1, Edgertronic) with a 28 mm lens (Nikon) and set at 896/864 pixels × 896/688 pixels under normal ambient lighting. Optogenetic stimulations were carried when the mice were in a calm and awake idle state and not during grooming or exploring activities. The stimulation amplitude was set empirically to the smallest amplitude achieving a mild response, and allowing for a 30% additional increase (usually Istim ~ 11 mA, corresponding to 15 mW total optical power). The stimulation reliability was assessed with the wireless system’s current check function. The mice were given a minimum of 5 minutes in between stimulation to avoid sensitization effects. Following acquisition, the mouse behaviour was analyzed manually frame per frame using QuickTime Player (Apple Inc.). Littermate controls (TRPV1-Cre–/–::ChR2+/+) did not react to optical stimulation (10–20 ms pulse duration, i > Istim).
Place preference
Real-time place preference was tested in an open-field apparatus (ENV-515S, Med Associates Inc.) with a plexiglass separation that divides the field in 2 areas (43 × 21 cm2 each). An opening in the divider center allows for a mouse to cross easily the separation and to walk in between the 2 areas while being connected to the wireless head-stage. Acquisition was initiated with the wireless head-stage-carrying mouse being placed in the permanent non-stimulation-paired area. For the baseline recording (“Stim Off”), the mouse was allowed to explore freely the whole field without stimulation. Real-time place aversion was tested during a 2nd recording (“Stim On”). Upon mouse entry or exit the stimulation-paired area, the experimenter initiated or stopped the wireless epineural optogenetic stimulation protocol (suprathreshold Istim, 10 ms, 0.5 Hz). Both recording durations were set to 15 minutes. Following acquisition, the time spent in each area was computed with the Activity Monitor 7 software (Med Associates Inc.).
Immunocytochemistry
Mice were euthanized with asphyxiation by carbon dioxide. The spinal column was isolated, a laminectomy was performed, and the DRGs (L3-L5) were dissected out and placed into 4% paraformaldehyde at room temperature for 30 minutes. The tissues were rinsed in 1 X PBS for 5 minutes and placed in 30% sucrose in PBS overnight at 4°C. The DRGs were frozen in cryomolds with Optimal Cutting Temperature media (Tissue-Tek). Cryosections (15 μm-thick) were stored at −80°C. For ATF3 immunostaining, slides were blocked for 30 minutes in a diluted blocking buffer (5% normal goat serum, 0.25% triton X-100 in 1 X PBS). Then, the slides were incubated with primary antibodies, rabbit anti-Activating transcription factor 3 (ATF3, 1:500, Sigma-Aldrich) in blocking buffer overnight at 4°C and washed three times. Next, the slides were exposed to secondary antibodies with Alexa 647 (red, 1:500, Life Tech) in blocking buffer for 1 hour and 40 minutes. Slides were rinsed three times, mounted (Vectashield) and cover slipped with mounting media containing DAPI. DRG images were taken with a laser-scanning confocal microscope (Zeiss LSM 700) using a 10X objective.
Flow Cytometry
Following micro-LED array implantation, treatment groups were randomized. For the CFA treatment group, at Day 4 post micro-LED array implantation, 3 μl CFA (Complete Freunds Adjuvant, Sigma, F5881) and/or sterile PBS were injected intraplantarly into the hind paw of TRPV1-Cre::ChR2 mice. At Day 5, 6 and 7, mice received epineural photostimulation to the left sciatic nerve. The stimulation parameters were 15 mA, 10 ms, 2 Hz for 30 minutes. The photostimulation did not induce automutilation biting behavior. Mice were euthanized on Day 8 with asphyxiation by carbon dioxide and tissues were collected for analysis. Briefly, hind paw skin was removed, digested in 0.5 mg/ml Liberase TL (5401020001, Millipore Sigma), and stained for the following lineage defining cell surface markers after blocking (αCD16/CD32, 0.5 mg/ml, 10 min): CD45 (1:500, Thermo Fisher), abTCR (1:200, Thermo Fisher), gdTCR (1:200, BD Horizon), CD11b (1:2000, Biolegend), Thy1.2 (1:2000, Thermo Fisher), Ly6G (1:2000, Thermo Fisher) and Ly6C (1:2000, Thermo Fisher). For cytokine staining, cells were stimulated in vitro for 5 hours (Cell Activation Cocktail, Biolegend, 423301) in the presence of Brefeldin A and Monensin (Thermo Fisher Scientific) and then fixed and stained using the BD Cytofix/Cytoperm kit following manufacturer’s instructions (BD Biosciences, 554714), and stained with specific monoclonal antibodies against IL-6 (1:500), TNFα (1:200) and IL-17 (1:200) (All from Biolegend). Using a tiered gating strategy (Supplementary Information), cells were identified using light scatter parameters (FSC by SSC) with doublets excluded. Total skin cell counts were performed using a hemacytometer. Samples were analyzed by flow cytometry on an LSR Fortessa (BD biosciences). Data are presented as total cell count.
Statistics
Statistical significance determined by two-sided unpaired Students t-test and one-way ANOVA with Tukey’s multiple comparison test. p values less than 0.05 were considered significant. Numbers of animals are indicated on the figure with each point representing a single animal. For the flow cytometry data, n = 6–8 per group through two separate experiments. For representative histological images, a minimum of three animals per experiment were used.
Data availability
Raw data that supports the findings of this study will be made available upon request to the corresponding authors.
Extended Data
Extended Data Fig. 1: Wireless micro-LED-driving unit preparation.
a, Fully assembled PCB including additional ‘wings’ for access to various signals during device firmware development and for the initial flashing of the program code onto the device. After initial flashing and thorough testing, the ‘wings’ are cut and antenna and battery are attached and soldered. b, The final device measures 8.0 × 11.0 × 5.3 mm3 and weighs 0.85 g – 1.1g after encapsulation in silicone. c, The charging station is used for turning on/off the units – a design choice by which the wireless units can be fully encapsulated and be without any mechanical components (except the connector). Multiple stations can be interconnected to each other such that a single USB port can be used for the charging of many micro-LED driving units. d, Android application screen in experiment mode and overview on the configuration ranges. Each issued current pulse is monitored, i.e., the wireless unit checks if the set current is actually reached and transmits this feedback to the tablet/smartphone. e, Android application screen in maximum-current test mode and overview on the configuration ranges. This operation mode enables the user to quickly determine the condition of a micro-LED implant: A sequence of short current pulses (too short to evoke an optogenetic stimulation) is emitted to determine the maximum current that can be achieved.
Extended Data Fig. 2: Antenna design and characterization.
a, Custom antenna layout with dimensions. The antenna is encapsulated within two layers of silicone prior to PCB soldering. b, Device dummy for return loss (S11) measurements. c, Measurement setup in the anechoic chamber. The device is mounted on a turntable. d, Radiation pattern characterization with a battery-operated device dummy constantly emitting a known-power carrier. Drawn lines represent measurements at center frequency (2440 MHz) while the shades cover the full BLE bandwidth (further measurements at 2402, 2430 and 2480 MHz).
Extended Data Fig. 3: Wireless micro-LED-driving unit performances.
a, Measurement of micro-LED array current during photostimulation pulse train (2 Hz, 10 mA, 10 ms pulse duration) as typically used in the in vivo experiments. b, Micro-LED current pulses emitted during a linear, ultra-low duty-cycle (100 ppm) maximum current search run. Short (20–100 μs) pulses at a low frequency (2 Hz) are used to avoid ChR2 activation during the test. The system delivers up to a 35 mA maximum current to the micro-LEDs. c, Measured overall power consumption of the wireless LED driving unit in various operation states. d, Battery lifetime measurement for a device in advertising state i.e. the device is turned on, however not connected to any tablet or smartphone and does not drive any micro-LED arrays. BLE connection will reduce lifetime by ca. 10%.
Extended Data Fig. 4: Microfabrication of the flexible micro-LED array to target activation of ChR2 in vivo.
a – c, Schematic illustration of the microfabrication process. Patterning of a Ti/Au film on a polyimide substrate (a). Polyimide superstrate covering of the film followed by patterning of the polyimide stack (b). Encapsulation in PDMS and subsequent patterning of the silicone layer (c). d, Schematic cross-sections of the interconnects and micro-LED site of integration. e – g, Illustrations of the micro-LED integration process. Printing of soldering paste on the interconnect pads followed by precise placement of the micro-LED (e). The reflow of the paste ensures mechanical and electrical interfacing. Printing of polyisobuthylene (PIB) on the micro-LED surface (f). PDMS encapsulation and release from the silicon carrier (g). h – j, Representative optical micrographs, such as solder paste printing (h), micro-LED deposition (i) and activation (j). Scale bar: 250 μm. k, Relative intensity associated with micro-LED emission spectrum, or spectral flux, and ChR2 normalized response spectrum. l, Relative changes in voltage for devices placed in 67 °C saline depending on micro-LED encapsulation material. Arrays only encapsulated with PDMS fail after day 7. n = 3 devices per group; mean ± s.d.
Extended Data Fig. 5: Illustration of surgical procedures for implanting the micro-LED array.
a, Under anesthesia and using aseptic technique, a craniotomy is performed and three micro-screws are fixed on the skull. b, Following a skin incision at the thigh level, implant wires are threaded subcutaneously. Suture threads are adjusted on the implant anchoring points. c, The micro-LED implant is placed transversally to the sciatic nerve and secured in position with the suture threads. d, Muscles are closed with sutures and the implant subcutaneous connector is secured at the vicinity. e, The implant is tested intraoperatively with a short activation of the micro-LEDs. f, Photograph of 3 mice carrying a wireless optoelectronic system.
Extended Data Fig. 6: Simulation of optoelectronic-induced temperature change in silico.
a, Elements and their relative 3D geometry used to model the appropriate heat transfer. The micro-LED array is placed epineurally, distributing equally 4 micro-LEDs or heat sources on the sciatic nerve. b, Thermodynamic parameters of the elements used in the thermal model. c, Temperature changes predicted by the 3D model, presented in cross and longitudinal sections. For visualization, the simulated photostimulation parameters (100 mW/mm2, 10% activation duty cycle) exceed the ones used in the in vivo experiments. d, Distribution of optoelectronic-induced temperature change across the different elements as a function of photostimulation irradiance. e, Maximum temperature increment at the interface between inner nerve and epineurium as a function of irradiance and micro-LED activation duty cycle.
Extended Data Fig. 7: Effects of micro-LED array implantation or sham surgery on animal behaviour.
a, Elements and their relative 3D geometry used to model the appropriate heat transfer. The micro-LED array is placed epineurally, distributing equally 4 micro-LEDs or heat sources on the sciatic nerve. b, Thermodynamic parameters of the elements used in the thermal model. c, Temperature changes predicted by the 3D model, presented in cross and longitudinal sections. For visualization, the simulated photostimulation parameters (100 mW/mm2, 10% activation duty cycle) exceed the ones used in the in vivo experiments. d, Distribution of optoelectronic-induced temperature change across the different elements as a function of photostimulation irradiance. e, Maximum temperature increment at the interface between inner nerve and epineurium as a function of irradiance and micro-LED activation duty cycle.
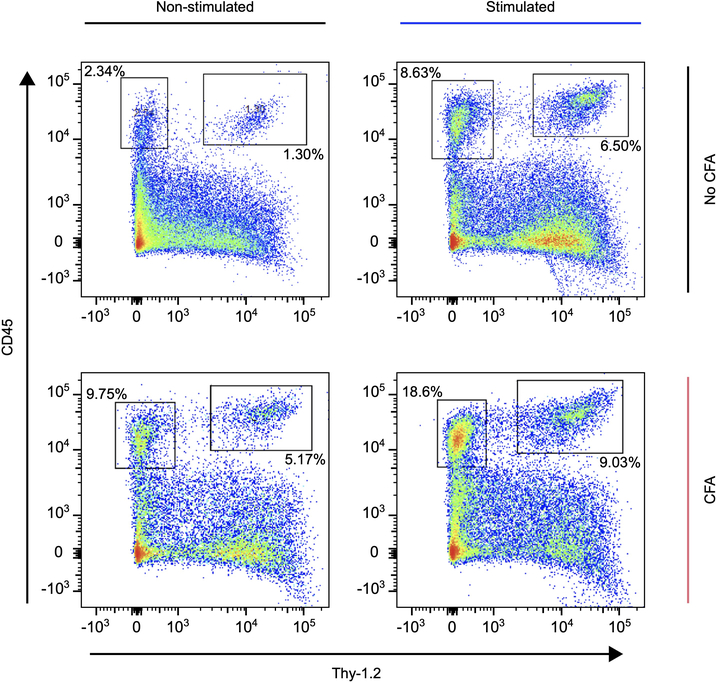
Extended Data Fig. 8: Flow cytometric data extracted from the ipsilateral hindpaw skin with respect to the micro-LED array location.
Pseudo-colorized dot plots showing myeloid (CD45+Thy1.2-) and lymphoid (CD45+Thy1.2+) cell populations depending on experimental protocol (± CFA and ± Stim). Population frequencies of the cells in the boxed regions are shown.
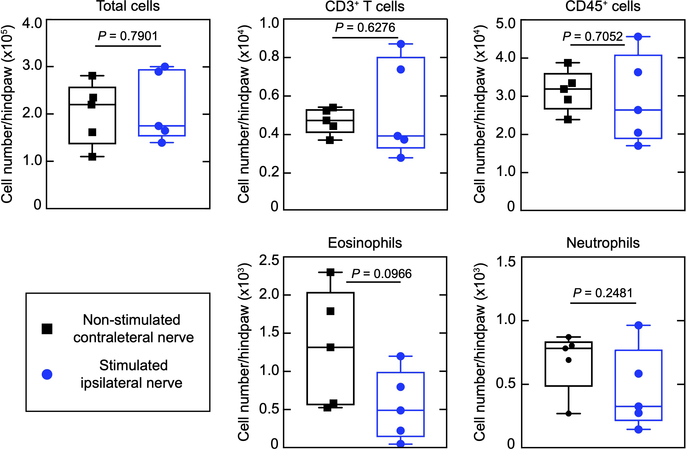
Extended Data Fig. 9: Optogenetic stimulation of TRPV1-Cre–/–::ChR2+/+ mice does not result in cell mobilization in innervated hind paw skin.
Major immune cell population numbers as assessed by flow cytometry. n = 5 animals per group; two-sided unpaired t-test. Symbols represent individual mice analyzed independently. The box plots display the median and interquartile range, ‘+’ denotes the mean, and the extending whiskers, the largest and lowest observations.
Extended Data Fig. 10: Injection of CFA in nociceptor ablated animal paw skin does not result in changes in immune cell numbers.
TRPV1-Cre+/+::DTA+/+ mice were injected with 3μl CFA in left hind paw, and immune cell population numbers were assessed by flow cytometry 3 days later. n = 3 animals per group; two-sided unpaired t-test. All data represented as mean ± s.e.m.
Supplementary Material
Acknowledgements
The authors thank N. Andrews and L. Barrett for technical assistance, Prof. G. Courtine and his team (G-lab, EPFL) for their advice on the surgical procedure, and M. Stoeckel, A. Guillet, V. Ruhaut (Neuronal Microsystems Platform, Wyss Center) for help and advice on microfabrication. Further thanks go to T. Kleier for PCB assembly and device measurement support and M. Zahner for his help with antenna characterization. For funding, we would like to thank a Sir Henry Dale Fellowship jointly funded by the Wellcome Trust and the Royal Society (109372/Z/15/Z, LEB), the European Union’s Horizon 2020 research and innovation program under the Marie Skłodowska-Curie grant agreement (754354, OA), the Bertarelli Foundation (SPL and CJW), the Swiss National Science Foundation (BSCGI0_1578000, SPL), and the NIH (R35NS105076, CJW).
Footnotes
Competing interests
The authors have no competing interests.
References
- 1.Talbot S, Foster SL & Woolf CJ Neuroimmunity: Physiology and Pathology. Annu. Rev. Immunol. 34, 421–447 (2016). [DOI] [PubMed] [Google Scholar]
- 2.Chiu IM, von Hehn CA & Woolf CJ Neurogenic inflammation and the peripheral nervous system in host defense and immunopathology. Nat Neurosci 15, 1063–1067 (2012). [DOI] [PMC free article] [PubMed] [Google Scholar]
- 3.Sharma N et al. The emergence of transcriptional identity in somatosensory neurons. Nature 577, 392–398 (2020). [DOI] [PMC free article] [PubMed] [Google Scholar]
- 4.Boyden ES, Zhang F, Bamberg E, Nagel G & Deisseroth K Millisecond-timescale, genetically targeted optical control of neural activity. Nature Neuroscience 8, 1263–1268 (2005). [DOI] [PubMed] [Google Scholar]
- 5.Xu X, Mee T & Jia X New era of optogenetics: from the central to peripheral nervous system. Critical Reviews in Biochemistry and Molecular Biology 55, 1–16 (2020). [DOI] [PMC free article] [PubMed] [Google Scholar]
- 6.Montgomery KL, Iyer SM, Christensen AJ, Deisseroth K & Delp SL Beyond the brain: Optogenetic control in the spinal cord and peripheral nervous system. Sci. Transl. Med. 8, 337rv5–337rv5 (2016). [DOI] [PubMed] [Google Scholar]
- 7.Montgomery KL et al. Wirelessly powered, fully internal optogenetics for brain, spinal and peripheral circuits in mice. Nat Methods 12, 969–974 (2015). [DOI] [PMC free article] [PubMed] [Google Scholar]
- 8.Park SI et al. Soft, stretchable, fully implantable miniaturized optoelectronic systems for wireless optogenetics. Nat Biotechnol 33, 1280–1286 (2015). [DOI] [PMC free article] [PubMed] [Google Scholar]
- 9.Zhang Y et al. Battery-free, fully implantable optofluidic cuff system for wireless optogenetic and pharmacological neuromodulation of peripheral nerves. Sci. Adv. 5, eaaw5296 (2019). [DOI] [PMC free article] [PubMed] [Google Scholar]
- 10.Mickle AD et al. A wireless closed-loop system for optogenetic peripheral neuromodulation. Nature 565, 361–365 (2019). [DOI] [PMC free article] [PubMed] [Google Scholar]
- 11.Canales A et al. Multifunctional fibers for simultaneous optical, electrical and chemical interrogation of neural circuits in vivo. Nat Biotechnol 33, 277–284 (2015). [DOI] [PubMed] [Google Scholar]
- 12.Keppeler D et al. Multichannel optogenetic stimulation of the auditory pathway using microfabricated LED cochlear implants in rodents. Sci. Transl. Med. 12, eabb8086 (2020). [DOI] [PMC free article] [PubMed] [Google Scholar]
- 13.Burton A et al. Wireless, battery-free subdermally implantable photometry systems for chronic recording of neural dynamics. Proc Natl Acad Sci USA 117, 2835–2845 (2020). [DOI] [PMC free article] [PubMed] [Google Scholar]
- 14.Lu L et al. Wireless optoelectronic photometers for monitoring neuronal dynamics in the deep brain. Proc Natl Acad Sci USA 115, E1374–E1383 (2018). [DOI] [PMC free article] [PubMed] [Google Scholar]
- 15.Kim T. -i. et al. Injectable, Cellular-Scale Optoelectronics with Applications for Wireless Optogenetics. Science 340, 211–216 (2013). [DOI] [PMC free article] [PubMed] [Google Scholar]
- 16.Jeong J-W et al. Wireless Optofluidic Systems for Programmable In Vivo Pharmacology and Optogenetics. Cell 162, 662–674 (2015). [DOI] [PMC free article] [PubMed] [Google Scholar]
- 17.Pinho-Ribeiro FA, Verri WA & Chiu IM Nociceptor Sensory Neuron–Immune Interactions in Pain and Inflammation. Trends in Immunology 38, 5–19 (2017). [DOI] [PMC free article] [PubMed] [Google Scholar]
- 18.Ronchetti S, Migliorati G & Delfino DV Association of inflammatory mediators with pain perception. Biomedicine & Pharmacotherapy 96, 1445–1452 (2017). [DOI] [PubMed] [Google Scholar]
- 19.Ghasemlou N, Chiu IM, Julien J-P & Woolf CJ CD11b + Ly6G − myeloid cells mediate mechanical inflammatory pain hypersensitivity. Proc Natl Acad Sci USA 112, E6808–E6817 (2015). [DOI] [PMC free article] [PubMed] [Google Scholar]
- 20.Marino MJ et al. Botulinum toxin B in the sensory afferent: Transmitter release, spinal activation, and pain behavior: Pain 155, 674–684 (2014). [DOI] [PMC free article] [PubMed] [Google Scholar]
- 21.Lewin GR, Lisney SJW & Mendell LM Neonatal Anti-NGF Treatment Reduces the Aδ- and C-Fibre Evoked Vasodilator Responses in Rat Skin: Evidence That Nociceptor Afferents Mediate Antidromic Vasodilatation. European Journal of Neuroscience 4, 1213–1218 (1992). [DOI] [PubMed] [Google Scholar]
- 22.Cohen JA et al. Cutaneous TRPV1+ Neurons Trigger Protective Innate Type 17 Anticipatory Immunity. Cell 178, 919–932.e14 (2019). [DOI] [PMC free article] [PubMed] [Google Scholar]
- 23.Wallrapp A et al. The neuropeptide NMU amplifies ILC2-driven allergic lung inflammation. Nature 549, 351–356 (2017). [DOI] [PMC free article] [PubMed] [Google Scholar]
- 24.Riol-Blanco L et al. Nociceptive sensory neurons drive interleukin-23-mediated psoriasiform skin inflammation. Nature 510, 157–161 (2014). [DOI] [PMC free article] [PubMed] [Google Scholar]
- 25.Patil MJ, Hovhannisyan AH & Akopian AN Characteristics of sensory neuronal groups in CGRP-cre-ER reporter mice: Comparison to Nav1.8-cre, TRPV1-cre and TRPV1-GFP mouse lines. PLoS ONE 13, e0198601 (2018). [DOI] [PMC free article] [PubMed] [Google Scholar]
- 26.Makadia PA et al. Optogenetic Activation of Colon Epithelium of the Mouse Produces High-Frequency Bursting in Extrinsic Colon Afferents and Engages Visceromotor Responses. J. Neurosci. 38, 5788–5798 (2018). [DOI] [PMC free article] [PubMed] [Google Scholar]
- 27.Cavanaugh DJ et al. Trpv1 Reporter Mice Reveal Highly Restricted Brain Distribution and Functional Expression in Arteriolar Smooth Muscle Cells. Journal of Neuroscience 31, 5067–5077 (2011). [DOI] [PMC free article] [PubMed] [Google Scholar]
- 28.Storozhuk MV, Moroz OF & Zholos AV Multifunctional TRPV1 Ion Channels in Physiology and Pathology with Focus on the Brain, Vasculature, and Some Visceral Systems. BioMed Research International 2019, 1–12 (2019). [DOI] [PMC free article] [PubMed] [Google Scholar]
- 29.Schonle P, Fateh S, Burger T & Huang Q A power-efficient multi-channel PPG ASIC with 112dB receiver DR for pulse oximetry and NIRS. in 2017 IEEE Custom Integrated Circuits Conference (CICC) 1–4 (IEEE, 2017). doi:10.1109/CICC.2017.7993704. [Google Scholar]
- 30.Nikolic K et al. Photocycles of Channelrhodopsin-2. Photochemistry and Photobiology 85, 400–411 (2009). [DOI] [PubMed] [Google Scholar]
- 31.Michoud F et al. Optical cuff for optogenetic control of the peripheral nervous system. J. Neural Eng. 15, 015002 (2018). [DOI] [PubMed] [Google Scholar]
- 32.Browne LE et al. Time-Resolved Fast Mammalian Behavior Reveals the Complexity of Protective Pain Responses. Cell Reports 20, 89–98 (2017). [DOI] [PMC free article] [PubMed] [Google Scholar]
- 33.Daou I et al. Remote Optogenetic Activation and Sensitization of Pain Pathways in Freely Moving Mice. Journal of Neuroscience 33, 18631–18640 (2013). [DOI] [PMC free article] [PubMed] [Google Scholar]
- 34.Cornett PM, Matta JA & Ahern GP General Anesthetics Sensitize the Capsaicin Receptor Transient Receptor Potential V1. Mol Pharmacol 74, 1261–1268 (2008). [DOI] [PubMed] [Google Scholar]
- 35.Prabhakar A, Vujovic D, Cui L, Olson W & Luo W Leaky expression of channelrhodopsin-2 (ChR2) in Ai32 mouse lines. PLoS ONE 14, e0213326 (2019). [DOI] [PMC free article] [PubMed] [Google Scholar]
- 36.Cavanaugh DJ et al. Distinct subsets of unmyelinated primary sensory fibers mediate behavioral responses to noxious thermal and mechanical stimuli. Proceedings of the National Academy of Sciences 106, 9075–9080 (2009). [DOI] [PMC free article] [PubMed] [Google Scholar]
- 37.Huang X et al. Materials Strategies and Device Architectures of Emerging Power Supply Devices for Implantable Bioelectronics. Small 16, 1902827 (2020). [DOI] [PubMed] [Google Scholar]
- 38.Zheng H et al. A shape-memory and spiral light-emitting device for precise multisite stimulation of nerve bundles. Nat Commun 10, 2790 (2019). [DOI] [PMC free article] [PubMed] [Google Scholar]
- 39.Maimon BE, Sparks K, Srinivasan S, Zorzos AN & Herr HM Spectrally distinct channelrhodopsins for two-colour optogenetic peripheral nerve stimulation. Nat Biomed Eng 2, 485–496 (2018). [DOI] [PubMed] [Google Scholar]
- 40.Schonle P et al. A Multi-Sensor and Parallel Processing SoC for Miniaturized Medical Instrumentation. IEEE J. Solid-State Circuits 53, 2076–2087 (2018). [Google Scholar]
- 41.Mcintosh RL & Anderson V A comprehensive tissue properties database provided for the thermal assessment of a human at rest. Biophys. Rev. Lett. 05, 129–151 (2010). [Google Scholar]
- 42.Dong N et al. Opto-electro-thermal optimization of photonic probes for optogenetic neural stimulation. J. Biophotonics 11, e201700358 (2018). [DOI] [PubMed] [Google Scholar]
Associated Data
This section collects any data citations, data availability statements, or supplementary materials included in this article.
Supplementary Materials
Data Availability Statement
Raw data that supports the findings of this study will be made available upon request to the corresponding authors.


