

Abstract
BACKGROUND & AIMS
The enteric nervous system (ENS) coordinates essential intestinal functions through the concerted action of diverse enteric neurons (EN). However, integrated molecular knowledge of EN subtypes is lacking. To compare human and mouse ENs, we transcriptionally profiled healthy ENS from adult humans and mice. We aimed to identify transcripts marking discrete neuron subtypes and visualize conserved EN subtypes for humans and mice in multiple bowel regions.
METHODS
Human myenteric ganglia and adjacent smooth muscle were isolated by laser-capture microdissection for RNA-Seq. Ganglia-specific transcriptional profiles were identified by computationally subtracting muscle gene signatures. Nuclei from mouse myenteric neurons were isolated and subjected to single-nucleus RNA-Seq (snRNA-Seq), totaling over four billion reads and 25,208 neurons. Neuronal subtypes were defined using mouse snRNA-Seq data. Comparative informatics between human and mouse datasets identified shared EN subtype markers, which were visualized in situ using hybridization chain reaction (HCR).
RESULTS
Several EN subtypes in the duodenum, ileum, and colon are conserved between humans and mice based on orthologous gene expression. However, some EN subtype-specific genes from mice are expressed in completely distinct morphologically defined subtypes in humans. In mice, we identified several neuronal subtypes that stably express gene modules across all intestinal segments, with graded, regional expression of one or more marker genes.
CONCLUSIONS
Our combined transcriptional profiling of human myenteric ganglia and mouse EN provides a rich foundation for developing novel intestinal therapeutics. There is congruency among some EN subtypes, but we note multiple species differences that should be carefully considered when relating findings from mouse ENS research to human GI studies.
Keywords: enteric nervous system (ENS), RNA Sequencing (RNA-Seq), single-nucleus RNA-Seq, in situ hybridization chain reaction (HCR)
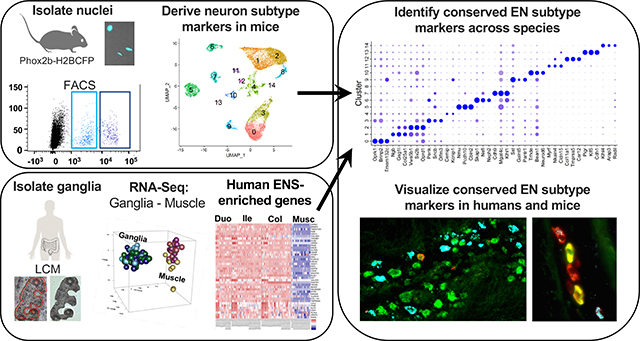
Graphical Abstract
INTRODUCTION
Gastrointestinal motility, osmotic and pH balance, vasodilation, and secretion are all essential functions coordinated by the ENS. These activities are mediated by a diverse array of neurons, outnumbering those in the spinal cord, that are clustered within interconnected ganglia that extend in a continuous network the length of the gastrointestinal tract.
Despite various efforts, understanding of human EN diversity is limited. Extensive studies relying on morphological and immunohistochemical characterization have established an initial framework of EN subtypes and identified to date at least nine major neuron classes within human myenteric ganglia1, 2. However, only a handful of immunohistochemical markers label distinct neuron types and even fewer label subtypes reliably across species (i.e. CHAT, NOS1, VIP)1. Because EN morphology is not well-conserved between species, our ability to translate research between humans and rodent models has been constrained. Moreover, prior use of diseased or aged human intestinal tissue has not fulfilled the need for a clinical gold-standard atlas detailing the normal composition and distribution of neuronal subtypes in healthy, young adults.
Rodent models have offered greater access to the inner workings of the ENS and the neuron subtypes mediating its functions. Individual genes that cause discrete deficiencies in ENS development, like Hirschsprung disease or those associated with gastrointestinal motility phenotypes, have been identified by homologous gene knockout or genetic mapping3–5. Additionally, the availability of rodent tissues across the lifespan has provided a rich picture of EN diversity. At least 15 murine subtypes have been readily distinguished by immunohistochemistry, with 13 being observed in the myenteric plexus6, 7. Importantly, some mouse EN types exhibit similarities with those of humans1.
EN with the most consistent morphology between humans and rodents are classified as Dogiel type I and II. Type I EN are motor neurons consisting of two distinct classes, including nitrergic inhibitory neurons and excitatory cholinergic neurons. Each subtype comprises ~5–10% of all ENs within the myenteric plexus. Type II neurons, also known as Intrinsic Primary Afferent Neurons (IPANs), are an important class of sensory neurons and interneurons that coordinate gastrointestinal motility and secretion, accounting for ~10% of all human myenteric neurons8. IPANs have smooth cell bodies, several long, uniformly branching axons, and no dendrites9. However, few selective molecular markers have been established for type I and type II ENs in mice6 and even fewer are known for humans.
Other classes of human EN (type III – IX) and their corresponding marker genes are less consistent across species. Human type III neurons have one axon with many branched dendrites and are labeled by Calbindin 1 (CALB1), but in rodents, Calb1 labels a small subset of type II neurons2. The closest counterpart to human type III neurons are classified as “filamentous”2, 6. In another example of cross-species differences, somatostatin (Sst) selectively labels filamentous neurons in mice, while in humans, SST labels type II neurons and other subtypes6.
To bridge the gap in comparing analogous neuron subtypes between humans and other species, major efforts are needed to profile EN at single-cell resolution. Such endeavors have been hampered by the difficulty of isolating intact neurons from the intestine of adult mammalian species. EN are either sandwiched between the outer muscle layers of the gut wall or buried in the submucosa. Recent advances have been made in profiling pools of EN and glia using bulk sequencing from fetal mice10, when neuronal processes are less-developed and cells survive tissue dissociation. Most recently, single-cell gene expression profiles of ~1100 ENs have been generated from postnatal mice around weaning7, 11. Because some EN are generated postnatally and ENS maturation occurs during adolescence, such profiles are unlikely to fully capture adult EN gene diversity12, 13. Here, we profiled adult mouse EN and human myenteric ganglia from the duodenum, ileum, and colon. With these efforts, we sought to: 1- molecularly define myenteric neuron subclasses across multiple regions of the human and mouse intestine, 2- compare genes that mark neuron subclasses between humans and mice, and 3- identify segment-specific markers for neuronal subtypes. We discovered several previously uncharacterized EN subtypes in humans and identified regionally expressed EN markers conserved between humans and mice. The resulting atlas offers a foundation for future mechanistic studies of gene function and drug targeting, with potential to identify the etiology of ENS-related gastrointestinal diseases.
METHODS
Animals
All experimental protocols were approved by the Institutional Animal Care and Use Committee at Vanderbilt University. Tg(Phox2b-HIST2H2BE/Cerulean)1Sout mice (MGI: 5013571), hereafter Phox2b-CFP, were bred to C57BL6/J and adult progeny of both sexes at 6–7.5 weeks of age were used. All mice were housed in a modified barrier facility on a 14-hour on, 10-hour off light cycle in high density caging (Lab Products Inc., #10025) with standard diet (Purina Diet #5L0D) and water ad libitum.
Human tissue
This study was approved by the Vanderbilt University Institutional Review Board and classified as non-human subjects research. All tissue samples were received from postmortem, de-identified organ donors aged 18–35 years lacking documented gastrointestinal diseases (Figure 1A; Table S1). Gastrointestinal tissue harvest included duodenum (~8cm) just distal to the pancreatic duct, ileum (~20cm) proximal to the appendix, and colon (~20cm) straddling the center of the transverse colon.
Figure 1.

LCM RNA-Seq of healthy human enteric ganglia identifies commonly expressed genes across all intestine segments.
(A) Demographic plot of intestinal tissue donors.
(B) Human ganglia samples cluster distinctly from those of muscle in 3-D PCA space.
(C) Venn Diagram illustrates differentially expressed genes between enteric ganglia and muscle when comparing expression between all intestine regions.
(D) Volcano plot of differentially expressed genes between human colon and small intestine, with the top10 most up/downregulated genes annotated based on log2FC. (E) Most highly upregulated genes and GO terms (F) in myenteric ganglia relative to muscle, ranked by log2FC.
Laser-Capture Microdissection (LCM)
Human tissue was sectioned at 10-mm and processed via laser-capture microdissection (LCM) on an ArcturusXT system (ThermoFisher Scientific Waltham, MA) for RNA, as described previously14. Samples with RNA integrity values greater than 6.8 were submitted for library construction and sequencing. In total, 111 myenteric ganglia samples from intestinal tissues were successfully sequenced from 15 donors (pooled from 1–3 LCM caps worth of ganglia) with 27 intestinal muscle samples isolated from three donors.
Preparation of single-nuclei suspensions
Mouse intestinal muscle laminar strips containing the myenteric plexus were peeled away from the submucosa on ice while submerged in DPBS with Mg2+ and Ca2+. Tissue was minced in ice-cold DPBS and pelleted by centrifugation. Nuclei were isolated using the NucleiEZ nuclei isolation kit (Sigma), with modifications described in Supplemental Methods.
Nuclei isolation from ENs
Nuclei were isolated by fluorescence-activated cell sorting (FACS) on a BD FACSAria III using a 100μm nozzle at 17 psi. Nuclei were first separated from cellular debris using forward and side scatter pulse geometry gating with doublet discrimination. Neuronal nuclei were gated for 7AAD+ and high intensity of CFP from the Phox2b-CFP reporter (Fig. 2A, bright neuronal populations)15, whereas dim glial populations were excluded.
Figure 2.

Neuron-specific genes identified via RNA-Seq of bulk adult mouse EN and glia.
(A) FACS separation of Phox2b-H2BCFP+ nuclei sorted for bulk RNA-Seq. Bright population is neuronal; dim is glia.
(B-D) Volcano plots show differential gene expression in EN relative to enteric glia for each intestinal segment.
(E-G) Top 10 most-upregulated transcription factors.
(H-J) Top 10 most-upregulated receptors.
snRNA-Seq encapsulation and sequencing
Single nuclei were encapsulated using both 10X Genomics (Pleasanton, CA) and inDrop (1CellBio, Watertown, MA). For generation of 10X libraries, nuclei were encapsulated using version 3 Chromium Single Cell 3’ library reagents. Libraries were sequenced using a Nova-seq 6000 or Nextseq 500 and a paired-end 50 bp sequencing flow cell at a total depth of 3.6 Billion reads across nine 10X runs On the inDrop platform (1CellBio), nuclei were encapsulated and libraries were prepared using a modified version of Cel-Seq (Supplemental Methods). The combined total read depth from all 6 inDrop samples amounted to 550 million reads.
Bulk RNA-Seq: cDNA library preparation and sequencing
Libraries were constructed from total human RNA or flow-sorted mouse nuclei using the Takara SMARTer kit per manufacturer’s protocol. Sequencing was performed on a HiSeq3000 or NovaSeq as 1×50bp or 1×100bp single-end reads, respectively. Human samples were sequenced to a mean depth of ~75 million reads with a mean total alignment rate of 98.12% for a total of over 11 billion reads. Eleven mouse EN and glia samples were sequenced from the duodenum, ileum, and colon, each having a mean depth of approximately 138 million reads and a mean alignment rate of 99.01%.
Bulk RNA-Seq data processing
Base calls and demultiplexing were performed with Illumina’s bcl2fastq software. RNA-Seq reads were aligned to the Ensembl release 76 human or mouse assemblies with STAR version 2.0.4b. Gene counts were derived from all uniquely aligned, unambiguous reads by Subread:featureCount version 1.4.5. Isoform expression of known Ensembl transcripts were estimated with Sailfish version 0.6.13. Differential expression was performed using edgeR in conjunction with Limma-Voom. Full details in Supplemental Methods.
snRNA-Seq data analysis
The sequencing output FASTQs were processed with CellRanger 3.0.2 using a modified mm10 reference enabling intron quantification to obtain a gene-cell data matrix. For inDrop, reads were filtered, sorted by their designated barcode, and aligned to the reference transcriptome (intron + exon) using DropEST pipeline (STAR). Mapped reads were quantified into UMI-filtered counts per gene. Raw matrix files were processed and analyzed using the R-package, Seurat (version 3) [Butler 2018]. The total number of snRNA-Seq runs merged from each mouse intestinal segment included: duodenum: 4, ileum: 6, and colon: 6 (overview: Figure S1). Data were batch-corrected and processed as described in Supplemental Methods. In total, 25,208 neuronal nuclei were successfully sequenced and passed quality control steps from a total of 15 snRNA-Seq runs.
Fluorescence in situ hybridization and microscopy
In situ HCR version 3 was applied to visualize candidate markers for EN subtypes in human and mouse intestinal tissue using manufacturer protocols (https://www.molecularinstruments.com/). Probes were purchased from Molecular Instruments or were synthesized using OligoMiner 16. HCR was performed as described17, using tissue samples from the duodenum, ileum, and colon on multiple tissue samples from multiple human donors. Before coverslipping, samples were treated with TrueBlack® dye to quench lipofuscin autofluorescence18 (Supplemental Methods). Images were generated using a Leica DMI6000B microscope.
RESULTS
Transcriptome catalog of human ENS genes from healthy young adult myenteric plexus
To capture baseline transcriptional profiles for total EN from healthy human intestine, we applied RNA-Seq to LCM material from myenteric ganglia and adjacent smooth muscle for both sexes and multiple ethnicities (Figure 1A). Tight clustering of sample replicates for EN and intestinal muscle with principal component analysis (PCA) indicated high data quality with absence of outliers (Figure 1B) and consistent patterns of gene expression within myenteric ganglia throughout the intestine. We compared transcriptional signatures from myenteric ganglia with those of adjacent smooth muscle in each bowel region to derive an EN-specific transcriptome catalog by identifying genes expressed at significantly greater levels in myenteric ganglia relative to intestinal muscle (p-adj≤0.05, Figure 1C). This approach detected 5,242 genes differentially expressed relative to muscle and stably expressed across the entire intestine (Figure 1D). Among this list, genes with the most highly up-regulated expression in the ENS included well-known EN markers: PENK, NF, and ELAVL4 (Figure 1E, Table S2). Additionally, the most significant gene ontology (GO) biological functions for this gene list relate to the nervous system (Figure 1F). These results provide strong evidence we have successfully generated a comprehensive transcriptome catalog of the ENS from healthy human adults.
Segment-specific expression of genes enriched in myenteric ganglia was also detected for thousands of genes (Figure 1C). Separate analyses identified differential gene expression between the small intestine and colon for 254 genes, which also had selective expression in ganglia relative to muscle (Figure 1D).When examining differences in gene expression between the small intestine and colon, several genes showed substantial regional expression differences in ganglia, including CCKAR, POU3F3, and HOX3A suggesting potential region-specific ENS functions.
Bulk RNA-Seq of Phox2b+ neuronal and glial nuclei identifies transcription factors and receptors expressed in EN
To derive a comparable resource from adult mouse ENS for comparison with human ENS gene signatures, we collected nuclei from the myenteric plexus of Phox2b-CFP transgenic mice from all intestinal segments based on sorting for CFP intensity to separately isolate EN and glia (Figure 2A). Nuclear integrity and cell-type-specific gene expression were assessed by RT-PCR in FACS-purified nuclei pools, prior to RNA-Seq. Sorted nuclei were intact and exhibited excellent retention of gene signatures specific to EN or glia (Figure S1). Pools of nuclei from ENs or glia were then sequenced from each segment of the intestine, leading to the identification of differentially expressed genes (Figure 2B–J, Tables S3–5). Some of the most highly up-regulated genes expressed in neurons from all segments included Gcgr, Slc35d3, Scl26a4, Dnah11, Oprk1, and Sst. Similarly, the most highly up-regulated glial genes across gut segments included S100b, Prkca, Gpt2, Fads1, Ndrg1, and Limd1. We estimate that ~40% of all genes enriched in neurons relative to glia are shared across all gut segments. This analysis also identified numerous transcription factors and receptors for each intestinal segment that are highly up-regulated in mouse EN (Figure 2E–J).
snRNA-Seq from adult mouse duodenum, ileum, and colon identifies EN subtypes with some differences in regional prevalence
To define subtype-specific EN gene signatures for adult mice, nuclei were flow-sorted, encapsulated, and processed for snRNA-Seq. Initially, data from each gut segment were kept separate and aggregated into regional datasets for duodenum, ileum, and colon (Figure 3, Figure S2). Overall, the number of EN clusters resolved were similar for all three gut segments with relatively similar proportions of nuclei within the main clusters. When separately analyzing EN from each gut region, slight differences in cluster numbers appeared attributable to differences in the total nuclei encapsulated per gut region. We determined the two most specific marker genes for each cluster to initially assess the similarity of EN clusters between gut regions (Figure 3E–G). This analysis revealed that many genes are shared between seemingly related clusters across all three regions (i.e. Meis2, Ebf1, and Trhde, and others not shown) suggesting similarity of EN types along the entire bowel.
Figure 3.

Visualization of mouse myenteric neuron subtypes by snRNA-Seq.
(A-C) UMAP visualization of clusters detected in distinct intestinal regions.
(E-G) Dot plots showing the top two most cluster-specific marker genes and pan-neuronal markers across clusters.
To further assess the similarity of EN types in each intestinal region and relate cluster identity to markers expressed by known functional EN classes, we merged 10X snRNA-Seq datasets (Supplemental Methods). Merged nuclei separated into 15 distinct clusters that exhibited expression of neuronal genes Elavl4 and Snap25 (Figure 4B; Figure S3) after removing a small cluster that lacked neuronal markers and exhibited glial character, consistent with known Phox2b expression patterns15. Based on known immunohistochemical markers for the 13 defined functional/morphological classes of myenteric neurons in mice6, 7, we assigned putative identities for all 13 subtypes within our snRNA-Seq clusters (Supplemental Methods). These included IPANs, descending interneurons, excitatory and inhibitory muscle motor neurons, and small populations of serotonergic and intestinofugal neurons (Figure S3D–H). Notably, expression of the essential serotonergic gene, Tph2, was only observed in ~0.2% of neurons and was conspicuously not localized to a particular cluster, whereas the serotonin reuptake transporter, Sert was distinctly localized to a subset of cluster 6, which also co-expressed the monoamine vesicle transporter Vgat2 (Figure S3F–G). Intestinofugal neurons represent ~0.3% of EN in guinea pigs and had previously not been detected in mice, although they are presumed to reside in myenteric ganglia6. These EN express a range of neuropeptides, consistent with expression observed in a cluster 7 subpopulation (Figures S12E, S5C). Notably, several of these subtypes appeared to be restricted to particular intestinal regions, based on the proportions of neurons derived from each bowel segment in clusters 7, 9, and 10 (Figure S3A–B). Neurons in cluster 7 (Chat/Nefl/Cdh9) and 10 (Nos1/Chat/Gad2) had proportionally many more neurons derived from the small intestine while cluster 9 (Sst/Th+/−) had the greatest proportional contribution of neurons from the colon.
Figure 4.

Genes marking neuron clusters in mouse identify human neuronal subtypes.
(A) UMAP plot displays 15 distinct clusters detected in merged mouse snRNA-Seq data from all gastrointestinal regions with example genes marking discrete clusters.
(B) Dot Plot showing top three expressed genes from each snRNA-Seq cluster.
(C) Heatmap of gene expression across all donor ganglia and intestinal muscle samples, showing the expression of each marker gene, arranged by segment.
(D) Nmu and Klhl1 expression visualized by HCR FISH mark distinct EN subtypes in adult mice and (E) human myenteric plexus sections.
Arrowheads mark Klhl1+neurons. Arrows indicate exclusively Nmu+ neurons. Snap25 (green, pan-neuronal).
We next examined classification of clusters that were not readily assigned to previously characterized EN subtypes, including clusters 4, 8, and 11–14. We considered the possibility that these clusters might be non-neuronal. However, KEGG functions examined for cluster-specific marker gene lists each contained multiple significant terms relating to the nervous system (Figure S4A). The single-cell mouse cell atlas program (scMCA)19 also predicted that all clusters were neuronal with moderately high confidence, except for clusters 11 and 14, which exhibited strong predictions for mesenchymal and vascular/immune cell types (Figure S4F), that may coincide with a recently reported mesenchymal lineage from vagal neural crest20. Further examination of these clusters showed robust expression of the early-neuronal genes Elavl4 and Prph (Figure S4B). Cluster 12 expressed Sox10, a gene that marks ENS progenitors; although the progenitor marker, Nestin, was infrequently expressed in cluster 12 and was sporadically expressed in nuclei throughout all clusters (Figure S4C–D). Cycling cells (Top2a+, Figure S4E) were also sparse throughout all clusters, with only moderate expression in cluster 13. We designate these clusters as functionally “unassigned” until further characterization can be pursued.
During our analysis of EN cluster gene expression, it became apparent that several clusters could be further subdivided, some of which were differentially distributed between intestinal regions. Specifically, clusters 5–7, 9, and 10 exhibited non-uniform expression of known EN subtype markers including Calb1, Calb2, and Vip (Figure S5). This evidence suggests that these sub-clusters may represent up to eight distinct EN subtypes based on known EN markers6 (Figure S5). Altogether, we estimate that there are up to 22 EN subtypes in the mouse myenteric plexus across all intestinal regions.
Selection of cluster-specific mouse EN subtype markers
To assess conservation of EN subtypes between species, we sought to identify cluster-specific marker genes for adult mouse EN that were also expressed in human EN. First, we selected highly expressed genes from the 15 initial clusters detected in our mouse snRNA-Seq data among all bowel regions. We prioritized genes that were highly expressed in a single cluster, present within a high percentage of nuclei within that cluster, and minimally expressed in other EN clusters. From this gene set, we retained those that were highly expressed in human myenteric ganglia LCM/RNA-Seq data and minimally present in human intestinal muscle or enteric glia (overviewed in Figure S3C). This approach identified several high-scoring markers for most of the mouse EN clusters (Figure 4, Table S6). Notably, we observed that three exceptional EN clusters (5, 6 and 7) had many markers that were highly scored by the above criteria. These clusters were assigned an identity of intrinsic primary afferent neurons (IPANs) based on their expression of known mouse IPAN markers, including Nefl, Calcb, and Calb1/Calb2 (Figure S3D,H)6.
Conservation of IPAN markers between humans and mice
Because IPANs are not well-characterized in humans, we investigated the expression of the putative IPAN markers identified from mouse snRNA-Seq using HCR for in situ localization17. As a prerequisite for selecting neuron-specific marker probes, we further excluded any cluster-specific genes with high expression in enteric glia and other cells of the bowel wall (Supplemental Methods). Multiple high-scoring marker genes remained for clusters 5, 6 and 7, including Nmu (cluster 5), Klhl1 (6 and 7), Nxph2 (cluster 6), and Cdh9 (cluster 7). We applied HCR to visualize the most highly scored IPAN subtype markers, Nmu and Klhl1, in mouse and human intestinal tissue. Consistent with the cluster-specific expression seen in our mouse snRNA-Seq data, probes for Nmu and Klhl1 labeled distinct EN subtypes in mice (Figure 4D), while orthologous NMU and KLHL1 probes in human duodenum, ileum, and colon similarly labeled distinct EN (Figure 4E, Figure S6C–D). We further applied HCR to detect additional genes co-expressed in cluster 5 (Nmu+) in mice, including Dlx3 and Otof (Figure S6). In both mice and humans, we documented coexpression of DLX3 and OTOF in NMU+ EN (Figure S6E–H). Our results illustrate similarities of gene expression for this subtype in mice and humans; however, we noted that OTOF and DLX3 are more broadly expressed, being present in NMU-negative EN of humans (Figure S6F,H).
Nmu and Klhl1 mark IPANs in mice, while in humans, only NMU labels IPANs
Nmu is known to label guinea pig IPANs and a recent study has confirmed this in mice based on co-localization with the established IPAN markers Calb2 and Calcb 6, 7. Our finding of Nmu in mouse IPANs is consistent with these studies, although to our knowledge NMU has been untested in the human ENS. Further, we also identified Klhl1 as a novel marker of IPANs in mice. We established that Klhl1 labels type II neurons (IPANs) in the myenteric plexus of mice using Nefl for co-labeling6 (Figures 5A–B) and documented strong, localized expression of Klhl1 within Nefl+ EN. An IPAN identity for Klhl1+ (cluster 6) myenteric neurons in mice is further supported by a recent report of type II morphology and connectivity for Klhl1+ neurons7. We subsequently assessed the expression of NMU and KLHL1 in human myenteric ganglia. Human IPANs are defined by co-expression of Somatostatin (SST) and CALB2, although each marker labels other EN types and it is known ~7% of SST/CALB2+ neurons are not IPANs8. We show that NMU labels duodenal, ileal, and colonic human IPANs (Figure 5, Figure S7). Approximately 50–70% of human IPANs co-expressed NMU in the small intestine (85 total IPANs in small intestine from 4 specimens), with slight variations between donors and depending on the position of the tissue section within the ganglia. Unexpectedly, fewer IPANs expressed NMU in the colon (~5–10% of 58 IPANs observed from 3 specimens, Figure S7), leading us to anticipate that the remaining NMU[−] IPANs would express KLHL1. However, despite repeated attempts, we did not detect KLHL1 expression in any IPANs along human intestine based on SST/CALB2 labeling (Figure 5D, Figure S7C–D).
Figure 5.

Mouse IPAN markers label multiple neuron types in human ENS sections.
(A) Expression of mouse IPAN marker Nefl marker in snRNA-Seq dot plot labels clusters 6 and 7 concurrent with subtype marker genes Klhl1, Kcnh7, Nxph2, and Cdh9.
(B) HCR-FISH confirms co-expression of Klhl1 with Nefl+ IPANs (arrowhead) in mice.
(C) Human NMU expression localizes with many IPANs (SST+/CALB2+; arrowheads) but not all (arrow). Some human NMU+ neurons are not IPANs (asterisk).
(D) Human KLHL1 expression (arrowheads) is distinct from IPANs (SST+/CALB2+, arrow).
(E) KCNH7 colocalizes with many KLHL1+ neurons (arrowheads), including some NOS1+ neurons.
(F) HCR-FISH confirms Cdh9 (arrowheads) and Nxph2 (arrows) are expressed in distinct IPAN subtypes.
(G) NXPH2 is co-expressed with KLHL1+ ENs (arrowheads) in human ileum.
(H) CDH9 is expressed in KLHL1+ neurons (arrowheads) and some KLHL1[−] neurons in human ileum.
KLHL1 labels a discrete, non-IPAN subtype among human myenteric neurons
We further investigated whether KLHL1 is part of a conserved set of subtype marker genes in human IPANs, or whether it labels completely different EN subtypes across species, like CALB11, 6. To this end, we examined the expression of KCNH7 in KLHL1+ neurons of the human intestine, because Kcnh7 is co-expressed with Klhl1 in EN clusters 6 and 7 of mice. In situ HCR labeling showed that KLHL1 and KCNH7 are co-expressed in a discrete population of myenteric neurons (Figure 5E). Although Klhl1 and Kcnh7 were highly co-incident in mice based on snRNA-Seq data, expression of KLHL1 and KCNH7 in human myenteric neurons did not completely co-localize within EN and were observed in a much larger proportion of EN than in mice. We further examined whether KCNH7 might label human IPANs more effectively than KLHL1, but similarly did not identify any KCNH7 expression in IPANs based on labeling with SST/CALB2 (Figure S7E). These observations indicate that although KLHL1 and KCNH7 do not label human IPANs, they mark a completely distinct EN subtype.
Given the coincident expression of KLHL1 and KCNH7, we further evaluated the novel KLHL1+ subtype(s) among human EN. In mice, Nxph2 and Cdh9 discretely labeled Klhl1+ neurons of clusters 6 and 7, respectively (Figure S7F–G), and colocalized with the mouse IPAN marker, Nefl, by HCR (Figure 5F). Consistent with our findings in mice, CDH9 and NXPH2 labeled human KLHL1+ neurons throughout all intestinal regions (Figures 5G–H, Figures S7H–J, S8A-C). However, CDH9 and NXPH2 were also expressed in human EN lacking KLHL1 expression and some specimens exhibited colocalization of CDH9 and NXPH2 in contrast to labeling distinct subtypes in mice (Figure S7). KLHL1+ neurons in humans also appeared to be expressed in a variety of neuron types with a wide range of NOS1 expression, in contrast to Klhl1+ ENs in mice that are mostly Nos-negative (Figure S7). Overall, we conclude that CDH9 and NXPH2 are conserved markers for subtypes of KLHL1+ neurons between species. While we observed similar numbers of these neurons, CDH9 and NXPH2 do not exclusively mark human KLHL1+ neurons as in mice.
To clarify the cellular identity of human KLHL1+ ENs, we examined the possibility that KLHL1 expression labels type III neurons. In humans, type III neurons are observed in the small intestine and are strongly labeled by CALB1. However, CALB1 is not entirely exclusive to human type III neurons, as a small proportion of type II and sporadic type I ‘spiny’ and ‘stubby’ neurons also stain for CALB1 2. We observed the majority of CALB1+ neurons in the duodenum and ileum strongly express KLHL1 (Figure 6, Figure S8), suggesting that KLHL1 is a type III neuron marker in the small intestine. Prior work has shown that CALB1 labels a yet-unclassified subtype of EN in the human colon 2. Using HCR, we consistently found that the majority of CALB1+ neurons in human colon expressed KLHL1+ (Figure 6B) and that NXPH2 was co-expressed in all CALB1+ neurons of human colon, analogous to mice (Figure 6). However, unlike mice, CDH9 expression was not observed in KLHL1+/CALB1+ neurons of the human colon (Figures S7G, S8C). In contrast to prior reports, we detected fewer CALB1+ neurons in the colon with HCR, compared with prior CALB1 antibody labeling in human colon2, which might be attributable to the high stringency of HCR relative to the potential cross-reactivity with antibodies. We illustrate and summarize our findings of IPAN subtype marker comparisons between mice and humans in Figure 6C. Type II EN in mouse cluster 5 (Nmu+) and in humans appear to share the same marker genes 1, 6. However, the genes that mark mouse clusters 6 and 7 (Klhl1, Kcnh7, Nxph2, and Cdh9), do not label human type II EN and instead are present in (CALB1+) type III neurons.
Figure 6.

Dichotomous expression of mouse IPAN markers compared to human ENS.
(A) In human ileum sections CALB1+ (type III neuron marker) co-localizes with KLHL1 (arrowheads). Contrasting with mouse, NXPH2 rarely localized with KLHL1 or CALB1 (arrow).
(B) Co-expression of CALB1, KLHL1, and NXPH2 marks a distinct human EN subtype in colon.
(C) Summary of the cross-species comparisons for subtypes of ENs examined here.
Regionally expressed neuronal subtype markers in humans and mice
Our comprehensive study design allowed us to examine which neuron subtypes are present along the entire intestine and whether any subtypes are restricted to specific regions. Moreover, we were able to assess whether EN subtypes present throughout the entirety of the intestine can exhibit graded expression of distinct marker genes in different bowel regions. This possibility was first confirmed using our mouse snRNA-Seq data, which revealed multiple subtype-specific genes have regional expression patterns (Figure S9). Regionally expressed genes in mouse EN subtypes raised the possibility that human EN subtypes could share similar region-specific expression. We subsequently identified regionally expressed genes in human myenteric ganglia that were expressed in mouse EN subtypes (Supplemental Methods, Figures 7A–C, S10A–C, Table S7), including CCKAR, RBP4, WIF1, SYT15, POU3F3, and NEUROD6. However, most regional expression patterns were not shared between species.
Figure 7.

Cross-species comparison of regionally expressed genes in myenteric neuron subtypes.
(A) Dot plot illustrating regionally expressed genes for each cluster from mouse snRNA-Seq data merged from all intestinal segments.
(B) Heatmap displaying mouse genes from A ordered by the segment with highest expression.
(C) Heatmap of human ortholog expression from myenteric ganglia.
(D-E) Violin Plots depict the differences of Cckar regional expression for cluster 6 neurons.
(F) Violin Plot of human CCKAR expression shows similar regional expression.
(G-I) HCR FISH section images for mouse Cckar reveal frequent Nefl and Klhl1 co-localization in duodenal IPANs (arrowheads; cluster 6 in A); infrequent co-expression in the ileum and colon, and absence of Cckar in some colonic IPANs (arrows).
(J-L) Human HCR FISH section images show that mice and humans have similar regional expression of CCKAR but that expression is not localized to KLHL1+ neurons in humans (arrowheads), in contrast with mice.
CCKAR was examined further as a result of its marked expression differences in the small and large intestine of both mice and humans (Figure 7D–F). In mice, Cckar expression was restricted to clusters 6 and 3 (Figures 7D–E, S10E, S11). We examined Cckar expression in mouse cluster 6 subtype, given its classification as a putative IPAN, based on Nefl expression. Cckar expression was coincident with Nefl in mouse intestine by HCR and nearly entirely colocalized with Nxph2 and Klhl1 (Figures 7G, S10F). Far fewer Cckar+/Klhl1+ neurons were found in the ileum and colon (Figure 7H–I), consistent with snRNA-Seq data indicating that only 1% of neurons in the ileum and colon cluster 6 express Cckar.
Given that frequent, high Cckar expression among duodenal neurons was generally absent from other segments, we further examined snRNA-Seq data to assess whether Cckar expression defines distinct EN subtypes in cluster 6. Notably, the distribution of Cckar+ neurons for the duodenum, ileum and colon in UMAP space was uniform and intermingled with most Cckar[−] neurons, (Figure S11), suggesting that most Cckar[−] neurons in the ileum and colon are not distinct from other Cckar+ neurons in this cluster. We conclude that most neurons in cluster 6 likely represent a single EN subtype distributed throughout the intestine with regional differences in gene expression, as illustrated in Figure S11C.
CCKAR expression in humans was robust within myenteric neurons of the duodenum, as assessed with HCR, although few CCKAR+ neurons were observed in the ileum and none were detected in the colon (Figures 7J–L). Unexpectedly, CCKAR expression was not localized to any neurons expressing KLHL1 (Figure 7J–L), in contrast to mice (Figure 7G–I). Attempting to determine the identity of CCKAR+ neurons, we examined the co-expression of CCKAR with alternative neuronal subtype markers. CCKAR expression was not detected in any IPANs, despite observing many instances of co-expression with many OTOF (Figure S10G). Based on these findings, it does not appear that human CCKAR is expressed in many more neuronal subtypes than in mice, despite both species exhibiting robust and region-specific expression within the ENS.
Sex effects on gene expression in human ENS and mouse EN
Given the male bias among Hirschsprung patients and sex effects in other intestinal motility disorders 21, we examined sex differences of gene expression in our data. Multiple human genes were highly differentially expressed between males and females (Supplemental Methods, Figure S12). Similar results were obtained for mice, with increased expression of Cntnap5a and Sst for females in EN clusters 0 and 5 (Figure S12C–D). Most differences were observed across all neuron subtypes, with UTY, DDX3Y, and KDM5D being expressed robustly in male EN, although not females (Tables S8 and S9). These particular genes also exhibited sex-based differential expression among human myenteric ganglia (Figure S12A).
Similarities in EN subtypes between juvenile and adult mice
While many EN are generated during embryogenesis, some subtypes are generated postnatally and ENS maturation occurs over adolescence12, 13. We found when comparing EN snRNA-Seq from juvenile mice (P21–23)11 to adult EN, most established EN subtypes in adult mice are present by weaning (Figure S13). However, four EN clusters detected in adults (clusters 11–14) were absent in juveniles. These differences may be biologically meaningful or could be attributable to differences in mouse lines, isolation methods, or numbers of EN sampled.
DISCUSSION
Here, we present a transcriptional catalog of genes expressed in healthy adult human ENS that is complemented by the parallel generation of an atlas from EN and enteric glia of adult mice derived from pooled “bulk” populations and snRNA-Seq. The resulting atlases provide a means of localizing neuron types in situ and have tremendous potential to identify deficits in the ENS that contribute to GI disease.
We identified novel neuronal subtypes conserved between humans and mice. Prominently, NMU+ expression identifies IPANs in both species based on coincident labeling with known IPAN markers (Calcb/Calb2 in mice; CALB2/SST in humans). Similarly, we document conserved expression of NXPH2 in human and mouse colon, although the functional neuron subtype marked by this gene remains to be determined. Other genes marking EN subtypes were divergent between humans and mice, based on the subtype-specific marker genes we investigated. Specifically, Klhl1 marked IPANs in mice, but not in humans. Instead, KLHL1 labeled human Type III neurons based on colocalization with CALB1. Despite many similarities in EN subtype marker gene expression between the mouse and human, our findings suggest that caution is needed when making cross-species inferences for specific EN subtypes.
Our strategy to examine multiple regions of the GI tract with snRNA-Seq identified 22 myenteric EN subtypes throughout the entire intestine. We also obtained strong evidence that multiple EN subtypes have distinct, regional expression patterns of select marker genes in the intestine of both humans and mice. In humans, NMU expression labels the majority of small intestine IPANs (50–75% of total IPANs) with higher prevalence and specificity than any single marker previously reported. However, NMU only labeled 5–10% of human colonic IPANs (Figure S7B), consistent with the lower level of expression of colonic NMU in our human LCM RNA-Seq data (Table S2). The differential expression of NMU in EN along the GI tract illustrates regional expression of a subtype marker gene in humans and also implies heterogeneity of human colonic IPANs. Similarly, we found by snRNA-Seq and validated by HCR that Cckar exhibited regional differences in expression for both mice (Figure S11) and humans (Figure 7). Multiple instances of regional marker gene expression are evident in our mouse snRNA-Seq data for Otof (cluster 5), Grp and Calcrl (cluster 7), and Grp (cluster 9) (Figure S5). We also show several differences in prevalence of mouse EN subtypes, with some clusters being derived mostly from the small intestine or colon (Figure S3). Regionality of subtype-specific genes raises the possibility of developing therapeutics to target specific EN subtypes in one intestinal region while leaving neurons in other areas unaffected.
Analysis of IPANs is of critical interest given the prominent role of these neurons. Our findings confirm the existence of multiple IPAN subtypes previously indicated for mice6, 7 and expand the marker toolkit for localization. The potential existence of multiple types of IPANs in humans is open to further investigation. A recent ground-breaking method captured colonic EN from colon cancer patients for snRNA-Seq22. Based on this initial small dataset, the authors concluded there is likely only one subtype of human colonic IPAN. Our observation that NMU is expressed in only a small subset of human colonic IPANs suggests there may be more than one IPAN subtype. Additional snRNA-Seq isolations from human tissue focusing on this population could prove helpful in generating a more complete picture of IPANs in the adult ENS.
Over decades, EN subtypes have been defined by morphology, electrophysiology, neurotransmitters, innervation, and connectivity. We related the few known markers for these subtypes to our data set to identify their complete molecular profiles. This opens the door to future work dissecting EN functionality in refined EN subtypes and deriving new transgenic reporters for in vivo live cell labeling, optogenetics or pharmacogenetic manipulation.
Our findings significantly expand knowledge of regional expression for EN subtype-marker genes in the human intestine and illustrate the ability to detect EN subtypes independent of immunoreagents. Spatial distribution patterns of neurons throughout the gastrointestinal tract of adult humans were previously limited to only a few subtypes, including type III EN restricted to the small intestine and “giant” type II neurons of the upper duodenum1, 2. By targeting collection of healthy intestinal tissues from young individuals (18–35 years), our study is the first of its kind to establish a baseline for gene expression and spatial distribution of myenteric EN subtypes. Differences among EN populations in diseased or geriatric patients may identify essential EN subtypes affected in scenarios of inflammatory bowel disease, chronic constipation, or geriatric fecal impaction.
We further identified genes that are differentially expressed between male and female EN that offer new avenues to investigate sex bias of Hirschsprung disease and other motility disorders. Future efforts may identify additional sex-specific expression in submucosal EN that were not sampled by our study.
Efforts are ongoing to derive EN from induced pluripotent human stem cells23. While stem cell transplantation studies have successfully generated ENs that integrate into aganglionic bowel24, 25, it has not been possible to assess whether integrated cells accurately reflected adult EN subtypes. Our profiling of adult EN provides the first benchmark resource of its kind that can be used to assess whether EN generated by directed differentiation mimic in vivo counterparts.
In summary, our study is the first to undertake a comparative molecular analysis of EN subtypes between species, across multiple intestinal regions. This effort identified EN classes present all along the intestine with identification of marker genes and EN subtypes that exhibit regionality. Our application of HCR has permitted unprecedented visualization of EN subtypes without antibody limitations and an initial mapping of human EN subtypes across multiple bowel segments. The resources of this study offer both an improved framework for diagnosis of enteric neuropathies and other GI diseases with a neuronal basis.
Supplementary Material
ACKNOWLEDGEMENTS
We are grateful to the organ donors, their families, and staff of the International Institute for the Advancement of Medicine and Tennessee Donor Services. Technical advice was provided by Drs. Moustafa Attar, Seoeun Lee, Lori Zeltzer, and Bob Matthews. Computing support was provided by Dr. Jeffrey Smith.
Grant support: The Laser-capture microdissection instrument was funded by NIH grants P30-CA068485-14 and U24-DK059637-13 to the Tissue Pathology Shared Resource at VUMC. Flow sorting was performed in the VUMC Flow Core, supported by the Vanderbilt Ingram Cancer Center (P30 CA68485) and the Vanderbilt Digestive Disease Research Center (P30 DK058404). RNA sequencing and computing support was provided by the Genome Technology Access Center at Washington University, supported in part by NCI Award P30 CA91842 to the Siteman Cancer Center and ICTS/CTSA UL1TR002345 from the NCRR. This work was funded by NIH awards OT2-OD23850 to EMS2, RO1-DK103831 to KSL, OT2-OD024909 to JRM, with support for AAM on T32-DK007673. Experiments were supported in part by a Vanderbilt University TIPs Award: “Understanding the complexity of life one cell at a time” to EMS2 and KSL.
Abbreviations
- CALB1
Calbindin 1
- CALB2
Calbindin 2
- CCKAR
CCK Receptor Type A
- CDH9
Cadherin 2
- CHAT
Choline acetyltransferase
- EN
Enteric neuron
- ENS
Enteric nervous system
- FACS
fluorescence-activated cell sorting
- FISH
fluorescence in situ hybridization
- GO
Gene Ontology
- HCR
Hybridization chain reaction
- IPAN
Intrinsic Primary Afferent Neuron
- LCM
Laser-Capture Microdissection
- NEFL
Neurofilament
- NMU
Neuromedin U
- NOS1
Nitric oxide synthase
- NXPH2
Neurexophilin 2
- PCA
Principal Components Analysis
- SNAP25
Synaptosome Associated Protein 25
- snRNA-Seq
single-nucleus RNA-Sequencing
- Sox10
SRY (sex determining region Y)-box transcription factor 10
- SST
Somatostatin
Footnotes
Transcript Profiling: RNA-Seq data from this study have been deposited into the National Center for Biotechnology Information Gene Expression Omnibus (NCBI, GEO) under accession number: GSE153202. RNA Sequencing data is also accessible at DOI: 10.26275/atbr-h2hj.
Preprint Server Posting: A preprint version of this article was posted to bioRxiv after the original submission and can be accessed at the DOI https://www.biorxiv.org/content/10.1101/2020.07.03.187211v1
Disclosures: Authors do not have any relevant conflicts of interest.
Publisher's Disclaimer: This is a PDF file of an unedited manuscript that has been accepted for publication. As a service to our customers we are providing this early version of the manuscript. The manuscript will undergo copyediting, typesetting, and review of the resulting proof before it is published in its final form. Please note that during the production process errors may be discovered which could affect the content, and all legal disclaimers that apply to the journal pertain.
REFERENCES
Author names in bold designate shared co-first authorship.
- 1.Brehmer A Structure of enteric neurons. Advances in Anatomy, Embryology and Cell Biology 2006;186:1–91. [PubMed] [Google Scholar]
- 2.Zetzmann K, Strehl J, Geppert C, et al. Calbindin D28k-Immunoreactivity in Human Enteric Neurons. Int J Mol Sci 2018;19. [DOI] [PMC free article] [PubMed] [Google Scholar]
- 3.Bondurand N, Southard-Smith EM. Mouse models of Hirschsprung disease and other developmental disorders of the enteric nervous system: Old and new players. Dev Biol 2016;417:139–57. [DOI] [PMC free article] [PubMed] [Google Scholar]
- 4.Lake JI, Heuckeroth RO. Enteric nervous system development: migration, differentiation, and disease. Am J Physiol Gastrointest Liver Physiol 2013;305:G1–24. [DOI] [PMC free article] [PubMed] [Google Scholar]
- 5.Musser MA, Michelle Southard-Smith E. Balancing on the crest - Evidence for disruption of the enteric ganglia via inappropriate lineage segregation and consequences for gastrointestinal function. Dev Biol 2013;382:356–64. [DOI] [PMC free article] [PubMed] [Google Scholar]
- 6.Qu ZD, Thacker M, Castelucci P, et al. Immunohistochemical analysis of neuron types in the mouse small intestine. Cell and Tissue Research 2008;334:147–61. [DOI] [PubMed] [Google Scholar]
- 7.Morarach K, Mikhailova A, Knoflach V, et al. Diversification of molecularly defined myenteric neuron classes revealed by single cell RNA-sequencing. bioRxiv 2020:2020.03.02.955757. [DOI] [PMC free article] [PubMed] [Google Scholar]
- 8.Weidmann S, Schrodl F, Neuhuber W, et al. Quantitative estimation of putative primary afferent neurons in the myenteric plexus of human small intestine. Histochem Cell Biol 2007;128:399–407. [DOI] [PubMed] [Google Scholar]
- 9.Brookes SJ. Classes of enteric nerve cells in the guinea-pig small intestine. Anat Rec 2001;262:58–70. [DOI] [PubMed] [Google Scholar]
- 10.Memic F, Knoflach V, Morarach K, et al. Transcription and Signaling Regulators in Developing Neuronal Subtypes of Mouse and Human Enteric Nervous System. Gastroenterology 2018;154:624–636. [DOI] [PMC free article] [PubMed] [Google Scholar]
- 11.Zeisel A, Hochgerner H, Lonnerberg P, et al. Molecular Architecture of the Mouse Nervous System. Cell 2018;174:999–1014 e22. [DOI] [PMC free article] [PubMed] [Google Scholar]
- 12.Pham TD, Gershon MD, Rothman TP. Time of origin of neurons in the murine enteric nervous system: sequence in relation to phenotype. Journal of Comparative Neurology 1991;314:789–98. [DOI] [PubMed] [Google Scholar]
- 13.Parathan P, Wang Y, Leembruggen AJ, et al. The enteric nervous system undergoes significant chemical and synaptic maturation during adolescence in mice. Dev Biol 2020;458:75–87. [DOI] [PubMed] [Google Scholar]
- 14.May-Zhang AA, Deal KK, Southard-Smith EM. Optimization of Laser-Capture Microdissection for the Isolation of Enteric Ganglia from Fresh-Frozen Human Tissue. J Vis Exp 2018. [DOI] [PMC free article] [PubMed] [Google Scholar]
- 15.Corpening JC, Cantrell VA, Deal KK, et al. A Histone2BCerulean BAC transgene identifies differential expression of Phox2b in migrating enteric neural crest derivatives and enteric glia. Dev Dyn 2008;237:1119–32. [DOI] [PMC free article] [PubMed] [Google Scholar]
- 16.Beliveau BJ, Kishi JY, Nir G, et al. OligoMiner provides a rapid, flexible environment for the design of genome-scale oligonucleotide in situ hybridization probes. Proceedings of the National Academy of Sciences of the United States of America 2018;115:E2183–E2192. [DOI] [PMC free article] [PubMed] [Google Scholar]
- 17.Choi HMT, Schwarzkopf M, Fornace ME, et al. Third-generation in situ hybridization chain reaction: multiplexed, quantitative, sensitive, versatile, robust. Development 2018;145. [DOI] [PMC free article] [PubMed] [Google Scholar]
- 18.Brehmer A, Blaser B, Seitz G, et al. Pattern of lipofuscin pigmentation in nitrergic and non-nitrergic, neurofilament immunoreactive myenteric neuron types of human small intestine. Histochemistry and Cell Biology 2004;121:13–20. [DOI] [PubMed] [Google Scholar]
- 19.Han X, Wang R, Zhou Y, et al. Mapping the Mouse Cell Atlas by Microwell-Seq. Cell 2018;173:1307. [DOI] [PubMed] [Google Scholar]
- 20.Ling ITC, Sauka-Spengler T. Early chromatin shaping predetermines multipotent vagal neural crest into neural, neuronal and mesenchymal lineages. Nat Cell Biol 2019;21:1504–1517. [DOI] [PMC free article] [PubMed] [Google Scholar]
- 21.Prusator DK, Chang L. Sex-Related Differences in GI Disorders. Handb Exp Pharmacol 2017;239:177–192. [DOI] [PubMed] [Google Scholar]
- 22.Drokhlyansky E, Smillie CS, Van Wittenberghe N, et al. The enteric nervous system of the human and mouse colon at a single-cell resolution. bioRxiv 2019:746743. [DOI] [PMC free article] [PubMed] [Google Scholar]
- 23.Stamp LA. Cell therapy for GI motility disorders: comparison of cell sources and proposed steps for treating Hirschsprung disease. Am J Physiol Gastrointest Liver Physiol 2017;312:G348–G354. [DOI] [PubMed] [Google Scholar]
- 24.Metzger M, Caldwell C, Barlow AJ, et al. Enteric nervous system stem cells derived from human gut mucosa for the treatment of aganglionic gut disorders. Gastroenterology 2009;136:2214–25 e1-3. [DOI] [PubMed] [Google Scholar]
- 25.Hotta R, Stamp LA, Foong JP, et al. Transplanted progenitors generate functional enteric neurons in the postnatal colon. J Clin Invest 2013;123:1182–91. [DOI] [PMC free article] [PubMed] [Google Scholar]
- 26.Butler A, Hoffman P, Smibert P, et al. Integrating single-cell transcriptomic data across different conditions, technologies, and species. Nature Biotechnology 2018;36:411–420. [DOI] [PMC free article] [PubMed] [Google Scholar]
Associated Data
This section collects any data citations, data availability statements, or supplementary materials included in this article.