

Abstract
Background:
Obesity, a body mass index (BMI) ≥30 kg/m2, is linked to infertility, potentially through a greater risk of anovulation due to elevated androgens. Yet, previous studies have not directly assessed the impact of adiposity, or body fat, on anovulation in the absence of clinical infertility.
Objective:
To characterize associations between adiposity and anovulation among women menstruating on a regular basis.
Methods:
Women from the EAGeR trial (n=1200), a randomized controlled trial of low-dose aspirin and pregnancy loss among women trying to conceive, were used to estimate associations between adiposity and incident anovulation. Participants completed baseline questionnaires and anthropometry, and provided blood specimens. Women used fertility monitors for up to six consecutive menstrual cycles, with collection of daily first morning voids for hormone analysis in the first two menstrual cycles for prospective assessment of anovulation. Anovulation was assessed by urine pregnanediol glucuronide or luteinizing hormone concentration or the fertility monitor. Weighted mixed effects log-binomial regression was used to estimate associations between measures of adiposity and incident anovulation, adjusted for free (bioavailable) testosterone, anti-Mullerian hormone (AMH), serum lipids, and demographic and lifestyle factors.
Results:
343 (28.3%) women experienced at least one anovulatory cycle. Anovulation risk was higher per kg/m2 greater BMI (relative risk [RR] 1.03, 95% confidence interval CI: 1.01, 1.04), cm waist circumference (RR 1.01, 95% CI: 1.00, 1.02), mm subscapular skinfold (RR 1.02; 95 CI: 1.01, 1.03), and mm middle upper arm circumference (RR 1.04, 95% CI: 1.01, 1.06) adjusted for serum free testosterone, AMH, lipids, and other factors.
Conclusions:
Adiposity may be associated with anovulation through pathways other than testosterone among regularly menstruating women. This may account in part for reported associations between greater adiposity and infertility among women having menstrual cycles regularly. Understanding the association between adiposity and anovulation might lead to targeted interventions for preventing infertility.
Keywords: adiposity; anovulation; body mass index; infertility, female; obesity; testosterone
Background
Obesity is associated with irregular menstruation and anovulatory infertility,1–3 and is often linked to a diagnosis of polycystic ovary syndrome (PCOS).4 Obesity has also been linked with subfecundity, presumably due to an increased risk for anovulation associated with elevated androgens. Investigators speculate that greater testosterone levels secondary to hyperinsulinemia5 disrupt the hypothalamus-pituitary-ovary axis, increasing the risk for anovulation in obese women.6 Furthermore, data suggest that differences in serum lipids,7–10 inflammation,11, 12 leptin,13, 14 and the follicular microenvironment15 may be important in the association between obesity and anovulation. However, the impact of adiposity, or body fat, on fertility in the absence of obesity is not clearly understood.16 Moreover the biologic mechanisms by which adiposity affects ovulation remain unclear. A better understanding of the impact of adiposity on anovulation, which may affect up to 19% of menstrual cycles among healthy women,17 might lead to improved subfecundity interventions.18
Thus, disentangling the role of interdependent factors strongly associated with adiposity, such as androgens, lipids, and insulin, in impacting anovulation remains an important next step for developing helpful approaches to improve reproductive function and, potentially, shorten time to pregnancy among apparently healthy women with regular menstrual cycles. Although investigators have reported associations between obesity and anovulatory infertility,1–3 and speculate that more adiposity is associated with anovulatory cycles among women with regular menstrual cycles leading to conception delays, no studies have directly tested the association.6 Therefore, we prospectively examined the association of adiposity with incident anovulation among a large cohort of regularly menstruating women participating in the Effects of Aspirin in Gestation and Reproduction (EAGeR) trial. We hypothesized a priori that anovulation risk would be higher among women with greater adiposity independent of serum testosterone and serum lipids.
Methods
Cohort selection
Women were participants in the EAGeR trial, a multi-center, block randomized, double-blind, placebo-controlled trial that compared low dose aspirin to placebo among regularly menstruating women, after a history of one or two pregnancy losses.19 Participants were enrolled between 2007 and 2011 at one of four study centers: Buffalo, NY; Denver, CO; Salt Lake City, UT; and Scranton, PA. Eligible women were actively trying to conceive without fertility treatment, and: (i) were 18–40 years of age; (ii) reported menstrual cycles of 21–42 days length during the previous 12 months; (iii) had experienced one or two pregnancy losses; (iv) had no more than two prior live births; and (v) without a history of infertility or use of infertility treatment, clinically diagnosed PCOS or other anovulatory disorder, a major medical condition, uncontrolled thyroid disease, or recent alcohol abuse and illicit drug use.
Exposure
The study protocol was previously described in detail;19 relevant procedures for the current study are described here. Briefly, participants completed a baseline evaluation on day 2–3 of the menstrual cycle, including collection of random (mostly non-fasting) blood and urine specimens and completion of study questionnaires to capture demographic and lifestyle factors. We measured weight to the 0.1 kg, height to the 0.5 cm, natural waist, hip, and middle upper arm circumferences to the 0.1 cm, and subscapular, suprailiac, and triceps skinfolds to the 0.1 cm, using a Harpenden™ skinfold caliper (Harpenden Company, West Sussex, England). All measures were made in duplicate.
Participants were followed for up to six menstrual cycles of trying to conceive a pregnancy. Study visits, including blood and urine collection, were completed around the time of expected ovulation (mid-cycle) and again at the end of cycles, and during the expected time of next menses for the first two cycles of follow-up. End of cycle study visits were completed for the last four study cycles. During the first two study cycles, participants also collected daily first morning voids, which were stored in home freezers until transport to the study centers. All women were provided and instructed in the use of the Clearblue® fertility monitor (Inverness Medical Innovations, Waltham, MA) in order to time intercourse to the fertile window and to help in scheduling study visits. During study visits, research personnel downloaded urinary hormone data stored on the device. Additionally, women were provided with QuickVu hCG urine pregnancy tests (Quidel Co., San Diego, CA) for home use on the day of expected menses. Pregnancy tests were also administered during end of cycle study visits. Throughout follow-up, the women completed daily diaries, which characterized time-varying lifestyle factors, including perceived stress, physical activity, consumption of alcoholic and caffeinated beverages, and tobacco exposure.
Serum testosterone, anti-Mullerian hormone (AMH), and insulin analyses were previously described in detail.20 In brief, we first determined total testosterone using a Shimadzu Prominence Liquid Chromatogram (Shimadzu Scientific Instruments, Inc. Columbia, MD) coupled to an AB Sciex 5500 tandem mass spectrometer (AB SCIEX, Framingham, MA). We then estimated free testosterone as 24.00314 x T/log10SHBG-0.0499 x T2, with SHBG (sex hormone binding globulin) determined according to an electrochemiluminescence immunoassay using a COBAS 6000 analyzer (Roche Diagnostics, Indianapolis, IN). We measured insulin in a subset of n=195 with fasting blood specimens (coefficient of variation (CV) 3.1%), using an immunoassay with the Roche COBAS 6000 analyzer (Roche Diagnostics). AMH was analyzed by enzyme immunoassay using a Beckman Coulter diagnostic reagent kit (Beckman Coulter, Inc. Brea, CA). Interassay CVs were at most 6.6% using manufacturer provided and pooled in house quality controls.
The serum lipids analysis was previously described in detail.10 In brief, we quantified total cholesterol, high density lipoprotein (HDL)-cholesterol, low density lipoprotein (LDL)-cholesterol, and triglycerides in baseline blood serum collections using a Roche Cobas 6000 Analyzer (Roche Diagnostics). We measured free fatty acids (FFAs) using a colorimetric enzyme assay (WAKO Life Sciences, Mountain View, CA). Interassay CVs were at most 3.2% for the lipid measures, using the mean concentrations of manufacturer-provided controls, and 8.9% or 11.6% for FFAs, using low-level manufacturer (0.49 mEq/L) or in-house pooled serum controls, respectively.
Outcomes
We assessed anovulation through up to six consecutive study cycles using several data sources as previously described in detail.20 In brief, all 840 cycles resulting in an hCG-detected pregnancy were classified as ovulatory. In the absence of a pregnancy, 1094 cycles with a maximum luteal urine pregnanediol 3-glucuronide (PdG) concentration ≥5 μg/mL were classified as ovulatory,21 and 1277 cycles were classified as ovulatory without luteal PdG data but with a definitive luteinizing hormone (LH) >2.5 times the average of the last five days measured via the fertility monitor.22 This approach is less prone to falsely classifying an anovulatory cycle than other LH-based algorithms.17, 23 Finally, 77 cycles with a “peak” fertility monitor reading, indicative of surging urine LH in the presence of elevated estrone-glucuronide were classified as ovulatory, in the absence of adequate PdG or fertility monitor LH measurements. There were 291 unclassified cycles due to insufficient data, which we treated as missing during analysis.
Statistical analysis
We examined distributions for all covariates and assessed differences in covariate distributions between women with ovulation and anovulation. We natural log transformed serum hormones and lipids to normalize the distributions before analysis. We calculated BMI in kg/m2 and the sum of skinfolds in mm as measures of total (i.e., absolute) adiposity, and waist to hip ratio (WHR) as a measure of central adiposity.24–26
We used multiple log-binomial regression to assess associations between measures of adiposity, as predictors of incident anovulation in separate models, adjusted for free (bioavailable) testosterone, AMH, serum lipids, and demographic and lifestyle factors. Generalized linear mixed models were employed to account for up to six menstrual cycles of follow-up per woman. We constructed weights using the probability of no pregnancy in a cycle, as a function of covariates and other pregnancy predictors, to accommodate women with different numbers of follow-up cycles. Demographic and lifestyle factors were selected a priori to be included in regression models as confounders based on evidence for associations with predictor variables and anovulation,27 including: age in years;28 race as white vs. non-white;29, 30 quintiles of increasing annual household income as an indicator of socioeconomic status;31 categorical physical activity at baseline;3, 32–34 and prenatal vitamin use assessed at baseline. We also adjusted for time-varying covariates, including: daily stress level,35 assessed using an ordinal scale (i.e., 0=“no stress” to 3=“a lot of stress”); alcohol and coffee drinks consumed;36, 37 and active tobacco smoking.38 We incorporated a cross-product term between BMI and daily stress level to test their interaction.
We used natural cubic splines to assess potential non-linearity for BMI as a predictor of anovulation, and to investigate interactions with free testosterone (all women) or fasting insulin (n=195 women with fasting blood specimens). SAS version 9.4 (SAS Institute, Inc. Cary, NC) was used for statistical analysis.
Missing data
Among 3784 cycles of follow-up data were missing for: 366 (9.7%) stress level, 341 (9.0%) alcohol consumption, 346 coffee drinks (9.1%), and 346 active tobacco smoking (9.1%). Values were missing for <5% of other covariates. A total of 1024 women had complete data. We used a multiple imputation algorithm, with 50 imputed data sets, to account for individuals with missing covariate observations.
Sensitivity analyses
We adjusted for serum insulin in place of free testosterone in a sensitivity analysis to assess the impact among a subsample of 195 participants with fasting blood specimens.
Ethics approval
All participants provided written informed consent prior to enrollment and the protocol was approved by institutional review boards at each study site.
Results
Overall, we captured data for 3784 study cycles from 1200 women (306 women contributed one cycle and 894 contributed more than one cycle); we excluded 28 EAGeR participants for whom ovulation (n=14) or follow-up (n=14) data were unavailable. As shown in Table 1, there were 340 women with at least one anovulatory cycle (28.3%). There was no difference in ovulation according to low dose aspirin treatment assignment (difference 2.7%, 95% CI −3.6, 9.0), as reported previously.23 Women with anovulatory cycles had higher income (46.5%>$100,000/year, difference 8.5%, 95% CI 2.3, 14.7) and a longer average menstrual cycle length (difference 0.6 days, 95% CI 0.1, 1.1) than women with ovulatory cycles, and were less likely to use prenatal vitamins (difference −3.8%, 95% CI −7.4, 0.0), but were otherwise similar in terms of reproductive history and lifestyle factors.
Table 1.
Distribution of clinical, sociodemographic, reproductive, and lifestyle factors, by ovulation status
| Factor | Overalla (n=1200) | No anovulatory cycle (n=860) | One or more anovulatory cycle (n=340) |
|---|---|---|---|
| Clinical factors - | |||
| Randomized treatment group: n (%)b | |||
| Low dose aspirin | 602 (50.2) | 438 (50.9) | 164 (48.2) |
| Placebo | 598 (49.8) | 422 (49.1) | 176 (51.8) |
| Sociodemographic factors - | |||
| Age, years; mean ± SDb | 28.8 (4.8) | 28.8 (4.8) | 28.7 (4.6) |
| Race: n (%) | |||
| White | 1138 (94.8) | 815 (94.8) | 323 (95) |
| Non-white | 62 (5.2) | 45 (5.2) | 17 (5) |
| Education: n (%)b | |||
| Beyond high school | 1039 (86.7) | 740 (86.1) | 299 (87.9) |
| Up to high school | 160 (13.3) | 119 (13.9) | 41 (12.1) |
| Annual household income, $: n (%)b | |||
| > 100,000 | 484 (40.4) | 326 (38.0) | 158 (46.5) |
| 75,000–99,999 | 148 (12.3) | 112 (13.0) | 36 (10.6) |
| 40,000–74,999 | 178 (14.8) | 137 (15.9) | 41 (12.1) |
| 20,000–39,999 | 301 (25.1) | 216 (25.1) | 85 (25.0) |
| ≤ 19,999 | 88 (7.3) | 68 (7.9) | 20 (5.9) |
| Reproductive factors - | |||
| Menstrual cycle length, days: mean ± SDc | 29.6 (3.6) | 29.4 (3.4) | 30.0 (3.9) |
| Prenatal vitamin use: n (%)b | |||
| No | 91 (7.6) | 56 (6.5) | 35 (10.3) |
| Yes | 1109 (92.4) | 804 (93.5) | 305 (89.7) |
| Previous pharmaceutical contraceptive use: n (%)b | |||
| Ever Rx conception (estrogen /progesterone) | 1071 (93.9) | 762 (94.1) | 309 (93.6) |
| IUD & barrier/none | 69 (6.1) | 48 (5.9) | 21 (6.4) |
| Lifestyle factors - | |||
| Stress level; mean ± SDc | 0.8 (0.5) | 0.8 (0.5) | 0.8 (0.5) |
| Physical activity: n (%)b | |||
| Low | 320 (26.7) | 227 (26.4) | 93 (27.4) |
| Medium | 488 (40.7) | 351 (40.8) | 137 (40.3) |
| High | 392 (32.7) | 282 (32.8) | 110 (32.4) |
| Alcohol consumption: n (%)c | |||
| No | 697 (61.8) | 484 (60.9) | 213 (64.0) |
| Yes | 431 (38.2) | 311 (39.1) | 120 (36.0) |
| Daily coffee drinks: mean ± SDc | 0.7 (0.9) | 0.7 (0.8) | 0.8 (0.9) |
| No | 185 (16.4) | 144 (18.1) | 41 (12.3) |
| Yes | 943 (83.6) | 651 (81.9) | 292 (87.7) |
| Active tobacco smoking: n (%)c | |||
| No | 920 (81.6) | 655 (82.4) | 265 (79.6) |
| Yes | 208 (18.4) | 140 (17.6) | 68 (20.4) |
| Environmental tobacco smoke: n (%)c | |||
| No | 781 (69.2) | 576 72.5) | 205 (61.6) |
| Yes | 347 (30.8) | 219 (27.5) | 128 (38.4) |
Each woman was followed for up to six menstrual cycles;
baseline value;
average value across total cycles of follow-up.
Abbreviations: BMI, body mass index; IUD, intrauterine device; SD, standard deviation
Table 2 shows the distribution of measured adiposity indicators, serum hormones, and serum lipids at baseline, according to ovulatory status. Women with anovulatory cycles had higher adiposity indicator values than women with ovulatory cycles. Women with anovulatory cycles also had greater geometric mean serum free testosterone (ratio 1.17, 95% CI 1.11, 1.23), AMH (ratio 1.14, 95% CI 1.03, 1.27), LDL-cholesterol (ratio 1.04, 95% CI 1.00, 1.07), triglycerides (ratio 1.08, 95% CI 1.02, 1.15), and free fatty acid (ratio 1.12, 95% CI 1.03, 1.23) concentrations than women with ovulatory cycles expressed as a ratio of log transformed values, as well lesser HDL-cholesterol concentration (ratio 0.94, 95% CI 0.92, 0.97). Serum insulin concentration was modestly higher among anovulatory women in n=195 with fasting blood specimens, but was not correlated to free testosterone concentration (r 0.06, 95% CI −0.09, 0.21).
Table 2.
Baseline measures of adiposity indicators, serum hormones, and serum lipids among women with ovulatory and any anovulatory cycles during follow-up
| Factor | Overalla (n=1200) | No anovulatory cycle (n=860) | One or more anovulatory cycle (n=340) |
|---|---|---|---|
| Adiposity Indicators | |||
| BMI (kg/m2) | 25.6 (5.8) | 25.0 (5.5) | 27.2 (6.6) |
| Waist circumference (cm) | 85.5 (14.9) | 84.1 (14.2) | 89.0 (16.2) |
| Hip circumference (cm) | 106 (13.2) | 104.6 (12.4) | 109.4 (14.5) |
| Waist:hip ratio | 0.81 (0.07) | 0.81 (0.70) | 0.82 (0.07) |
| Waist:hip ratio (Z-score) | 0.00 (1.00) | −0.04 (0.97) | 0.10 (1.06) |
| Middle upper arm circumference (cm) | 29.8 (4.8) | 29.3 (4.6) | 31.0 (5.2) |
| Subscapular skinfold (mm) | 19.0 (9.0) | 18.0 (8.3) | 21.5 (10.4) |
| Suprailiac skinfold (mm) | 20.5 (11.0) | 19.5 (10.4) | 23.0 (12.2) |
| Triceps skinfold (mm) | 24 (10.2) | 23.2 (9.9) | 26.2 (10.9) |
| Sum of skinfold measures (mm)b | 64.5 (27.8) | 61.8 (26.3) | 72.0 (30.8) |
| Serum Hormones & Lipids | |||
| Free testosterone (ng/dL) | 0.28 (0.11) | 0.26 (0.10) | 0.31 (0.13) |
| AMH (ng/dL) | 2.7 (2.2) | 2.6 (2.1) | 3.0 (2.6) |
| Insulin (mIU/L)c | 9.0 (6.1) | 8.6 (5.9) | 9.9 (6.5) |
| LDL-cholesterol (mg/dL) | 98.4 (27.5) | 97.4 (27.4) | 101.0 (27.5) |
| HDL-cholesterol (mg/dL) | 49.5 (12.0) | 50.3 (12.4) | 47.5 (10.8) |
| Triglycerides (mg/dL) | 105.0 (51.0) | 102.6 (49.2) | 111.2 (55.3) |
| FFAs (mEq/L) | 0.44 (0.32) | 0.43 (0.33) | 0.48 (0.32) |
Notes: Data are geometric mean (standard deviation) except for waist:hip ratio Z-score.
Each woman was followed for up to six menstrual cycles;
sum of subscapular, suprailiac, and triceps skinfolds;
fasting only (n=195 overall, n=59 any anovulatory).
Abbreviations: AMH, anti-Mullerian hormone; BMI, body mass index; FFAs, free fatty acids; HDL, high density lipoprotein; LDL, low density lipoprotein
Using continuous predictors, we investigated associations between anovulation with individual adiposity indicators and waist-to-hip ratio Z-score in unadjusted models and then adjusted for serum hormones, serum lipids, and demographic and lifestyle factors (Table 3). In unadjusted univariate predictor models, we found higher risks for anovulation in association with higher values for all adiposity indicators. Greater serum testosterone was also associated with a higher risk for anovulation, and with weaker associations for AMH, LDL-cholesterol, triglycerides, and FFAs, whereas HDL-cholesterol was protective. Adjusted for confounding by serum hormones and lipids, and sociodemographic and lifestyle factors, we found higher anovulation risks in association with greater adiposity using most indicators, albeit strongest for BMI and middle upper arm circumference. Greater serum free testosterone concentration was consistently associated with higher anovulation risk than adiposity. We found similar associations in a sensitivity analysis using multiple imputation to accommodate unclassified cycles (eTable 1). We confirmed a linear dose-response association for BMI with anovulation using restricted cubic splines (Figure 1). We found similar results for BMI and anovulation, although with a larger effect for AMH (RR 1.24, 95% CI 1.09, 1.42), in a sensitivity analysis of n=614 cycles adjusted for serum insulin instead of testosterone, among n=195 women with fasting blood specimens (data not shown). There was no evidence for an interaction between daily stress and BMI (RR 0.99, 95% CI 0.96, 1.02). In contrast, Figure 2 suggests a stronger testosterone-anovulation association among women with BMI <25 kg/m2 than for women with higher BMI. There was no evidence for a non-linear relation to fasting insulin (data not shown).
Table 3.
Relative risk (RR) for anovulation associated with measured adiposity indicators, serum hormones, and serum lipids
| Predictor | Univariate modelsb | Multivariable modelsa | |||
|---|---|---|---|---|---|
| Model 1c | Model 2c | Model 3c | Model 4c | ||
| RR (95% CI) | RR (95% CI) | RR (95% CI) | RR (95% CI) | RR (95% CI) | |
| BMI (kg/m2) | 1.04 (1.02, 1.05) | 1.03 (1.01, 1.04) | - | - | - |
| Waist circumference (cm) | 1.02 (1.01, 1.02) | - | 1.01 (1.00, 1.02) | - | - |
| Hip circumference (cm) | 1.02 (1.01, 1.02) | - | - | 1.01 (1.00, 1.02) | - |
| Waist:hip ratio (Z-score) | 1.13 (1.03, 1.24) | - | - | - | 1.07 (0.96, 1.18) |
| Middle upper arm circumference (cm) | 1.05 (1.03, 1.07) | - | - | - | - |
| Subscapular skinfold (mm) | 1.02 (1.01, 1.03) | - | - | - | - |
| Suprailiac skinfold (mm) | 1.02 (1.01, 1.02) | - | - | - | - |
| Triceps skinfold (mm) | 1.02 (1.01, 1.03) | - | - | - | - |
| Sum of skinfold measures (mm)d | 1.01 (1.00, 1.01) | - | - | - | - |
| Free testosterone (ng/dL)e | 1.97 (1.56, 2.49) | 1.67 (1.26, 2.22) | 1.63 (1.22, 2.28) | 1.62 (1.21, 2.17) | 1.84 (1.40, 2.42) |
| AMH (ng/dL)e | 1.20 (1.06, 1.36) | 1.09 (0.95, 1.26) | 1.10 (0.95, 1.28) | 1.11 (0.96, 1.29) | 1.06 (0.92, 1.22) |
| LDL-cholesterol (mg/dL)e | 1.47 (1.02, 2.12) | 0.99 (0.67, 1.47) | 1.00 (0.68, 1.48) | 0.99 (0.67, 1.47) | 1.03 (0.70, 1.52) |
| HDL-cholesterol (mg/dL)e | 0.59 (0.39, 0.89) | 0.89 (0.53, 1.50) | 0.87 (0.52, 1.45) | 0.85 (0.50, 1.43) | 0.76 (0.45, 1.27) |
| Triglycerides (mg/dL)e | 1.26 (1.04, 1.54) | 1.02 (0.79, 1.31) | 1.04 (0.81, 1.34) | 1.02 (0.79, 1.31) | 1.07 (0.83, 1.38) |
| FFAs (mEq/L)e | 1.16 (1.01, 1.34) | 1.10 (0.95, 1.27) | 1.10 (0.95, 1.27) | 1.11 (0.96, 1.28) | 1.13 (0.98, 1.30) |
|
Predictor |
Multivariable modelsa | ||||
|---|---|---|---|---|---|
| Model 5c | Model 6c | Model 7c | Model 8c | Model 9c | |
| RR (95% CI) | RR (95% CI) | RR (95% CI) | RR (95% CI) | RR (95% CI) | |
| BMI (kg/m2) | - | - | - | - | - |
| Waist circumference (cm) | - | - | - | - | - |
| Hip circumference (cm) | - | - | - | - | - |
| Waist:hip ratio (Z-score) | - | - | - | - | - |
| Middle upper arm circumference (cm) | 1.04 (1.02, 1.06) | - | - | - | - |
| Subscapular skinfold (mm) | - | 1.02 (1.01, 1.03) | - | - | - |
| Suprailiac skinfold (mm) | - | - | 1.01 (1.00, 1.02) | - | - |
| Triceps skinfold (mm) | - | - | - | 1.01 (1.00, 1.02) | - |
| Sum of skinfold measures (mm)d | - | - | - | - | 1.01 (1.00, 1.01) |
| Free testosterone (ng/dL)e | 1.64 (1.23, 2.18) | 1.67 (1.25, 2.22) | 1.73 (1.31, 2.29) | 1.75 (1.32, 2.32) | 1.69 (1.27, 2.24) |
| AMH (ng/dL)e | 1.11 (0.96, 1.28) | 1.09 (0.94, 1.26) | 1.08 (0.93, 1.24) | 1.08 (0.93, 1.24) | 1.09 (0.94, 1.26) |
| LDL-cholesterol (mg/dL)e | 0.97 (0.66, 1.43) | 1.02 (0.69, 1.51) | 1.02 (0.69, 1.51) | 1.03 (0.70, 1.52) | 1.02 (0.69, 1.51) |
| HDL-cholesterol (mg/dL)e | 0.86 (0.51, 1.43) | 0.83 (0.50, 1.39) | 0.83 (0.49, 1.38) | 0.79 (0.48, 1.33) | 0.84 (0.50, 1.41) |
| Triglycerides (mg/dL)e | 1.03 (0.80, 1.33) | 1.02 (0.79, 1.33) | 1.05 (0.82, 1.35) | 1.07 (0.83, 1.38) | 1.04 (0.80, 1.33) |
| FFAs (mEq/L)e | 1.09 (0.95, 1.26) | 1.10 (0.96, 1.27) | 1.11 (0.96, 1.28) | 1.10 (0.95, 1.27) | 1.10 (0.95, 1.27) |
Notes: Excludes 291 unclassified cycles. We used multiple imputation for missing covariate observations.
Weighted log binomial regression using generalized mixed models to account for up to six cycles for each woman;
unadjusted, one model per factor;
adjusted for age, race, annual household income, baseline serum free testosterone, AMH, LDL-cholesterol, HDL-cholesterol, triglycerides, and FFA concentrations, and baseline physical activity and prenatal vitamin use, as well as daily stress level, alcohol consumption, coffee drinks, and active tobacco smoking;
sum of subscapular, suprailiac, and triceps skinfolds;
natural log-transformed.
Abbreviations: AMH, anti-Mullerian hormone; BMI, body mass index; FFAs, free fatty acids; HDL, high density lipoprotein cholesterol; LDL, low density lipoprotein cholesterol
Figure 1.
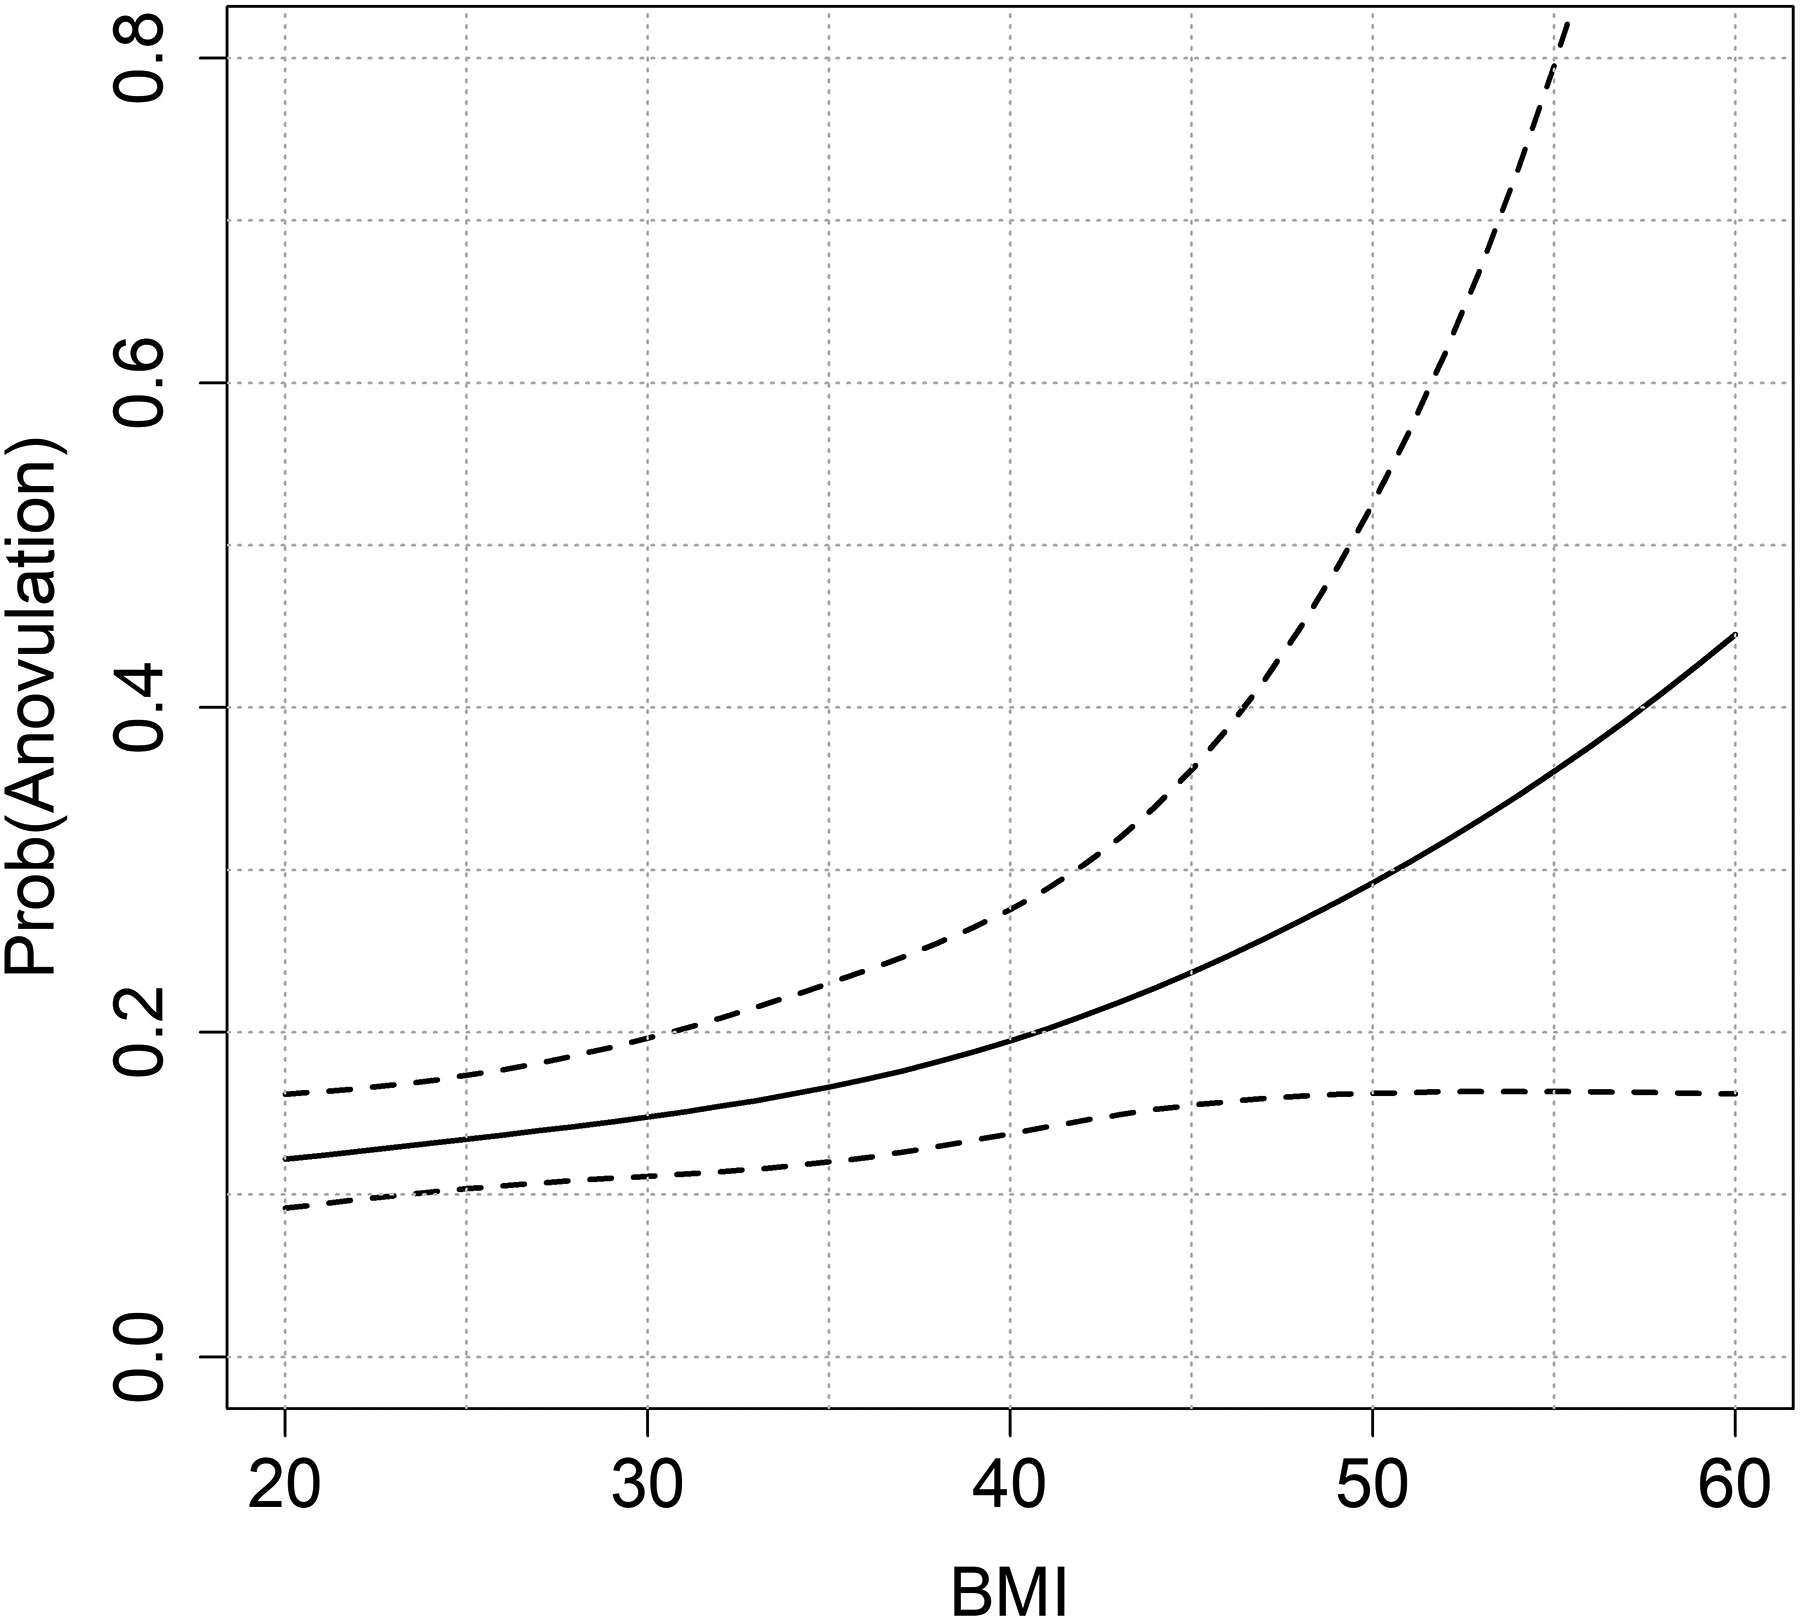
Probability for anovulation associated with BMI (kg/m2)
Figure 2.
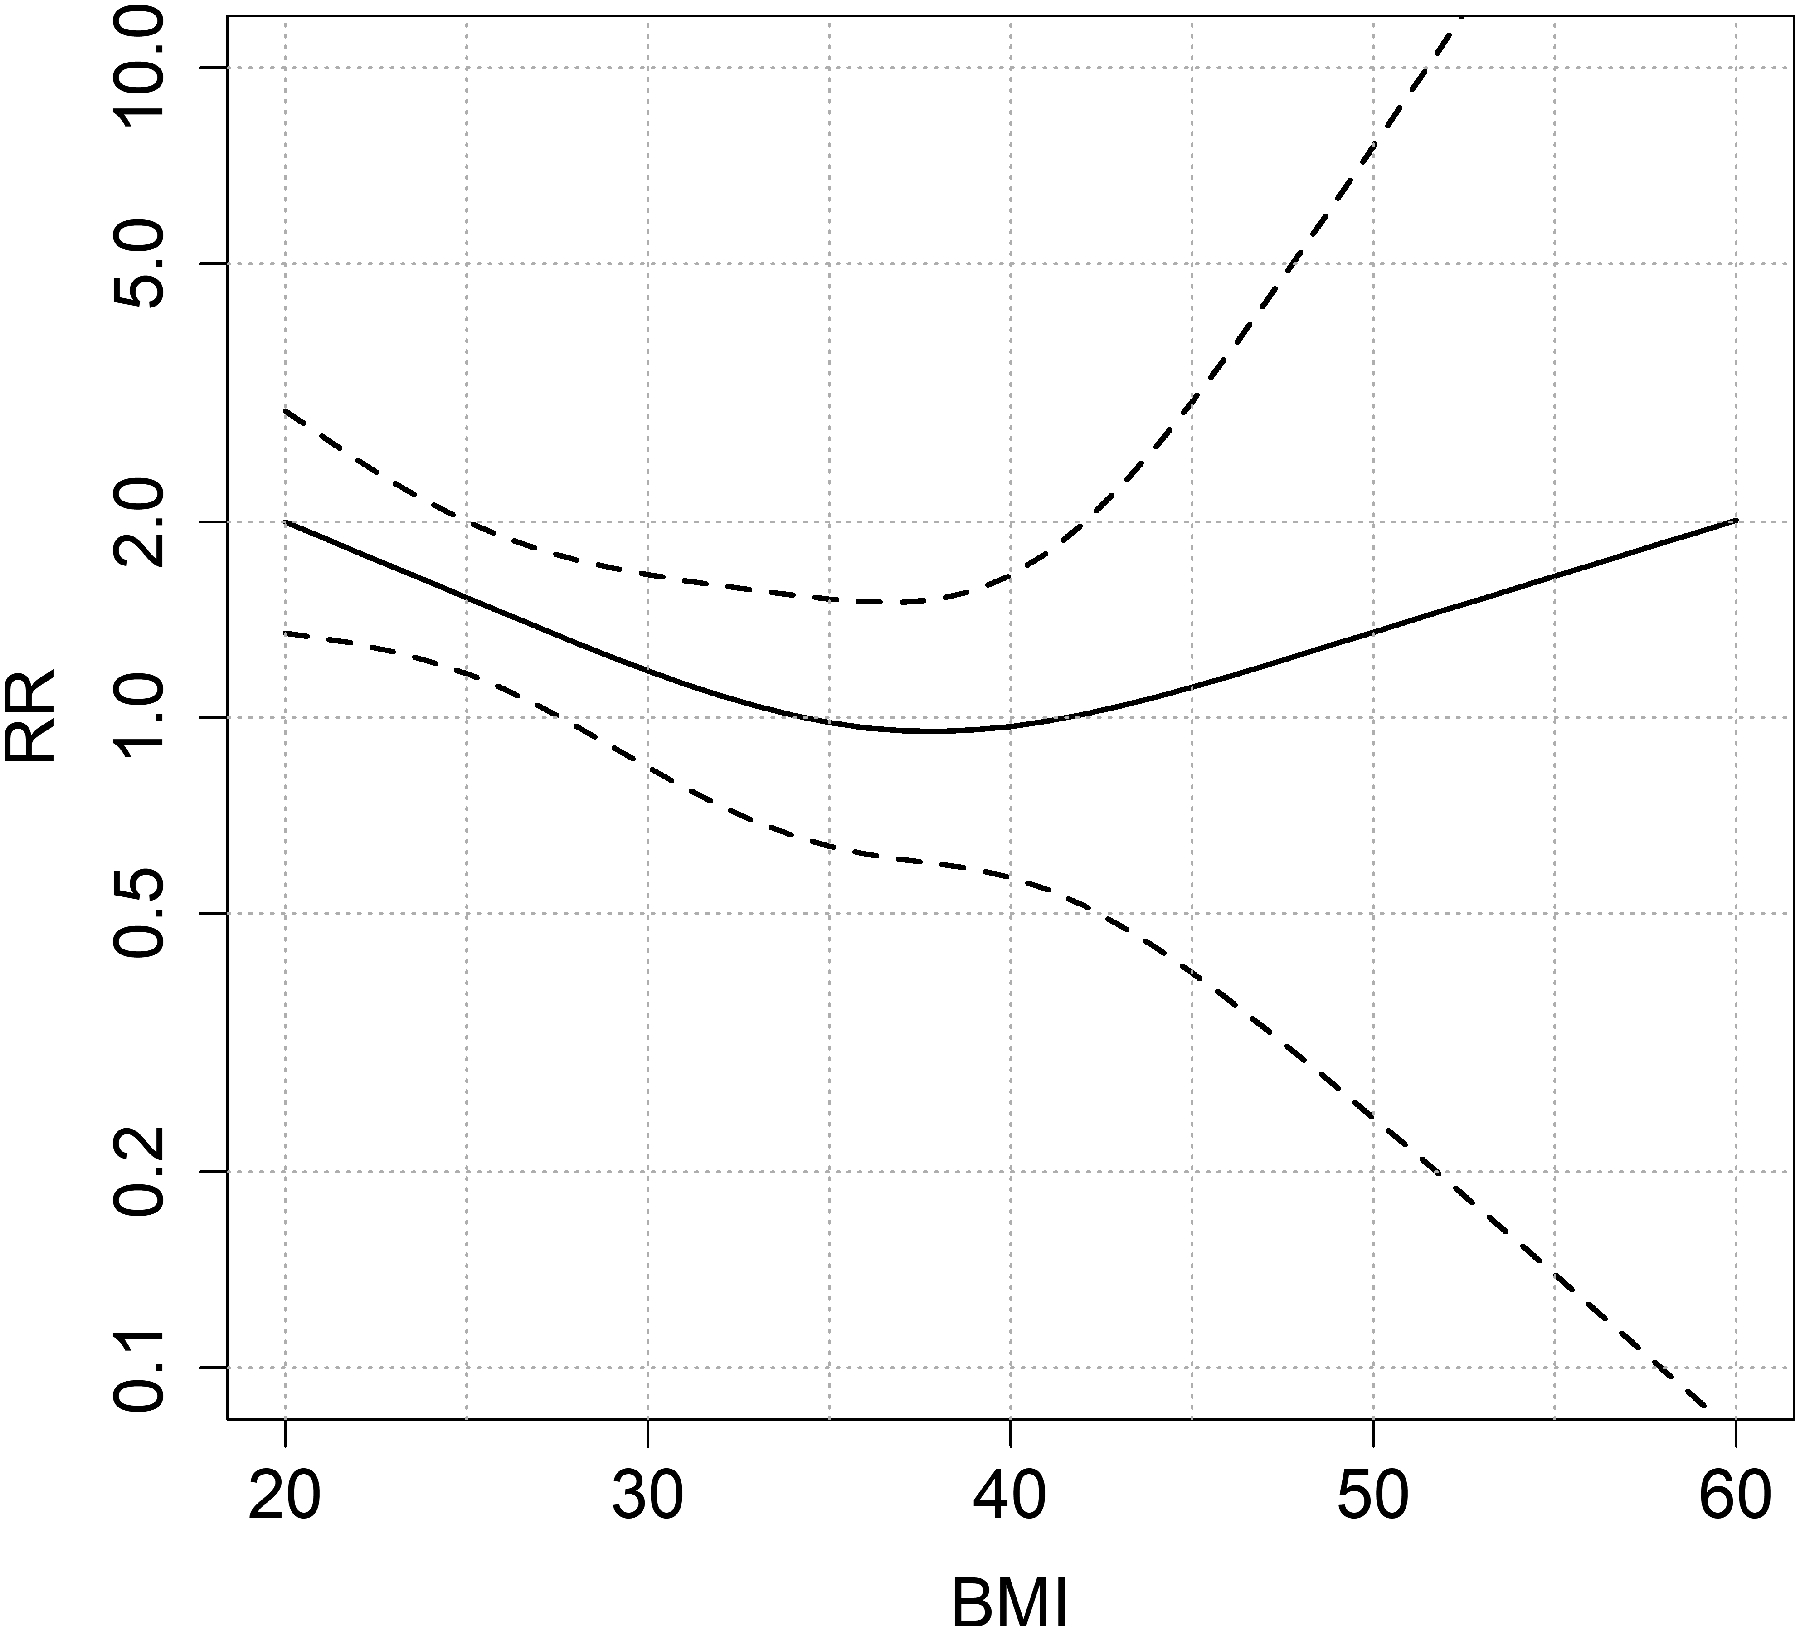
Relative risk (RR) for anovulation associated with a 1 loge difference in serum free testosterone (ng/dL), according to BMI (kg/m2)
Comment
Principal findings
Here we report greater risks for anovulation in association with adiposity indicators among women attempting to conceive a pregnancy for up to six consecutive menstrual cycles. Even in the absence of a clinical diagnosis of infertility or PCOS, higher baseline adiposity, measured as BMI, hip and waist circumferences, and skinfolds, were modest predictors of anovulation, adjusting for serum free testosterone and AMH, serum lipids and free fatty acids, and demographic and lifestyle factors. Still, testosterone was consistently of greatest importance, with effect estimates several times stronger than measures of adiposity. Using splines, the testosterone-anovulation association appeared to be strongest among normal/underweight women. Thus, greater adiposity might impact ovulation more substantially among obese women, whereas androgens might have greater relevance for normal/underweight women. Collectively, our results, suggest that anovulation is important to widely reported associations between female obesity and subfecundity, even among women menstruating on a regular basis, and that biologic pathways other than hyperandrogenemia may play a subtle but important role.
Strengths of the study
This study has several unique strengths that lend credibility to the results, including the prospective study design and a highly sensitive algorithm to ensure ascertainment of anovulatory cycles. In addition to measuring BMI, which does not distinguish lean mass from fat mass,39, 40 we measured skinfold thicknesses, which are purported to more accurately indicate adiposity.24 We also captured body fat distribution, using waist and hip circumferences and subscapular skinfold to assess central adiposity, and triceps skinfold and middle upper arm circumference to assess peripheral adiposity.25 We adjusted for a comprehensive panel of potential confounding variables as fixed and time-varying covariates using weighted multivariable regression, including free testosterone as a biomarker of androgen activity, AMH as a biomarker for potential undiagnosed mild PCOS phenotypes,41 and important lifestyle factors.
Limitations of the data
This study also has some important limitations. Although our use of non-fasting blood specimens may have increased exposure misclassification, particularly for serum lipids like triglycerides and free testosterone,42 we adjusted regression models for serum FFAs to indicate recent diet.43, 44 We restricted the analysis of insulin to fasting specimens. We also did not incorporate other potentially important dietary factors in the analysis.45 Finally, our study population was comprised of EAGeR trial participants, all of whom had experienced at least one prior pregnancy loss and were mostly white; this might limit the generalizability of the study results to women of color and those without a history of pregnancy loss.46 Our results have direct applicability to women with 1–2 losses. Given that loss occurs in 20–30% of pregnancies,47, 48 this is a highly relevant population to study, and applies to women with particular concerns about pregnancy timing and optimal reproduction function following a pregnancy loss. Still, we have no reason to expect different associations between adiposity and anovulation among women without losses and we had only a modestly lower proportion of obese participants (i.e., 23.8%, 95% CI 21.3, 26.2) than for non-Hispanic white U.S. women (32.8%, 95% CI 27.4, 38.8) in 2011–2012.49 Despite these limitations, the results of this study add to growing evidence that adiposity impacts anovulation among regularly menstruating women and may by extension affect female fecundity.
Interpretation
Investigators have reported associations between obesity and a clinical diagnosis of anovulatory infertility,1–3 and several have reported longer time to pregnancy in association with greater adiposity among women without an infertility diagnosis, but have not directly assessed anovulation. In the 1959–1965 U.S. Collaborative Perinatal Project, overweight (fecundability odds ratio [FOR] 0.82, 95% CI 0.84, 1.01) and obese (FOR 0.82, 95% CI 0.72, 0.95) women took longer to conceive a pregnancy than normal weight women.50 The results were similar when limited to women with regular menstrual cycles and with menstrual cycles 27–29 days long. A prospective investigation of more than 47,000 Dutch couples trying to conceive a pregnancy, reported greater odds for clinical infertility among overweight (OR 1.27, 95% CI 1.18, 1.36) and obese (OR 1.78, 95% CI 1.63, 1.95) women, relative to normal weight women, although associations varied according to partner’s BMI.51 A retrospective investigation of nearly 11,000 pregnant women from Denmark reported a lower fecundability ratio (FR), the probability of a clinically recognized pregnancy in a single menstrual cycle, among overweight compared to normal weight women with regular menstrual cycles (FR 0.70, 95% CI 0.61, 0.81), adjusted for confounding variables.52 A more recent, prospective internet-based investigation of Danish women reported longer waiting times for pregnancy among overweight (FOR 0.83, 95% CI 0.70, 1.00), obese (FOR 0.75, 95% CI 0.58, 0.97), and very obese (FOR 0.61, 95% CI 0.42, 0.88) women relative to normal weight women.53 The results were similar when adjusted for continuous BMI and for waist circumference. The likelihood for pregnancy also declined per kg/m2 BMI above 29 kg/m2 in a retrospective study of 3029 subfertile, but ovulating, Dutch women.54 Our results also suggest an association between greater BMI and anovulation among obese women, using splines.
Investigators have also reported associations between adipose tissue distribution and female fecundity. A recent prospective internet-based cohort study of more than 2000 North American women attempting to conceive a pregnancy described a non-linear trend between greater BMI and lower fecundity among women with BMI ≥30 kg/m2, and with stronger associations suggested for women with a tendency for central weight gain compared to overall weight gain.34 The authors also reported trends towards lower fecundity associated with greater waist circumference (FR 0.80, 95% CI 0.59, 1.09) and WHR (FR 0.87, 95% CI 0.74, 1.01), as BMI-adjusted measures of central adiposity. Consistent with these results, waist circumference, subscapular skinfold, and suprailiac skinfold, indicators of central adiposity, were predictors of incident anovulation in our study, and with a stronger positive, although imprecise, effect estimate for the association between incident anovulation and WHR Z-score. Middle upper arm circumference and triceps skinfold, measures of peripheral adiposity, were also associated with anovulation in our study.
Hyperandrogenemia secondary to hyperinsulinemia, which inhibits hepatic sex hormone binding globulin synthesis, coupled to increased peripheral aromatization of testosterone to estrogen, is often implicated in adiposity-associated disruption of the hypothalamus-pituitary-ovary axis and anovulation.5, 16 Yet, we found associations for greater adiposity after adjustment for serum free testosterone, and for fasting insulin in a subgroup analysis, suggesting the involvement of other biologic pathways. Serum leptin, a proinflammatory adipokine, helps regulate body weight among other activities. Serum leptin concentrations are greater among heavier than lighter individuals, and among women with a diagnosis of PCOS than among their non-PCOS counterparts.13 The results of experimental and epidemiologic studies suggest that changing leptin concentrations may alter ovulation,13, 58, 59 although the clinical impact is unclear.14 Other important biologic pathways may include differences in ovarian gene expression leading to a proinflammatory follicular environment and chronic systemic inflammation that impact ovulation.11, 12, 15 Anovulatory cycles might also be related to a mild PCOS phenotype in our data,60 although we excluded women with irregular menstrual cycles and also adjusted for AMH.41, 61 Greater concentrations of circulating free fatty acids may elicit toxic effects associated with greater adiposity, so-called “lipotoxicity,”62 with deleterious impacts on the hypothalamus-pituitary-ovary axis leading to anovulation.16, 63 A more nuanced investigation will be necessary to more definitively assess the biologic mechanisms underlying associations between adiposity and anovulation exclusive of hyperandrogenemia and the potential role of weight loss as a preventive measure.
Conclusions
Overall, the results of this prospective investigation suggest that adiposity, as indicated by BMI, waist circumference, middle upper arm circumference and skinfolds, predicts anovulation independent of testosterone, in the absence of a clinical infertility or PCOS diagnosis. We found the strongest adiposity associations for middle upper arm circumference and BMI, although measures of central adiposity were also important predictors of anovulation. In conclusion, our results suggest the presence of adiposity-related factors important to anovulation in addition to the effects of serum free testosterone and lipids. If confirmed, these results suggest that intervening on behalf of adiposity might improve fecundity, especially among obese women, whereas intervening on behalf of androgens might be effective among normal/underweight women. Still, a larger investigation in a more diverse study population will be necessary to more definitively characterize the pathophysiology of adiposity and to identify targets for clinical intervention to reduce subfecundity.
Supplementary Material
Social media quote.
Greater adiposity is associated with a higher risk for incident anovulation in regularly menstruating women without a clinical diagnosis of infertility or PCOS, independent of serum free testosterone and lipids.
Twitter handle: @ProfessorBloom
Synopsis.
Study question: Is adiposity, or body fat, associated with incident anovulation among women menstruating regularly?
What’s already known: Obesity (BMI >30 kg/m2) is associated with anovulation, likely due to increased testosterone. Greater adiposity is associated with poorer fecundity among women with regular menses. However, no studies have assessed the impact of adiposity on anovulation among women menstruating on a regular basis.
What this study adds: Adiposity was associated with incident anovulation, independent of testosterone, in women menstruating regularly. This may account in part for reported associations between greater adiposity and infertility among women with regular menstrual cycles.
Funding
This research was supported by the Intramural Research Program of the Eunice Kennedy Shriver National Institute of Child Health and Human Development, National Institutes of Health (Contract Numbers. HHSN267200603423, HHSN267200603424, and HHSN267200603426). Daniel L. Kuhr has been funded by the NIH Medical Research Scholars Program, a public-private partnership jointly supported by the NIH and generous contributions to the Foundation for the NIH by the Doris Duke Charitable Foundation (Grant #2014194), the American Association for Dental Research, the Colgate Palmolive Company, Genentech, and other private donors. For a complete list, visit the foundation website at http://www.fnih.org.
References
- 1.Green BB, Weiss NS, Daling JR. Risk of ovulatory infertility in relation to body-weight. Fertility and Sterility. 1988; 50:721–726. [PubMed] [Google Scholar]
- 2.Grodstein F, Goldman MB, Cramer DW. Body-mass index and ovulatory infertility. Epidemiology. 1994; 5:247–250. [DOI] [PubMed] [Google Scholar]
- 3.Rich-Edwards JW, Speigelman D, Garland M, Hertzmark E, Hunter DJ, Colditz GA, et al. Physical activity, body mass index, and ovulatory disorder infertility. Epidemiology. 2002; 13:184–190. [DOI] [PubMed] [Google Scholar]
- 4.Rachon D, Teede H. Ovarian function and obesity-interrelationship, impact on women’s reproductive lifespan and treatment options. Molecular and Cellular Endocrinology. 2010; 316:172–179. [DOI] [PubMed] [Google Scholar]
- 5.Nestler JE. Obesity, insulin, sex steroids and ovulation. International Journal of Obesity. 2000; 24:S71–S73. [DOI] [PubMed] [Google Scholar]
- 6.Talmor A, Dunphy B. Female obesity and infertility. Best Practice & Research Clinical Obstetrics & Gynaecology. 2015; 29:498–506. [DOI] [PubMed] [Google Scholar]
- 7.Mumford SL, Chavarro JE, Zhang CL, Perkins NJ, Sjaarda LA, Pollack AZ, et al. Dietary fat intake and reproductive hormone concentrations and ovulation in regularly menstruating women. American Journal of Clinical Nutrition. 2016; 103:868–877. [DOI] [PMC free article] [PubMed] [Google Scholar]
- 8.Mumford SL, Schisterman EF, Siega-Riz AM, Gaskins AJ, Steiner AZ, Daniels JL, et al. Cholesterol, endocrine and metabolic disturbances in sporadic anovulatory women with regular menstruation. Human Reproduction. 2011; 26:423–430. [DOI] [PMC free article] [PubMed] [Google Scholar]
- 9.Schisterman EF, Mumford SL, Browne RW, Barr DB, Chen Z, Louis GMB. Lipid concentrations and couple fecundity: the LIFE Study. Journal of Clinical Endocrinology and Metabolism. 2014; 99:2786–2794. [DOI] [PMC free article] [PubMed] [Google Scholar]
- 10.Pugh SJ, Schisterman EF, Browne RW, Lynch AM, Mumford SL, Perkins NJ, et al. Preconception maternal lipoprotein levels in relation to fecundability. Human Reproduction. 2017; 32:1055–1063. [DOI] [PMC free article] [PubMed] [Google Scholar]
- 11.Jung UJ, Choi MS. Obesity and its metabolic complications: the role of adipokines and the relationship between obesity, inflammation, insulin resistance, dyslipidemia and nonalcoholic fatty liver disease. International Journal of Molecular Sciences. 2014; 15:6184–6223. [DOI] [PMC free article] [PubMed] [Google Scholar]
- 12.Ruebel M, Shankar K, Gaddy D, Lindsey F, Badger T, Andres A. Maternal obesity is associated with ovarian inflammation and upregulation of early growth response factor 1. American Journal of Physiology-Endocrinology and Metabolism. 2016; 311:E269–E277. [DOI] [PubMed] [Google Scholar]
- 13.Perez-Perez A, Sanchez-Jimenez F, Maymo J, Duenas JL, Varone C, Sanchez-Margalet V. Role of leptin in female reproduction. Clinical Chemistry and Laboratory Medicine. 2015; 53:15–28. [DOI] [PubMed] [Google Scholar]
- 14.Kawwass JF, Summer R, Kallen CB. Direct effects of leptin and adiponectin on peripheral reproductive tissues: a critical review. Molecular Human Reproduction. 2015; 21:617–632. [DOI] [PMC free article] [PubMed] [Google Scholar]
- 15.Robker RL, Akison LK, Bennett BD, Thrupp PN, Chura LR, Russell DL, et al. Obese women exhibit differences in ovarian metabolites, hormones, and gene expression compared with moderate-weight women. Journal of Clinical Endocrinology & Metabolism. 2009; 94:1533–1540. [DOI] [PubMed] [Google Scholar]
- 16.Broughton DE, Moley KH. Obesity and female infertility: potential mediators of obesity’s impact. Fertility and Sterility. 2017; 107:840–847. [DOI] [PubMed] [Google Scholar]
- 17.Lynch KE, Mumford SL, Schliep KC, Whitcomb BW, Zarek SM, Pollack AZ, et al. Assessment of anovulation in eumenorrheic women: comparison of ovulation detection algorithms. Fertility and Sterility. 2014; 102:511–U252. [DOI] [PMC free article] [PubMed] [Google Scholar]
- 18.Legro RS. Effects of obesity treatment on female reproduction: results do not match expectations. Fertility and Sterility. 2017; 107:860–867. [DOI] [PubMed] [Google Scholar]
- 19.Schisterman EF, Silver RM, Perkins NJ, Mumford SL, Whitcomb BW, Stanford JB, et al. A randomised trial to evaluate the effects of low-dose aspirin in gestation and reproduction: design and baseline characteristics. Paediatric and Perinatal Epidemiology. 2013; 27:598–609. [DOI] [PMC free article] [PubMed] [Google Scholar]
- 20.Sjaarda LA, Mumford SL, Kuhr DL, Holland TL, Silver RM, Plowden TC, et al. Association of testosterone and antimüllerian hormone with time to pregnancy and pregnancy loss in fecund women attempting pregnancy. Fertility and Sterility. 2018; 109:540–548.e541. [DOI] [PMC free article] [PubMed] [Google Scholar]
- 21.Johnson S, Weddell S, Godbert S, Freundl G, Roos J, Gnoth C. Development of the first urinary reproductive hormone ranges referenced to independently determined ovulation day. Clinical Chemistry and Laboratory Medicine. 2015; 53:1099–1108. [DOI] [PubMed] [Google Scholar]
- 22.Park S, Goldsmith LT, Skurnick JH, Wojtczuk A, Weiss G. Characteristics of the urinary luteinizing hormone surge in young ovulatory women. Fertility and Sterility. 2007; 88:684–690. [DOI] [PubMed] [Google Scholar]
- 23.Radin RG, Sjaarda LA, Perkins NJ, Silver RM, Chen Z, Lesher LL, et al. Low-dose aspirin and sporadic anovulation in the EAGeR Randomized Trial. Journal of Clinical Endocrinology & Metabolism. 2017; 102:86–92. [DOI] [PMC free article] [PubMed] [Google Scholar]
- 24.Nevill AM, Stewart AD, Olds T, Holder R. Relationship between adiposity and body size reveals limitations of BMI. American Journal of Physical Anthropology. 2006; 129:151–156. [DOI] [PubMed] [Google Scholar]
- 25.Adab P, Pallan M, Whincup PH. Is BMI the best measure of obesity? BMJ. 2018; 360. [DOI] [PubMed] [Google Scholar]
- 26.Huxley R, Mendis S, Zheleznyakov E, Reddy S, Chan J. Body mass index, waist circumference and waist: hip ratio as predictors of cardiovascular risk-a review of the literature. European Journal of Clinical Nutrition. 2010; 64:16–22. [DOI] [PubMed] [Google Scholar]
- 27.Homan GF, Davies M, Norman RJ. The impact of lifestyle factors on reproductive performance in the general population and those undergoing infertility treatment: a review. Human Reproduction Update. 2007; 13:209–223. [DOI] [PubMed] [Google Scholar]
- 28.Scheffer GJ, Broekmans FJM, Dorland M, Habbema JDF, Looman CWN, Te Velde ER. Antral follicle counts by transvaginal ultrasonography are related to age in women with proven natural fertility. Fertility and Sterility. 1999; 72:845–851. [DOI] [PubMed] [Google Scholar]
- 29.Marsh EE, Shaw ND, Klingman KM, Tiamfook-Morgan TO, Yialamas MA, Sluss PM, et al. Estrogen levels are higher across the menstrual cycle in African-American women compared with Caucasian women. Journal of Clinical Endocrinology and Metabolism. 2011; 96:3199–3206. [DOI] [PMC free article] [PubMed] [Google Scholar]
- 30.Reutman SR, LeMasters GK, Kesner JS, Shukla R, Krieg EF Jr, Knecht EA, et al. Urinary reproductive hormone level differences between African American and Caucasian women of reproductive age. Fertility and Sterility. 2002; 78:383–391. [DOI] [PubMed] [Google Scholar]
- 31.Galobardes B, Shaw M, Lawlor DA, Lynch JW, Davey Smith G. Indicators of socioeconomic position (part 1). Journal of Epidemiology and Community Health. 2006; 60:7–12. [DOI] [PMC free article] [PubMed] [Google Scholar]
- 32.Craig CL, Marshall AL, Sjostrom M, Bauman AE, Booth ML, Ainsworth BE, et al. International physical activity questionnaire: 12-country reliability and validity. Medicine and Science in Sports and Exercise. 2003; 35:1381–1395. [DOI] [PubMed] [Google Scholar]
- 33.Wise LA, Rothman KJ, Mikkelsen EM, Sorensen HT, Riis AH, Hatch EE. A prospective cohort study of physical activity and time to pregnancy. Fertility and Sterility. 2012; 97:1136–1142.e1134. [DOI] [PMC free article] [PubMed] [Google Scholar]
- 34.McKinnon CJ, Hatch EE, Rothman KJ, Mikkelsen EM, Wesselink AK, Hahn KA, et al. Body mass index, physical activity and fecundability in a North American preconception cohort study. Fertility and Sterility. 2016; 106:451–459. [DOI] [PubMed] [Google Scholar]
- 35.Buck Louis GM, Lum KJ, Sundaram R, Chen Z, Kim S, Lynch CD, et al. Stress reduces conception probabilities across the fertile window: evidence in support of relaxation. Fertility and Sterility. 2011; 95:2184–2189. [DOI] [PMC free article] [PubMed] [Google Scholar]
- 36.Hatch EE, Wise LA, Mikkelsen EM, Christensen T, Riis AH, Sørensen HT, et al. Caffeinated beverage and soda consumption and time to pregnancy. Epidemiology. 2012; 23:393–401. [DOI] [PMC free article] [PubMed] [Google Scholar]
- 37.Schliep KC, Zarek SM, Schisterman EF, Wactawski-Wende J, Trevisan M, Sjaarda LA, et al. Alcohol intake, reproductive hormones, and menstrual cycle function: a prospective cohort study. American Journal of Clinical Nutrition. 2015; 102:933–942. [DOI] [PMC free article] [PubMed] [Google Scholar]
- 38.Whitcomb BW, Bodach SD, Mumford SL, Perkins NJ, Trevisan M, Wactawski-Wende J, et al. Ovarian function and cigarette smoking. Paediatric and Perinatal Epidemiology. 2010; 24:433–440. [DOI] [PMC free article] [PubMed] [Google Scholar]
- 39.Rothman KJ. BMI-related errors in the measurement of obesity. International Journal of Obesity. 2008; 32:S56. [DOI] [PubMed] [Google Scholar]
- 40.Okorodudu DO, Jumean MF, Montori VM, Romero-Corral A, Somers VK, Erwin PJ, et al. Diagnostic performance of body mass index to identify obesity as defined by body adiposity: a systematic review and meta-analysis. International Journal of Obesity. 2010; 34:791–799. [DOI] [PubMed] [Google Scholar]
- 41.Sjaarda LA, Mumford SL, Kissell K, Schliep KC, Hammoud AO, Perkins NJ, et al. Increased androgen, anti-müllerian hormone, and sporadic anovulation in healthy, eumenorrheic women: a mild PCOS-like phenotype? Journal of Clinical Endocrinology and Metabolism. 2014; 99:2208–2216. [DOI] [PMC free article] [PubMed] [Google Scholar]
- 42.Terrier J-E, Isidori AM. How food intakes modify testosterone level. The Journal of Sexual Medicine. 2016; 13:1292–1296. [DOI] [PubMed] [Google Scholar]
- 43.Hodson L, Skeaff CM, Fielding BA. Fatty acid composition of adipose tissue and blood in humans and its use as a biomarker of dietary intake. Progress in Lipid Research. 2008; 47:348–380. [DOI] [PubMed] [Google Scholar]
- 44.Ferrannini E, Barrett EJ, Bevilacqua S, Defronzo RA. Effect of fatty-acids on glucose-production and utilization in man. Journal of Clinical Investigation. 1983; 72:1737–1747. [DOI] [PMC free article] [PubMed] [Google Scholar]
- 45.Gaskins AJ, Chavarro JE. Diet and fertility: a review. American Journal of Obstetrics and Gynecology. 2018; 218:379–389. [DOI] [PMC free article] [PubMed] [Google Scholar]
- 46.Luke B Adverse effects of female obesity and interaction with race on reproductive potential. Fertility and Sterility. 2017; 107:868–877. [DOI] [PMC free article] [PubMed] [Google Scholar]
- 47.Miller JF, Williamson E, Glue J. Fetal loss after implantation. A prospective study. Lancet. 1980; 2:554–556. [DOI] [PubMed] [Google Scholar]
- 48.Wilcox AJ, Weinberg CR, O’Connor JF, Baird DD, Schlatterer JP, Canfield RE, et al. Incidence of early loss of pregnancy. New England Journal of Medicine. 1988; 319:189–194. [DOI] [PubMed] [Google Scholar]
- 49.Ogden CL, Carroll MD, Kit BK, Flegal KM. Prevalence of childhood and adult obesity in the United States, 2011–2012. JAMA. 2014; 311:806–814. [DOI] [PMC free article] [PubMed] [Google Scholar]
- 50.Gesink Law DC, Maclehose RF, Longnecker MP. Obesity and time to pregnancy. Human Reproduction. 2007; 22:414–420. [DOI] [PMC free article] [PubMed] [Google Scholar]
- 51.Ramlau-Hansen CH, Thulstrup AM, Nohr EA, Bonde JP, Sorensen TIA, Olsen J. Subfecundity in overweight and obese couples. Human Reproduction. 2007; 22:1634–1637. [DOI] [PubMed] [Google Scholar]
- 52.Jensen TK, Scheike T, Keiding N, Schaumburg I, Grandjean P. Fecundability in relation to body mass and menstrual cycle patterns. Epidemiology. 1999; 10:422–428. [DOI] [PubMed] [Google Scholar]
- 53.Wise LA, Rothman KJ, Mikkelsen EM, Sorensen HT, Riis A, Hatch EE. An internet-based prospective study of body size and time-to-pregnancy. Human Reproduction. 2010; 25:253–264. [DOI] [PMC free article] [PubMed] [Google Scholar]
- 54.van der Steeg JW, Steures P, Eijkemans MJC, Habbema JDF, Hompes PGA, Burggraaff JM, et al. Obesity affects spontaneous pregnancy chances in subfertile, ovulatory women. Human Reproduction. 2008; 23:324–328. [DOI] [PubMed] [Google Scholar]
- 58.Ahrens K, Mumford SL, Schliep KC, Kissell KA, Perkins NJ, Wactawski-Wende J, et al. Serum leptin levels and reproductive function during the menstrual cycle. American Journal of Obstetrics and Gynecology. 2014; 210. [DOI] [PMC free article] [PubMed] [Google Scholar]
- 59.Duggal PS, Van der Hoek KH, Milner CR, Ryan NK, Armstrong DT, Magoffin DA, et al. The in vivo and in vitro effects of exogenous leptin on ovulation in the rat. Endocrinology. 2000; 141:1971–1976. [DOI] [PubMed] [Google Scholar]
- 60.Moran L, Teede H. Metabolic features of the reproductive phenotypes of polycystic ovary syndrome. Human Reproduction Update. 2009; 15:477–488. [DOI] [PubMed] [Google Scholar]
- 61.Laven JSE, Mulders AGMGJ, Visser JA, Themmen AP, de Jong FH, Fauser BCJM. Anti-müllerian hormone serum concentrations in normoovulatory and anovulatory women of reproductive age. Journal of Clinical Endocrinology & Metabolism. 2004; 89:318–323. [DOI] [PubMed] [Google Scholar]
- 62.Sørensen TIA, Virtue S, Vidal-Puig A. Obesity as a clinical and public health problem: is there a need for a new definition based on lipotoxicity effects? Biochimica et Biophysica Acta (BBA) - Molecular and Cell Biology of Lipids. 2010; 1801:400–404. [DOI] [PubMed] [Google Scholar]
- 63.Wu LLY, Dunning KR, Yang X, Russell DL, Lane M, Norman RJ, et al. High-fat diet causes lipotoxicity responses in cumulus-oocyte complexes and decreased fertilization rates. Endocrinology. 2010; 151:5438–5445. [DOI] [PubMed] [Google Scholar]
Associated Data
This section collects any data citations, data availability statements, or supplementary materials included in this article.