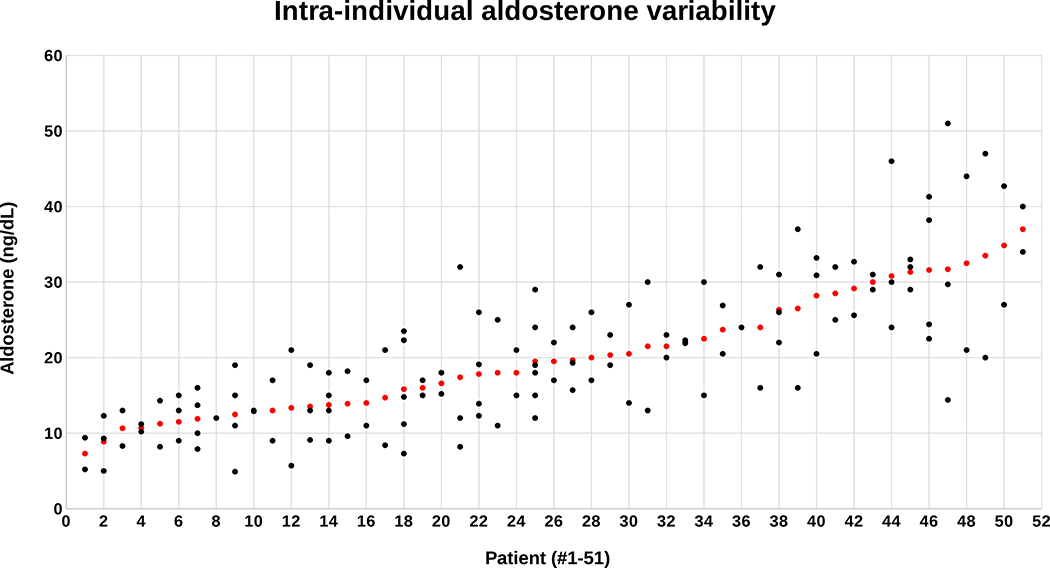
Figure 1: Scatterplot of screening aldosterone concentrations.
Individual aldosterone levels (black dots) are displayed directly above each patient on the x axis and arranged in order of the mean aldosterone concentration for each patient (red dot). All patients had at least two, or more, aldosterone measurements.

