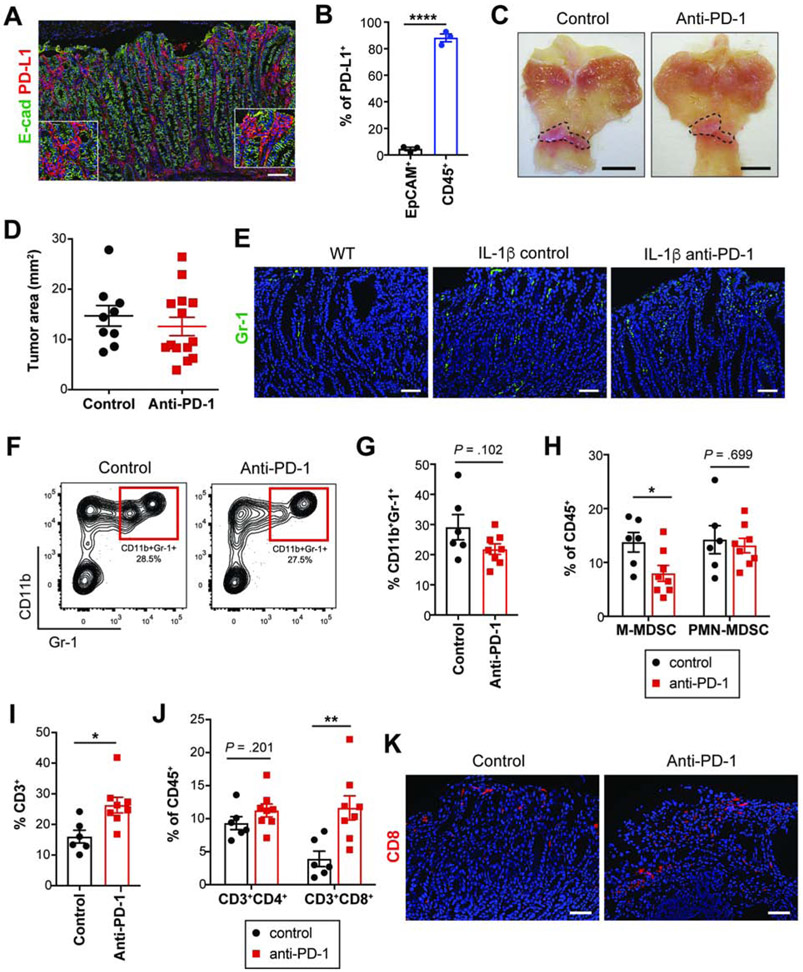
Figure 2. Early anti-PD-1 treatment in H/K-ATPase-IL-1β mice fails to delay tumor growth.
(A) E-cadherin and PD-L1 immunostaining on Hf/MNU/IL-1β tumors at 30 weeks post-MNU.
(B) PD-L1+ cells in EpCAM+ and CD45+ cells isolated from 30-week IL-1β tumors by flow cytometry (n = 3).
(C-D) Gross images (C) and tumor area measured (D) from control (n = 9) or anti-PD-1-treated (n = 14) IL-1β mice. Dotted lines indicate tumor area.
(E) Gr-1 immunostaining on tumors from WT and treated IL-1β mice.
(F-G) Contour plots showing tumor MDSCs (F) and quantification (G) from treated groups (n = 6-8/group).
(H-J) The proportion of MDSC subsets (H), T cells (I-J) in treated tumors (n = 6-8/group).
(K) CD8 immunostaining on treated tumors.
Scale bars, 100 μm (A); 5 mm (C); 50 μm (E and K). Mean ± SEM. Student’s t-test. *P < .05; **P < .01; ****P < .0001.

