

Abstract
Native mass spectrometry involves transferring large biomolecular complexes into the gas phase, enabling the characterization of their composition and stoichiometry. However, the overlap in distributions created by residual solvation, ionic adducts, and post-translational modifications creates a high degree of complexity that typically goes unresolved at masses above ~150 kDa. Therefore, native mass spectrometry would greatly benefit from higher resolution approaches for intact proteins and their complexes. By recording mass spectra of individual ions via charge detection mass spectrometry, we report isotopic resolution for pyruvate kinase (232 kDa) and β-galactosidase (466 kDa), extending the limits of isotopic resolution for high mass and high m/z by >2.5-fold and >1.6-fold, respectively.
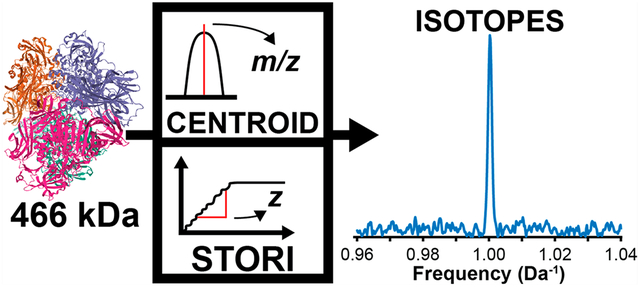
Graphical Abstract
Native mass spectrometry (nMS) is becoming more prevalent in studying complex biological systems. Capable of preserving the noncovalent interactions between complexed species for further analysis, nMS extends the reach of mass spectrometry in compositional proteomics1 and structural biology.2 Native MS also simplifies complicated spectra by both populating fewer charge states and increasing m/z differences because of lower charge states relative to denaturing electrospray conditions.3 Two things culminate in large signal increases for nMS, especially for ions in the high kilodalton to low megadalton regime: fewer charge state channels and a lower collisional cross section.3 However, the higher m/z values for ions in nMS are also associated with lower resolution in Fourier transform (FT) instruments due to their reduced frequencies and extended isotope beat patterns in the time domain.4 Consequently, recording data with an isotopic resolution of biomolecular noncovalent complexes >150 kDa is not generally possible.
The drive to record spectra with ever-higher resolution is a major thread weaved through the history of mass spectrometry. Across the 1990s, McLafferty and co-workers made leaps for protein MS, pushing the limit for isotopic resolution from 17 to 112 kDa.5–7 Through this period, the instrument of choice for high-resolution work was the FT-ion cyclotron resonance (ICR) in part due to powerful synergy among the Fellgett advantage,8,9 the independence of cycle frequency from ion kinetic energy,10 a capacity for long acquisition times, and the direct relationship between acquisition time and resolution.4 FT-ICR defined resolution limits well into the 2010s, eventually tackling noncovalent complexes with isotopic peaks resolved out to 158 kDa.11 Around this time, the means of achieving record isotopic resolution started to diverge. Advanced modeling improved FT-ICR cell design and helped extend the limit out to 186 kDa with tetrameric enolase,12 and the Orbitrap mass spectrometer demonstrated viability with the isotopic resolution of a 148 kDa antibody by using helium as a background gas13 and by using an individual ion workflow.14 This viability, especially with high-field Orbitraps, was anticipated since FT-ICR resolution (∝ 1/m/z) diminishes more drastically than Orbitrap resolution (∝ 1/√m/z) for the same increase in m/z.4
Individual ion collection and subsequent processing circumvent resolution limitations of classical spectral acquisition in mass spectrometry. This is because frequency assignment for isolated single ions enhances measurement accuracy without having to address complex beat patterns or ion coalescence.14 This aspect of charge detection mass spectrometry (CDMS) has been used on Orbitraps to assign the charge state of each ion with >96% accuracy using the integrated current induced during a <2 s detection period, a method termed individual ion mass spectrometry (I2MS).15 Individual ion analysis has increased the attainable effective resolving power by 10–20-fold.14 Since CDMS has been used to characterize megadalton-sized analytes,16,17 the potential of I2MS to set new resolution limits for native mass spectrometry is clear. While CDMS has already been utilized to improve the resolving power of ion traps,18,19 the massive disparity between ion traps and FT instruments in terms of resolving power suggests that the full potential of individual ion workflows is largely unrealized. Here, we report the realization of that potential with isotopic resolution for tetrameric pyruvate kinase (232 kDa) and tetrameric β-galactosidase (466 kDa), both of which were previously analyzed using ion trap CDMS.18,19 This work contributes to the decades-long evolution of mass spectrometry20 and will help future researchers obtain greater clarity on desolvation and molecular composition for ions and biological complexes of ever higher mass.
RESULTS AND DISCUSSION
Please refer to the detailed experimental methods in the Supporting Information for descriptions of methodology and terminology. Data obtained from an average of 15 ions per acquisition of tetrameric pyruvate kinase across 26 339 acquisitions were handled in two ways. First, we averaged the unprocessed m/z spectra and present that in Figure 1a, showing the charge state distribution with an effective resolving power of 1225 at m/z 6441. The blue rectangles indicate the relative abundance of charge states assigned by I2MS, which agree with the values obtained by direct spectral averaging. The experimental average mass was 231 834 ± 9 Da (charge states 34+ through 38+)21 within 1 Da of the theoretical value.
Figure 1.
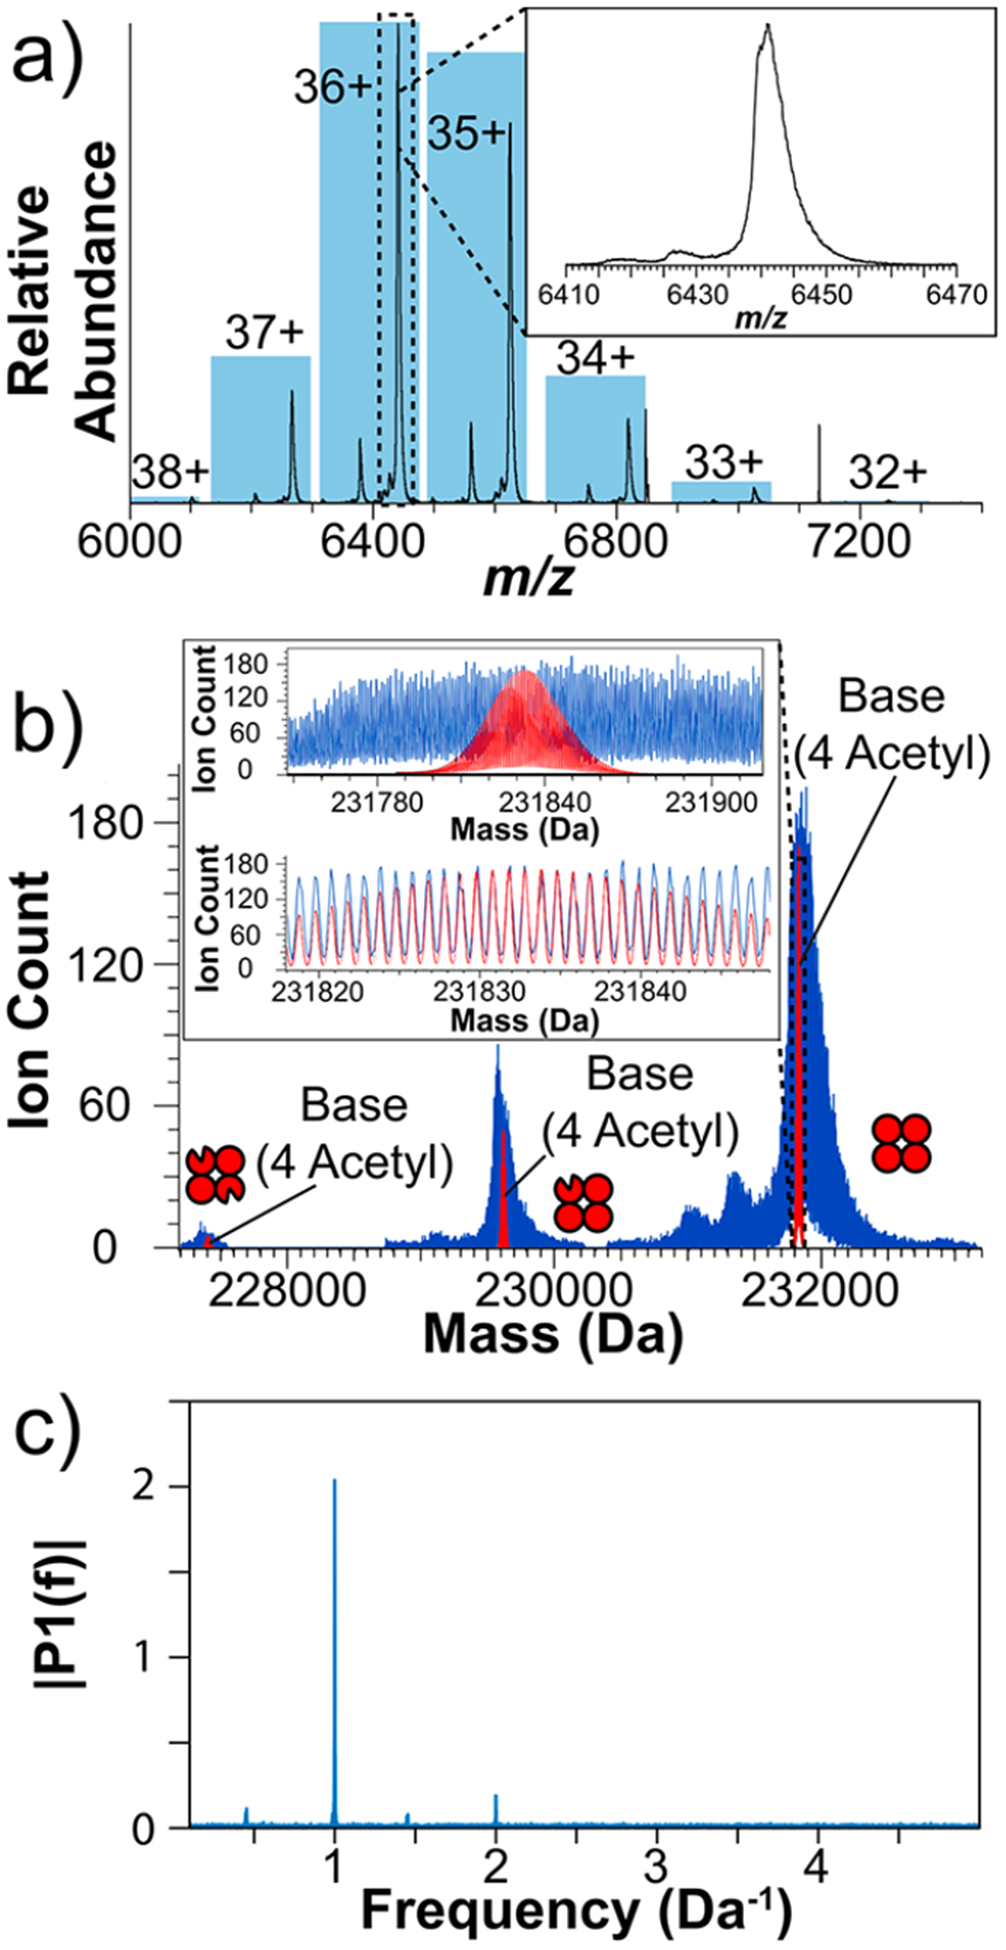
(a) Native mass spectrum of pyruvate kinase in the m/z domain created by averaging 26 339 unprocessed spectra. The inset shows an expansion of the most abundant charge state. The histogram overlay shows the relative abundance of ions assigned to charge states via the I2MS workflow. (b) The experimental I2MS mass spectrum of pyruvate kinase (blue trace) overlaid with the theoretical isotopic distribution calculated for a tetramer of pyruvate kinase where the base sequence of each monomer was modified with N-terminal acetylation (red trace). The secondary and tertiary distributions of pyruvate kinase correspond to tetrameric complexes that have one and two N-terminally truncated monomers, respectively. The inset shows two views of the overlay with different mass ranges. (c) Data obtained by Fourier transformation of the mass distribution of pyruvate kinase from panel b.
The same data set was processed through the I2MS workflow to filter out nonstable ion signals, assign charge, and create a spectrum in the mass domain. 0.28% of the assigned ions had charge states indicating they were from ions of far lower mass than pyruvate kinase (Figure S1). These stray “ions” come from the sharp instrument noise peaks at m/z 6848 and m/z 7133. The result of the I2MS workflow on the data is shown in Figure 1b with an overlay of the theoretical isotopic distribution (red) for tetrameric pyruvate kinase containing four N-terminally acetylated proteoforms, consistent with previous literature.22 Complexes containing one or two copies of a truncated monomer missing the first 22 N-terminal residues22 were detectable at ~44% and ~6% relative abundance, respectively (Figure 1b). The large region (~500 Da) to the right of the base distribution is most likely attributable to adductions, including residual solvent or metals.23 The region to the left of the base peak may result from stochastic losses (e.g., water, ammonia). The two minor peaks ~490 and ~780 Da below the base peak are likely due to two unique sequence variations, although no such annotation from the literature was found (Figure S2). The experimental data was linearly calibrated to account for systematic peak shifts independent of the I2MS process, reducing the isotopic peak error from −1.9 ± 0.2 ppm to 0.0 ± 0.1 ppm. The inset of Figure 1b displays an expanded isotopic overlay, which shows that the experimental spacing is congruent with the theoretical isotopic resolution. The average effective resolving power was 899 000 at m/z 6817 (Figure S3), a factor of 19 higher than the nominal resolution of these Orbitrap settings. To highlight the isotopic resolution clearly achieved, a Fourier transform was conducted on the experimental I2MS mass spectrum as put forth by Senko et al. (Figure 1c).24 A strong peak at 1 Da−1 was observed with a signal-to-noise ratio of ~380. This dominant peak corresponds with the isotopic resolution attained. Data obtained from ~90 000 ions (~22% the ion count of the original experiment) still exhibited an isotopic resolution with pyruvate kinase (Figure S4). The ability to obtain the isotopic resolution despite high spectral complexity at a wide range of ion counts demonstrates the reliability and flexibility of I2MS in native mode. We also overlaid the averaged, unprocessed data in the m/z domain onto the charge-adjusted I2MS spectrum so that the reader may explore how the major peak features seen in the traditional experiment are expressed in the higher-resolution I2MS form (Figure S1c).
To extend this approach higher in mass, we applied it to the ~0.5 MDa tetramer β-galactosidase (Figure 2). One potential issue with analyzing a native complex this large is the accuracy of mass calibration. With large differences in m/z, small inaccuracies in the calibration function could broaden experimental isotopic peaks in the true-mass domain when data from different charge states are pooled. This is in addition to the lower expected effective resolving power that comes with a higher m/z. To avoid complications that could arise from calibration, the 50+ charge state was isolated using the instrument’s quadrupole (~6 ions/acquisition for 15 999 acquisitions). Figure 2a shows the unprocessed, averaged spectrum of the 50+ charge state. The experimental average mass was 466 310 Da, which is 380 Da higher than the theoretical value of the unmodified tetramer. As expected, the inset does not show isotopic features with an effective resolving power of 846 for the entire signal distribution. The histogram of assigned I2MS charges (Figure S5) does not show any misassignments to the 49+ or 51+ charge states. However, 0.08% of the assigned ions had charge states that indicated they were much lower in mass than β-galactosidase; these lighter ions remain unidentified. In the Supporting Information, the charge-adjusted, processed spectrum is overlaid with the raw, averaged data to illustrate how the same experiment is represented with both data outputs (Figure S5c).
Figure 2.
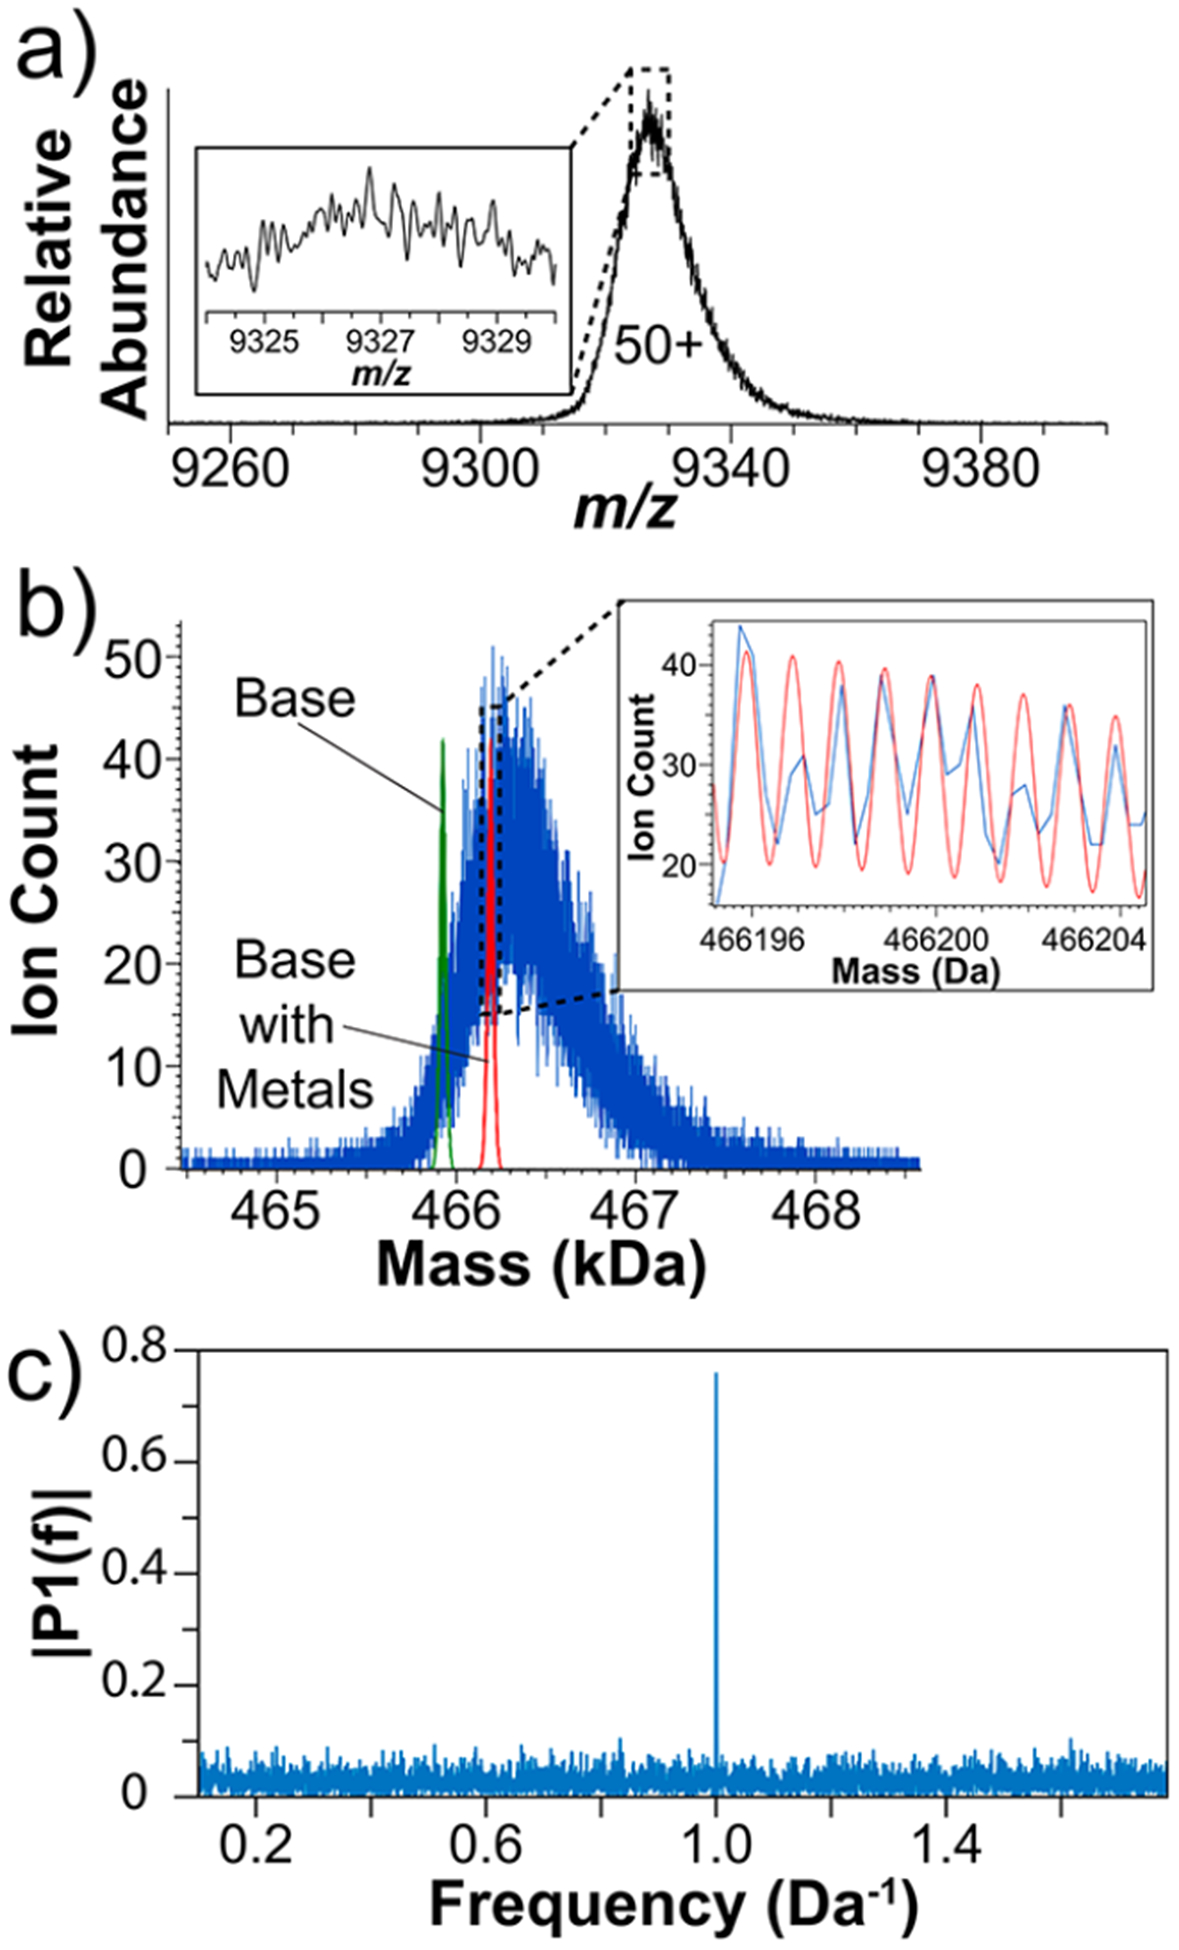
(a) Native mass spectrum of β-galactosidase in the m/z domain created by averaging 15 999 spectra. The inset shows an expanded view but does not show isotopes due to insufficient resolving power. (b) The experimental mass spectrum of β-galactosidase obtained by I2MS overlaid with the theoretical distributions calculated from the base, unmodified sequence (green) and the unmodified distribution plus metals (red, 8 magnesium and 4 sodium ions). The inset shows the resolution of isotopes and their alignment with the second theoretical distribution. (c) Data obtained by Fourier transformation of the mass distribution of β-galactosidase from panel b.
Figure 2b depicts the I2MS mass spectrum overlaid with the theoretical distributions calculated for the α4 complex (green) and the unmodified species plus 8 magnesium and 4 sodium ions (red),25 just one of many possible species contributing to the observed set of isotopic peaks. The large overall signal peak width (~800 Da fwhm) in comparison to that of the theoretical distribution (~40 Da fwhm) demonstrates a large degree of heterogeneity within the analyte peak. Denatured intact analysis indicates that the experimental average mass of the monomer is 116 481 ± 12 Da (at a nominal resolution of 4375 at m/z 200, charge states 23+ through 27+),21 ~1 Da below the theoretical monomer (data not shown). Therefore, the 360 Da difference between the unmodified tetrameric species and the center of the corresponding, deconvoluted experimental peak value must be due to noncovalent interactions instead of covalent modifications. In alignment with available 3D information,26 the complexity and mass shift relative to the unmodified and metal-containing distributions could be due to water adduction within the folded complex. The β-galactosidase experimental data was linearly calibrated to account for systematic peak shifts independent of the I2MS process, reducing the isotopic peak error from −0.7 ± 0.2 ppm to 0.0 ± 0.2 ppm. The inset of Figure 2b shows an expanded region and overlay of the metal-containing theoretical species atop the experimental data, and the overlap highlights how the experimental peak spacing indicates isotopic resolution. The effective resolving power was 779 000 at m/z 9317 (Figure S6). In the Fourier transform conducted on the experimental I2MS mass spectrum,24 a distinct peak at 1 Da−1 was observed with a signal-to-noise ratio of 38. This peak directly supports the assertion that the individual ion workflow enabled isotopic resolution of the highest mass and m/z ions yet reported, namely, those for β-galactosidase.
The β-galactosidase data show a greater deviation from ideal isotopic peak shapes, and the signal-to-noise ratio of the peak in the secondary Fourier transform reflecting the periodicity of the isotopic peaks was 10-fold lower than the analogous data for pyruvate kinase. While there is a stark 1 Da−1 peak in the case of pyruvate kinase alongside clearly resolved harmonic artifacts (Figure 1c), the peak at 1 Da−1 in the case of β-galactosidase is less intense, and no other notable features are detectable (Figure 2c). This difference in quality is expected. Strictly on the basis of m/z, the effective resolving power for pyruvate kinase should be ~20% higher than that of β-galactosidase for the same acquisition time and ion survival rate.4 Furthermore, the β-galactosidase experiment utilized only ~20% as many ions as the pyruvate kinase experiment. Spectral complexity is also a factor, as the fwhm of the β-galactosidase signal distribution is ~3× that of pyruvate kinase. However, despite these barriers for β-galactosidase, isotopic resolution was still achieved.
The demonstrated performance of the I2MS workflow advances the applicability of nMS to species >150 kDa. In the case where a proteoform distribution may be theorized, the attainment of an isotopic resolution of the species, however large, allows for a more informed analysis of proteins of extremely high complexity.14 Future studies will need to carefully explore ion preparation and desolvation before the clarity of molecular composition can be asserted for extremely high mass ions. At present, I2MS improves the accessibility of nMS by allowing an enhanced characterization option for assemblies up to 0.5 MDa in size. In a few minutes, a simple mean value for the centroid of a set of individual isotopes can give some sense about the breadth of a sample heterogeneity. Another powerful aspect of I2MS is the ability to sharply lower the minimum required ion survival time for high-resolution analysis. To attain the effective resolving power exhibited in the cases shown here without the use of I2MS, the measurement time for time domain signals would theoretically be much longer. Using the proportional relationship between the square root of an ion’s m/z and that ion’s period of oscillation in the Orbitrap chamber,4 the nominal resolutions used for pyruvate kinase and β-galactosidase are 48 000 at m/z 6817 and 128 000 at m/z 9317, respectively. As dictated by the proportional relationship between resolving power and the length of detection for each spectrum, the minimum required detection time in either case would be approximately 36 s. While 36 s is much lower than the 300 s analysis time demonstrated when achieving the isotopic resolution of a 186 kDa native complex on an FT-ICR,12 a large analyte survival past 6 s on Orbitrap instruments is currently nontrivial. However, even if these survival times were attainable with Orbitrap analyzers, routine implementation would be impractical. Holding the injection time and the ion beam density constant and utilizing the full 36 s (assuming sufficient ion survivability) would make the ~14 h pyruvate kinase experiment presented here take ~263 h, and the ~26 h β-galactosidase experiment would require ~159 h. In other words, the I2MS platform enables high-resolution native analysis of large complexes that could not be achieved before, practically or otherwise, on Orbitrap style FT instruments.
Regardless of the effective resolving power demonstrated in either case presented here, the massive heterogeneity exhibited remains a barrier for unambiguous characterization of the reported data. A given species cannot be reasonably attributed to an experimental mass in either case due to the high number of overlapping isotopic distributions. This uncertainty frustrated a clear demonstration of how higher resolution enables attainment of higher mass accuracy.20 Here, the correlation with MS1 data from monomers, obtained either from denaturing electrospray or via ejected monomers,1 did allow us to assert the atom composition of subunits and the inference that the majority of the complexity observed was due to the incomplete desolvation of these complexes. This can be further studied by the use of infrared dissociation or the adjustment of the source and vacuum conditions in future studies now that isotopic resolution can be achieved. Furthermore, isotopic resolution with noncovalent complexes also opens the prospect of thoroughly studying metal cofactors, which can skew isotopic distributions (Figure S7).
CONCLUSIONS
The reliable application of individual ion mass spectrometry without hardware modifications has proven effective in providing isotopic resolution of species much larger in both molecular weight and m/z than the previous record, a ~186 kDa native tetramer with a corresponding m/z value of ~5800.12 The new record at ~466 kDa and m/z ~9300 was achieved using an Orbitrap instrument and an I2MS workflow instead of an FT-ICR, the class of instrument that has traditionally held such records. Through the combination of nMS individual ion collection and charge detection methods, we demonstrated unprecedented mass resolution for native complexes that is poised for dissemination into the field with the established I2MS workflow. When one utilizes the I2MS approach, native complexes up to 0.5 MDa with m/z values of over 9000 can now be isotopically resolved, allowing a new look at high-mass ions. This can help clarify technical issues like solvation and adduction to create ions with fewer artifacts in the years ahead. Ultimately, this technology will enable the collection of higher-value information on cofactors, metal ions, post-translational modifications, and the stoichiometry of biomolecular assemblies. While the utility of ultrahigh resolution remains for future practitioners to demonstrate, it has not escaped our attention that low-frequency events such as mistranslation and the incorporation of rare translational products can also now be explored at the level of proteoforms or their complexes using I2MS.
Supplementary Material
ACKNOWLEDGMENTS
This work was completed with support from the Intensifying Innovation (I2) program at Thermo Fisher Scientific and was carried out in collaboration with the National Resource for Translational and Developmental Proteomics under Grant P41 GM108569 from the National Institute of General Medical Sciences, National Institutes of Health, RF1 AG063903 from the National Institute on Aging, and an instrumentation award (S10 OD025194) from the NIH Office of the Director. Further support from an F31 Fellowship to J.P.M. (F31 AG069456) and support from the National Institute on Drug Abuse (P30 DA018310) is also acknowledged.
Footnotes
Supporting Information
The Supporting Information is available free of charge at https://pubs.acs.org/doi/10.1021/acs.analchem.0c03282.
Detailed experimental methods; table of instrument parameters; complete data detailing charge state assignment histograms; charge assignment data organized along the m/z axis; comparisons among raw data, processed data, and theoretical values; average assigned resolutions along the m/z axis; a true-mass spectrum of pyruvate kinase after ~1 h of acquisitions; a comparison of isotope mass for three different multiproteoform complexes of pyruvate kinase (PDF)
Complete contact information is available at: https://pubs.acs.org/10.1021/acs.analchem.0c03282
The authors declare the following competing financial interest(s): M.W.S. and P.F.Y. are employees of Thermo Fisher Scientific.
REFERENCES
- (1).Skinner OS; Haverland NA; Fornelli L; Melani RD; Do Vale LHF; Seckler HS; Doubleday PF; Schachner LF; Srzentic K; Kelleher NL; Compton PD Nat. Chem. Biol 2018, 14, 36–41. [DOI] [PMC free article] [PubMed] [Google Scholar]
- (2).Muralidharan M; Mitra A; Maity D; Pal D; Mandal AK J. Struct. Biol 2019, 208, 107386. [DOI] [PubMed] [Google Scholar]
- (3).Kafader JO; Melani RD; Schachner LF; Ives AN; Patrie SM; Kelleher NL; Compton PD J. Am. Soc. Mass Spectrom 2020, 31, 574–581. [DOI] [PMC free article] [PubMed] [Google Scholar]
- (4).Zubarev RA; Makarov A Anal. Chem 2013, 85, 5288–5296. [DOI] [PubMed] [Google Scholar]
- (5).Loo JA; Quinn JP; Ryu SI; Henry KD; Senko MW; McLafferty FW Proc. Natl. Acad. Sci. U. S. A 1992, 89, 286. [DOI] [PMC free article] [PubMed] [Google Scholar]
- (6).Speir JP; Senko MW; Little DP; Loo JA; McLafferty FW J. Mass Spectrom 1995, 30, 39–42. [Google Scholar]
- (7).Kelleher NL; Senko MW; Siegel MM; McLafferty FW J. Am. Soc. Mass Spectrom 1997, 8, 380–383. [Google Scholar]
- (8).Marshall AG; Comisarow MB In Transform Techniques in Chemistry; Springer: Boston, MA, 1978; pp 39–68. [Google Scholar]
- (9).Fellgett PJ Phys. Radium 1958, 19, 187–191. [Google Scholar]
- (10).Marshall AG; Hendrickson CL; Jackson GS Mass Spectrom. Rev 1998, 17, 1–35. [DOI] [PubMed] [Google Scholar]
- (11).Li H; Wolff JJ; Van Orden SL; Loo JA Anal. Chem 2014, 86, 317–320. [DOI] [PMC free article] [PubMed] [Google Scholar]
- (12).Nikolaev EN; Vladimirov GN; Jertz R; Baykut G Mass Spectrom. 2013, 2, S0010. [DOI] [PMC free article] [PubMed] [Google Scholar]
- (13).Shaw JB; Brodbelt JS Anal. Chem 2013, 85, 8313–8318. [DOI] [PubMed] [Google Scholar]
- (14).Kafader JO; Melani RD; Senko MW; Makarov AA; Kelleher NL; Compton PD Anal. Chem 2019, 91, 2776–2783. [DOI] [PubMed] [Google Scholar]
- (15).Kafader JO; Beu SC; Early BP; Melani RD; Durbin KR; Zabrouskov V; Makarov AA; Maze JT; Shinholt DL; Yip PF; Kelleher NL; Compton PD; Senko MW J. Am. Soc. Mass Spectrom 2019, 30, 2200–2203. [DOI] [PMC free article] [PubMed] [Google Scholar]
- (16).Kafader JO; Melani RD; Durbin KR; Ikwuagwu B; Early BP; Fellers RT; Beu SC; Zabrouskov V; Makarov AA; Maze JT; Shinholt DL; Yip PF; Tullman-Ercek D; Senko MW; Compton PD; Kelleher NL Nat. Methods 2020, 17, 391–394. [DOI] [PMC free article] [PubMed] [Google Scholar]
- (17).Schultz JC; Hack CA; Benner WH J. Am. Soc. Mass Spectrom 1998, 9, 305–313. [DOI] [PubMed] [Google Scholar]
- (18).Hogan JA; Jarrold MF J. Am. Soc. Mass Spectrom 2018, 29, 2086–2095. [DOI] [PubMed] [Google Scholar]
- (19).Todd AR; Jarrold MF J. Am. Soc. Mass Spectrom 2020, 31, 1241–1248. [DOI] [PubMed] [Google Scholar]
- (20).Vanlear GE; McLafferty FW Annu. Rev. Biochem 1969, 38, 289–322. [DOI] [PubMed] [Google Scholar]
- (21).Winkler R Rapid Commun. Mass Spectrom 2010, 24, 285–294. [DOI] [PubMed] [Google Scholar]
- (22).Skinner OS; Havugimana PC; Haverland NA; Fornelli L; Early BP; Greer JB; Fellers RT; Durbin KR; Do Vale LHF; Melani RD; Seckler HS; Nelp MT; Belov ME; Horning SR; Makarov AA; LeDuc RD; Bandarian V; Compton PD; Kelleher NL Nat. Methods 2016, 13, 237. [DOI] [PMC free article] [PubMed] [Google Scholar]
- (23).Larsen TM; Laughlin LT; Holden HM; Rayment I; Reed GH Biochemistry 1994, 33, 6301–6309. [DOI] [PubMed] [Google Scholar]
- (24).Senko MW; Beu SC; McLafferty FW J. Am. Soc. Mass Spectrom 1995, 6, 52–56. [DOI] [PubMed] [Google Scholar]
- (25).Juers DH; Matthews BW; Huber RE Protein science: a publication of the Protein Society 2012, 21, 1792–1807. [DOI] [PMC free article] [PubMed] [Google Scholar]
- (26).Juers DH; Heightman TD; Vasella A; McCarter JD; Mackenzie L; Withers SG; Matthews BW Biochemistry 2001, 40, 14781–14794. [DOI] [PubMed] [Google Scholar]
Associated Data
This section collects any data citations, data availability statements, or supplementary materials included in this article.